
Market
Pi Network Might Fall Below $1 As Bearish Sentiment Rise

Pi Network (PI) dropped by another 9% on Friday, adding to its recent bearish momentum. The decline comes after Justin Bons called the project a potential “scam,” fueling negative sentiment.
Technical indicators like BBTrend and RSI are also pointing to sustained downside pressure. As the price struggles below $1, traders are watching to see if PI can stabilize or if further losses are ahead.
Pi Network BBTrend Reached Its Lowest Levels Ever
Pi Network’s BBTrend is currently at -40.69, marking its lowest reading on record and staying negative for the past five days. T
The BBTrend, or Bollinger Band Trend, is an indicator that measures trend direction and strength based on price movement relative to Bollinger Bands.
Positive values typically indicate bullish momentum, while negative values suggest bearish momentum, with extreme values often signaling strong trends.
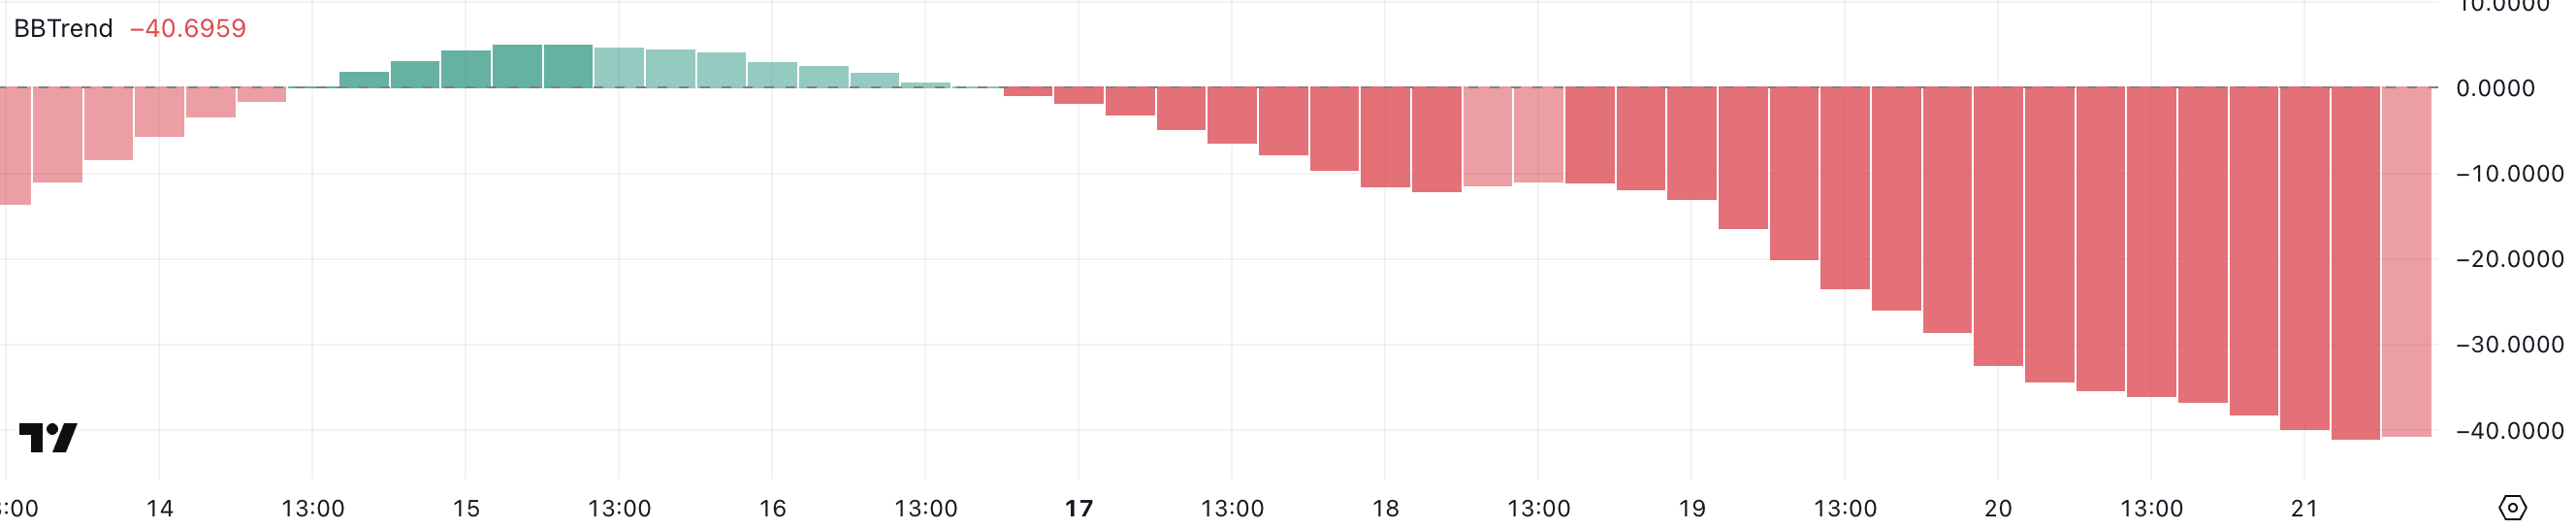
With Pi Network’s BBTrend sitting deeply in negative territory, it points to sustained bearish momentum.
This could suggest that sellers are firmly in control, and the asset may continue to face downward pressure unless a sharp reversal occurs.
A prolonged negative BBTrend like this often signals that the market is in a strong downtrend, and traders may remain cautious until signs of stabilization or a positive shift appear.
Pi Network RSI Is Recovering After Touching Oversold Levels
Pi Network’s RSI has rebounded to 36.15 after dropping as low as 17.5 just a few hours ago, showing a slight recovery in momentum.
The Relative Strength Index (RSI) is a momentum indicator that measures the speed and change of price movements. Values above 70 indicate overbought conditions, and values below 30 suggest an asset is oversold.
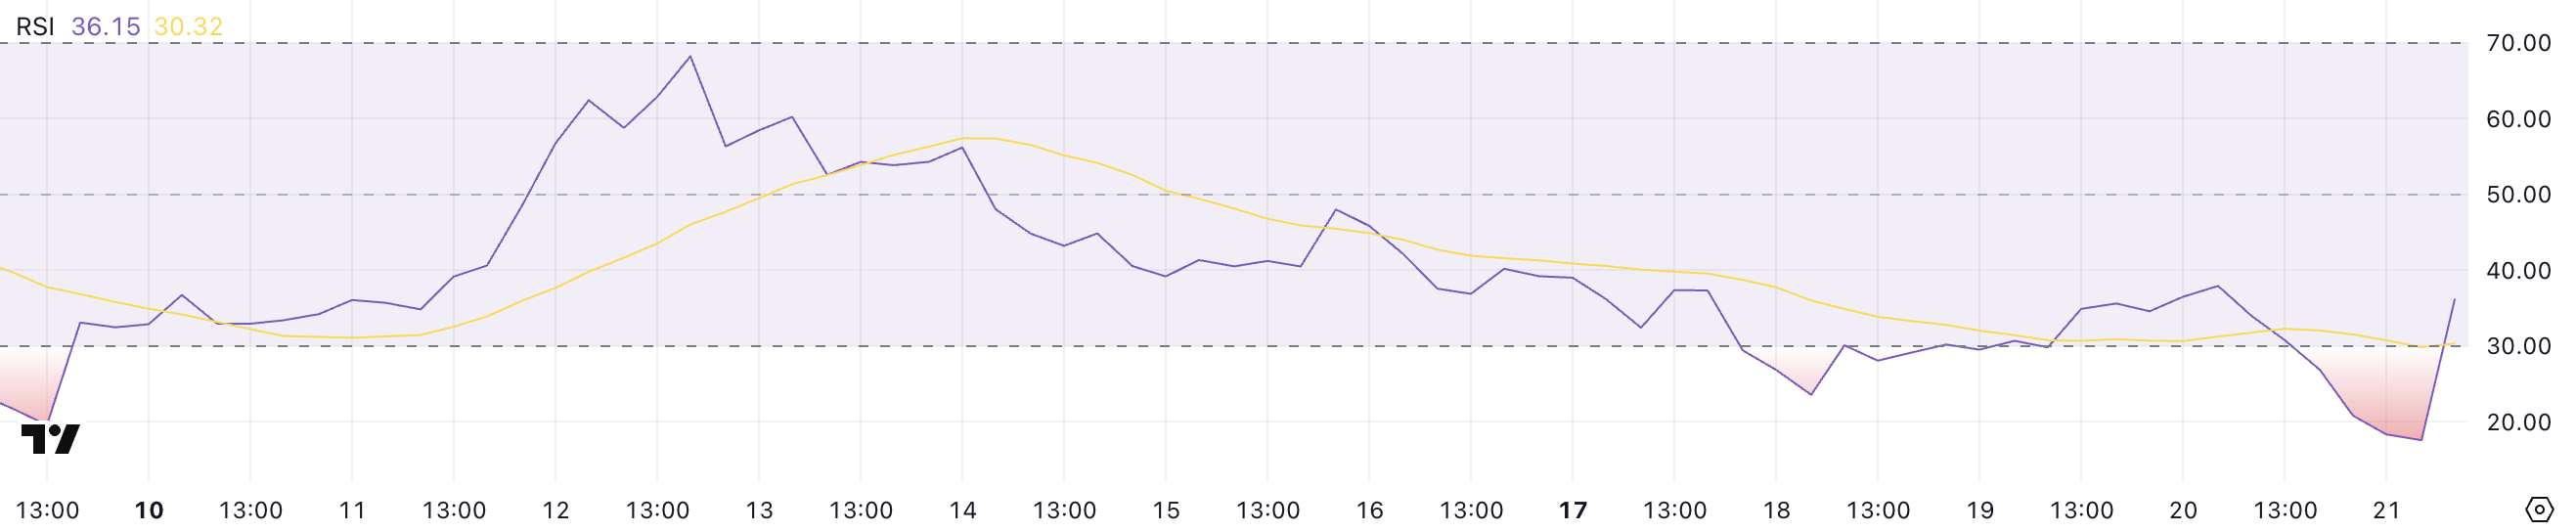
Pi Network’s RSI is now just above 36, moving out of the oversold zone but remaining in bearish territory.
This could imply that while some buying pressure has returned, the overall trend is still weak. Further upside will depend on whether the RSI continues to climb.
If the RSI fails to move higher, Pi Network may remain vulnerable to additional corrections.
Will PI Fall Below $0.90?
Pi Network has recently dropped below the $1 level for the first time since February 22 as bearish momentum builds. This decline comes as Justin Bons recently exposed Pi Network’s flaws, raising concerns and calling the project a potential “scam.”
If the correction deepens, PI price could test key support zones around $0.81 and possibly $0.62.
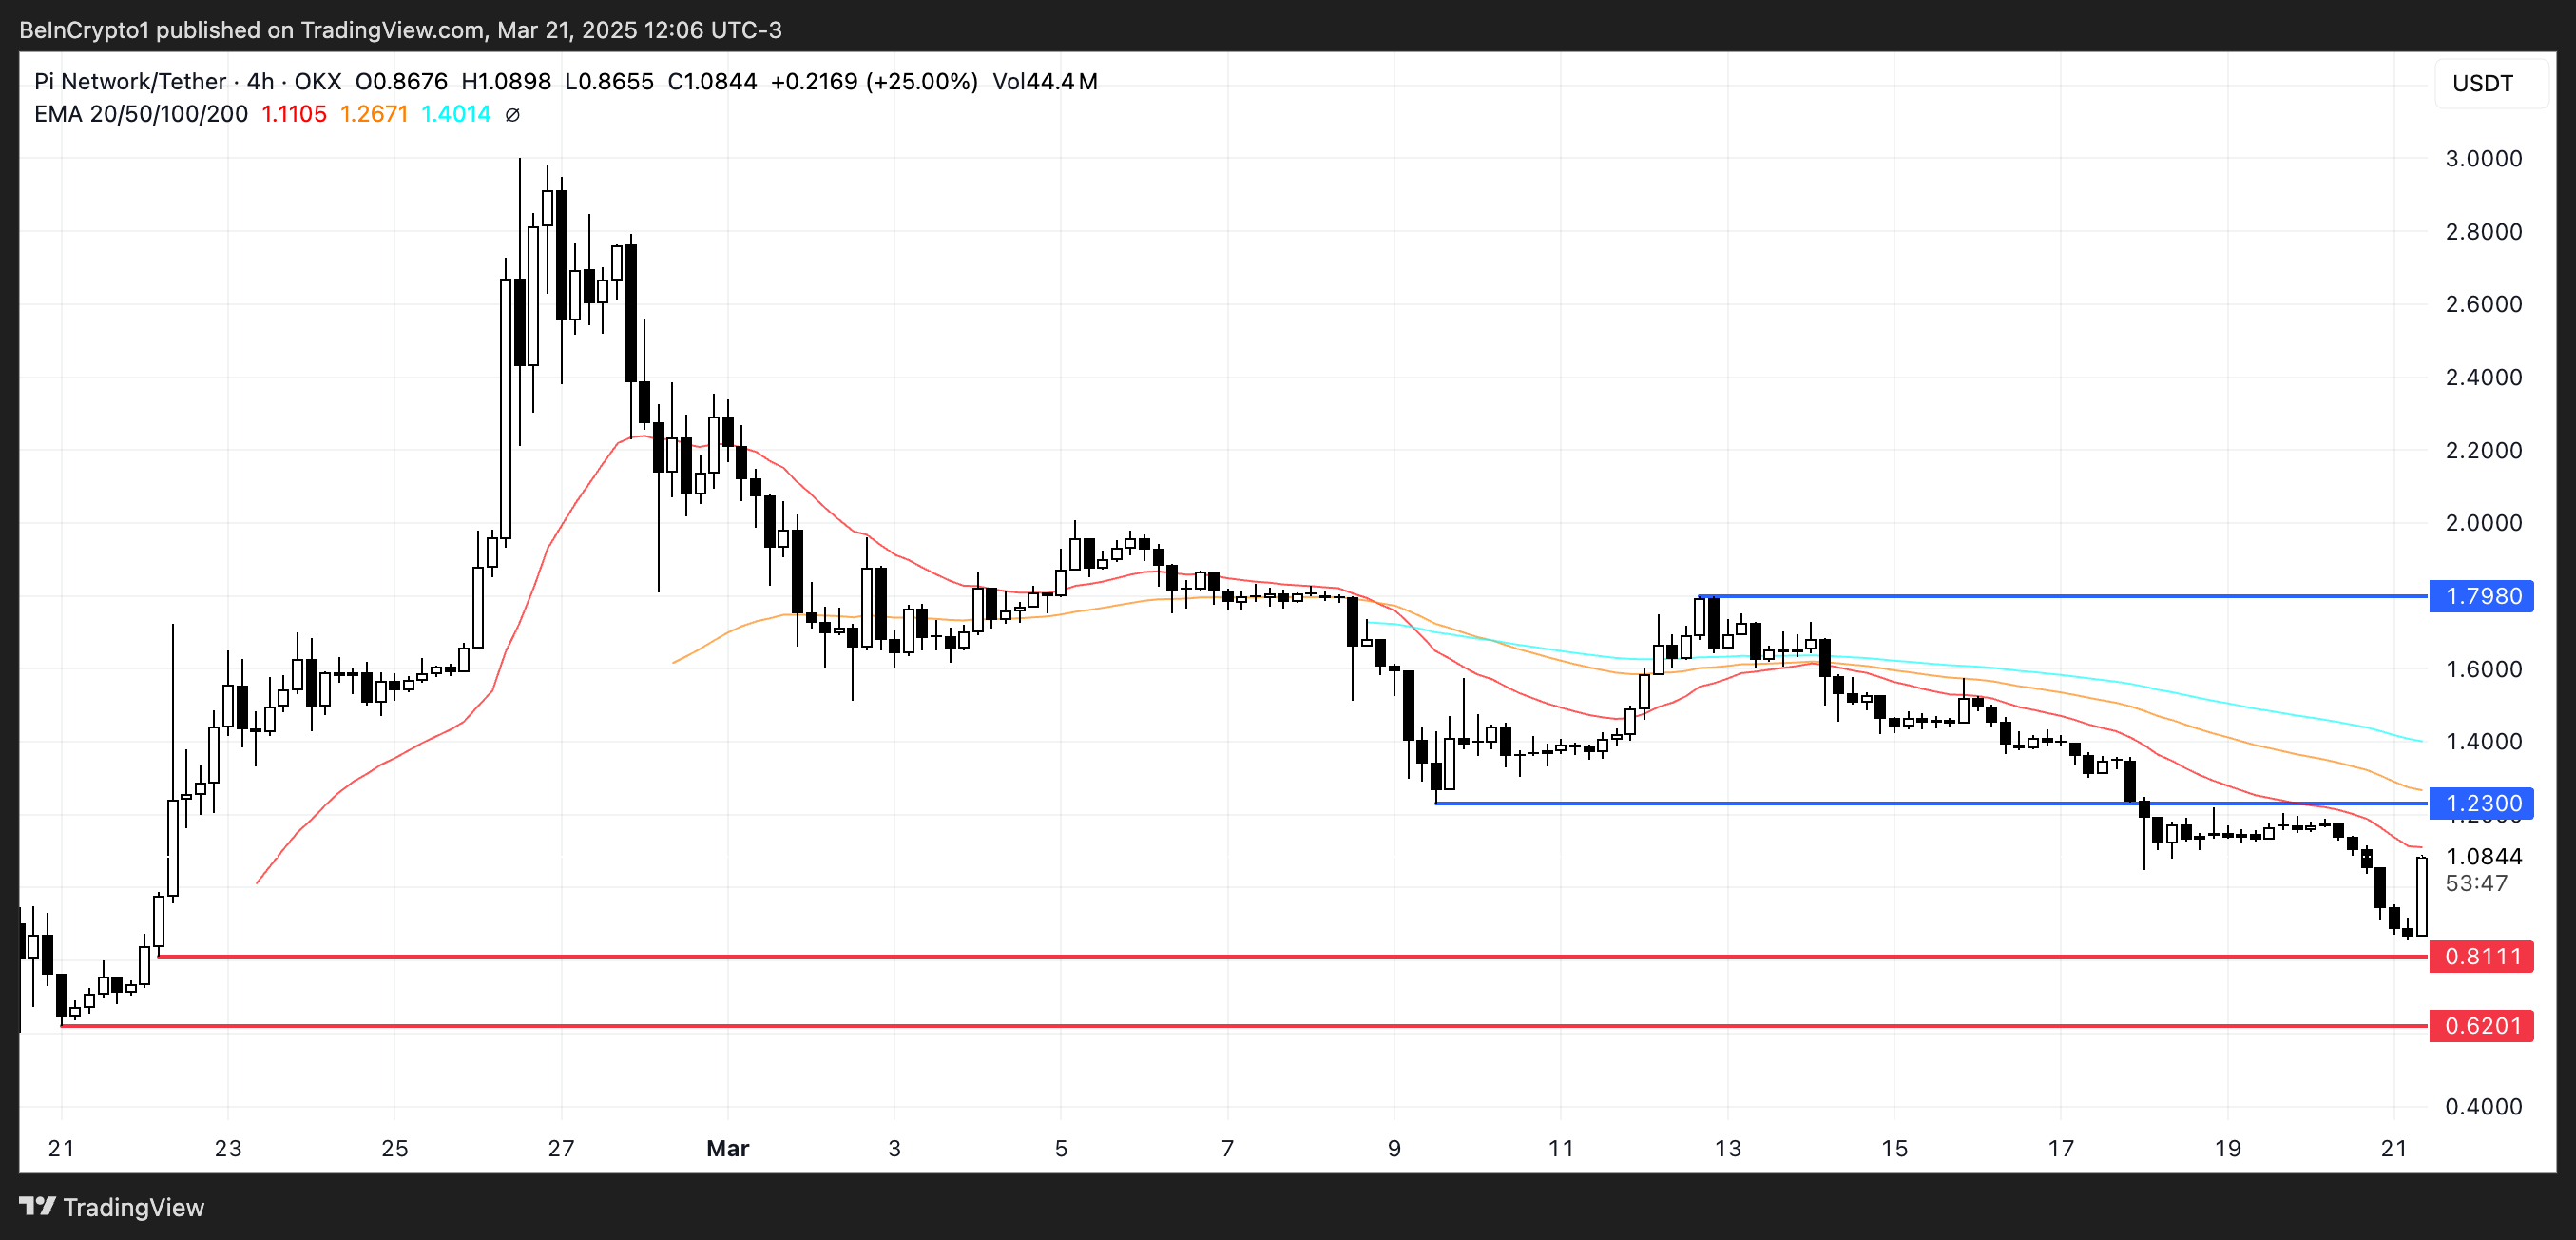
However, if Pi Network manages to regain strength despite the criticism, it could push toward resistance at $1.23.
A strong rebound could open the door for a move toward $1.79, but sentiment remains fragile following Bons’ claims and the recent price breakdown.
Disclaimer
In line with the Trust Project guidelines, this price analysis article is for informational purposes only and should not be considered financial or investment advice. BeInCrypto is committed to accurate, unbiased reporting, but market conditions are subject to change without notice. Always conduct your own research and consult with a professional before making any financial decisions. Please note that our Terms and Conditions, Privacy Policy, and Disclaimers have been updated.


Dogecoin started a fresh decline below the $0.1720 zone against the US Dollar. DOGE tested $0.1650 and is now attempting to recover toward $0.180.
- DOGE price started a fresh decline below the $0.1750 and $0.1720 levels.
- The price is trading above the $0.170 level and the 100-hourly simple moving average.
- There is a connecting bullish trend line forming with support at $0.1680 on the hourly chart of the DOGE/USD pair (data source from Kraken).
- The price could gain bullish momentum if it clears the $0.1750 and $0.1800 resistance levels.
Dogecoin Price Eyes Recovery
Dogecoin price started a fresh decline below the $0.1750 zone, like Bitcoin and Ethereum. DOGE dipped below the $0.1720 and $0.1700 support levels. It even spiked below $0.1650.
A low was formed at $0.1646 and the price is now attempting a strong comeback. There was a move above the $0.1680 level. The bulls pushed the price above the 50% Fib retracement level of the downward move from the $0.1791 swing high to the $0.1646 low.
Dogecoin price is now trading above the $0.1680 level and the 100-hourly simple moving average. There is also a connecting bullish trend line forming with support at $0.1680 on the hourly chart of the DOGE/USD pair.
Immediate resistance on the upside is near the $0.1755 level or the 76.4% Fib retracement level of the downward move from the $0.1791 swing high to the $0.1646 low. The first major resistance for the bulls could be near the $0.1780 level.

The next major resistance is near the $0.1800 level. A close above the $0.1800 resistance might send the price toward the $0.1850 resistance. Any more gains might send the price toward the $0.2000 level. The next major stop for the bulls might be $0.2050.
More Losses In DOGE?
If DOGE’s price fails to climb above the $0.1755 level, it could start another decline. Initial support on the downside is near the $0.1720 level. The next major support is near the $0.1680 level.
The main support sits at $0.1650. If there is a downside break below the $0.1650 support, the price could decline further. In the stated case, the price might decline toward the $0.1620 level or even $0.1550 in the near term.
Technical Indicators
Hourly MACD – The MACD for DOGE/USD is now losing momentum in the bearish zone.
Hourly RSI (Relative Strength Index) – The RSI for DOGE/USD is now above the 50 level.
Major Support Levels – $0.1680 and $0.1650.
Major Resistance Levels – $0.1755 and $0.1800.

Ethereum (ETH), the world’s second-largest blockchain by market capitalization, has seen its quarterly transaction fee revenue drop dramatically by approximately 95% from its all-time high in Q4 2021.
This decline can be primarily attributed to a decrease in Layer 2 contributions, coupled with a significant dip in activity within the non-fungible token (NFT) market.
What’s Driving the Drop in Ethereum’s Transaction Fee Revenue?
Token Terminal highlighted this shift in the latest X (formerly Twitter) post. Based on their estimate, Ethereum’s transaction fee revenue for Q1 2025 is projected to reach approximately $217 million.
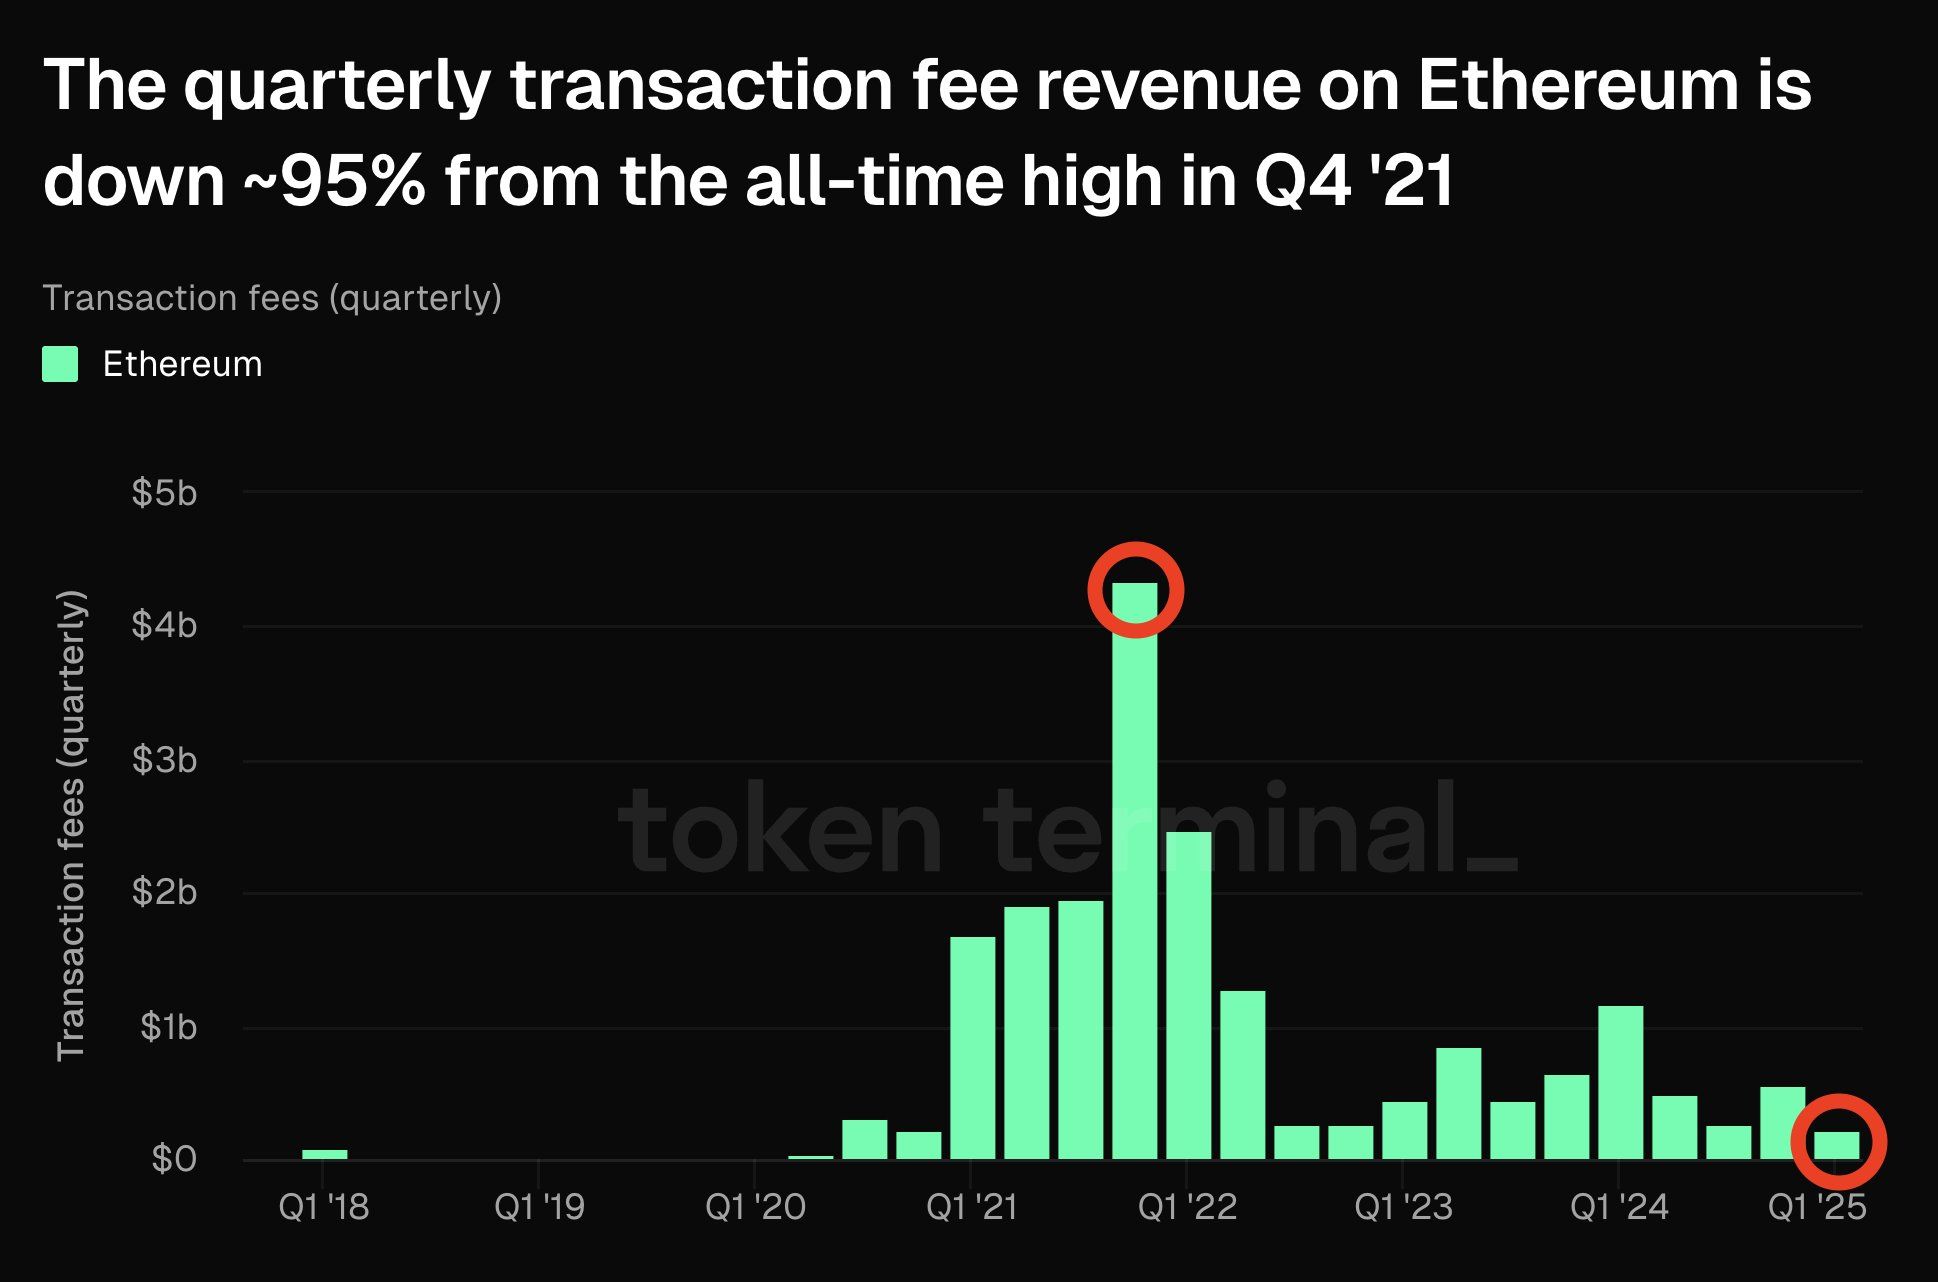
This figure represents a dramatic 95% reduction from the all-time high of $4.3 billion recorded in Q4 2021. At that time, Ethereum’s revenue surged by 1,777% year-over-year, according to Bankless. It climbed from $231.4 million in Q4 2020 to $4.3 billion by the last quarter of 2021.
Moreover, Ethereum’s DeFi ecosystem saw significant growth in Total Value Locked (TVL), decentralized exchange (DEX) volumes, NFT sales, and Layer 2 TVL. However, the dynamics have changed since then.
This is evident from Ethereum’s recent performance. In 2025, monthly revenues sharply declined, with January recording $150.8 million and February only $47.5 million. Assuming the trend of declining transaction fees continues, March could also see similarly low figures.
Furthermore, in the fourth quarter of 2024, Ethereum generated only $551.8 million in transaction fee revenue, emphasizing the continued downward trend.
One of the major contributors to the decline is the shift to Layer 2 solutions. These have become increasingly popular for their ability to process transactions off-chain while settling on Ethereum’s mainnet.
In addition, the activation of EIP-4844 has significantly reduced the data cost of posting to Ethereum’s chain, further lowering L2 fee contributions. According to a CoinShares report, this upgrade has made transactions cheaper but has also diminished the revenue Ethereum’s mainnet collects from L2 activity.
“Layer 2-related fees, which were high in 2023 and early 2024, have since declined due to cost savings introduced by EIP-4844,” the CoinShares report read.
The decline in NFT activity has also played a significant role. Q4 2021 marked the peak of the NFT craze, with platforms like OpenSea recording billions of dollars in monthly trading volume. Nonetheless, now the interest has waned, leading to a sharp drop in transaction volume and, consequently, fee revenue.
ETH Suffers its Worst Quarterly Decline Since 2018
This decline extends beyond transaction fee revenue. The price of Ethereum has followed a similar downward trend. After reaching an ATH in November 2021, ETH has dropped substantially, now trading 58.8% below that peak.
Even during the election euphoria, when many cryptocurrencies, including Bitcoin (BTC), saw new highs, Ethereum failed to keep pace.
“ETH has experienced the sharpest decline in Q1, dropping by -40%, marking its biggest quarterly loss since 2018,” an analyst wrote on X.

Over the past month alone, ETH has fallen by 25.1%. As of press time, the altcoin was trading at $1,997, representing a slight gain of 0.45% over the past day.
Disclaimer
In adherence to the Trust Project guidelines, BeInCrypto is committed to unbiased, transparent reporting. This news article aims to provide accurate, timely information. However, readers are advised to verify facts independently and consult with a professional before making any decisions based on this content. Please note that our Terms and Conditions, Privacy Policy, and Disclaimers have been updated.
Aayush Jindal, a luminary in the world of financial markets, whose expertise spans over 15 illustrious years in the realms of Forex and cryptocurrency trading. Renowned for his unparalleled proficiency in providing technical analysis, Aayush is a trusted advisor and senior market expert to investors worldwide, guiding them through the intricate landscapes of modern finance with his keen insights and astute chart analysis.
From a young age, Aayush exhibited a natural aptitude for deciphering complex systems and unraveling patterns. Fueled by an insatiable curiosity for understanding market dynamics, he embarked on a journey that would lead him to become one of the foremost authorities in the fields of Forex and crypto trading. With a meticulous eye for detail and an unwavering commitment to excellence, Aayush honed his craft over the years, mastering the art of technical analysis and chart interpretation.
As a software engineer, Aayush harnesses the power of technology to optimize trading strategies and develop innovative solutions for navigating the volatile waters of financial markets. His background in software engineering has equipped him with a unique skill set, enabling him to leverage cutting-edge tools and algorithms to gain a competitive edge in an ever-evolving landscape.
In addition to his roles in finance and technology, Aayush serves as the director of a prestigious IT company, where he spearheads initiatives aimed at driving digital innovation and transformation. Under his visionary leadership, the company has flourished, cementing its position as a leader in the tech industry and paving the way for groundbreaking advancements in software development and IT solutions.
Despite his demanding professional commitments, Aayush is a firm believer in the importance of work-life balance. An avid traveler and adventurer, he finds solace in exploring new destinations, immersing himself in different cultures, and forging lasting memories along the way. Whether he’s trekking through the Himalayas, diving in the azure waters of the Maldives, or experiencing the vibrant energy of bustling metropolises, Aayush embraces every opportunity to broaden his horizons and create unforgettable experiences.
Aayush’s journey to success is marked by a relentless pursuit of excellence and a steadfast commitment to continuous learning and growth. His academic achievements are a testament to his dedication and passion for excellence, having completed his software engineering with honors and excelling in every department.
At his core, Aayush is driven by a profound passion for analyzing markets and uncovering profitable opportunities amidst volatility. Whether he’s poring over price charts, identifying key support and resistance levels, or providing insightful analysis to his clients and followers, Aayush’s unwavering dedication to his craft sets him apart as a true industry leader and a beacon of inspiration to aspiring traders around the globe.
In a world where uncertainty reigns supreme, Aayush Jindal stands as a guiding light, illuminating the path to financial success with his unparalleled expertise, unwavering integrity, and boundless enthusiasm for the markets.

Why Is Solana Price Up 7% Today?

Dogecoin (DOGE) Plots Comeback—Is The Meme Coin Gearing Up for a Move?
Shiba Inu ETF Pitched By Executive, Will SHIB Price Rally Begin?

Ethereum Transaction Fee Revenue Drops 95% – Here’s Why

XRP Price Reclaims Ground—Is a Bigger Push Just Getting Started?

Bitcoin’s Short-Term Holders Near Capitulation With $7B Losses, Yet Remain Within Bull Market Bounds


-

 Altcoin23 hours ago
Burwick Law Demands Compensation—Here’s Why
-

 Market22 hours ago
BlackRock Dominates RWA With BUIDL’s AUM Nearing $1.5 Billion
-

 Market17 hours ago
Pi Network Outflows Hit All-Time High As PI Dips Below $1
-

 Market15 hours ago
Shiba Inu (SHIB) Might Rally Likely If Bitcoin Breaches $90,000
-

 Altcoin21 hours ago
Dogecoin Consolidation Suggests Uptrend Could Continue, But There’s A Threat
-

 Market19 hours ago
Ripple Co-Founder to Fund Space Station Project with XRP Sales
-

 Market18 hours ago
Bitcoin Whale Resurfaces After 8 Years With $250 Million Transfer
-

 Bitcoin17 hours ago
Hong Kong Firm Now Holds Nearly 19 BTC
 Arabic
 Chinese (Simplified)
 Dutch
Dutch English
 French
 German
 Italian
 Portuguese
 Russian
 Spanish
 Vietnamese