
Ethereum
Ethereum Price Forms Megaphone Bottom Not Seen Since 2020, Here’s What Happened Last Time

Reason to trust
![]()
Strict editorial policy that focuses on accuracy, relevance, and impartiality
Created by industry experts and meticulously reviewed
The highest standards in reporting and publishing
Strict editorial policy that focuses on accuracy, relevance, and impartiality
Morbi pretium leo et nisl aliquam mollis. Quisque arcu lorem, ultricies quis pellentesque nec, ullamcorper eu odio.
Crypto analyst TradingShot has revealed that the Ethereum price has formed a megaphone bottom which has not been seen since 2020. The analyst revealed what happened the last time ETH formed this bottom, which provides a bullish outlook for the altcoin.
Ethereum Price Forms Megaphone Bottom
In a TradingView post, TradingShot stated that the Ethereum price has formed a megaphone bottom like in March 2020. He noted that ETH is currently on the first week of a rebound after recording three consecutive red weeks when it could not break above the 1-week MA50. The analyst further remarked that ETH is taking on a lower lows trendline, which is technically the bottom of a 1-year megaphone since the March 11, 2024 high.
Related Reading
TradingShot claimed that the market is no stranger to long-term megaphone consolidation periods like that. He stated that the Ethereum price eventually broke upward the last time it formed this megaphone between June 2019 and March 2020, which happened after the brutal COVID crash bearish leg that touched bottom.
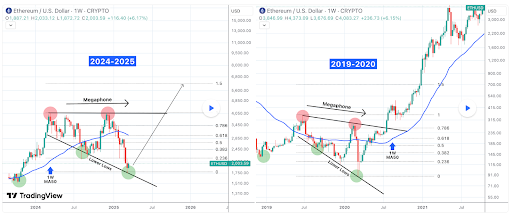
He noted that the March 2020 period is quite similar to the current bearish Ethereum price action since late December. The analyst then highlighted how perfectly aligned the Fibonacci retracement levels are. Based on this development, he predicted that the Ethereum price could at least test the 1.5 Fibonacci extension at $6,000 before this cycle tops at the end of the year.
Crypto analyst Crypto Patel also raised the possibility of the Ethereum price rallying to as high as $8,000. He suggested that this parabolic move could happen in phase E of ETH’s bull run. He indicated that ETH could face significant resistance at around $4,050 to this price level.
Bullish Fundamentals For ETH
Despite its underperformance, the Ethereum price has bullish fundamentals, which could spark a reversal to the upside and cause it to reach new highs. Crypto analyst Alternative Bull revealed that the exchange reserves of ETH are significantly declining. He remarked that this would lead to a limited supply which makes it only a matter of time before ETH goes parabolic. In line with this, the analyst affirmed that the altcoin is still in the early phases of its bull run.
Related Reading
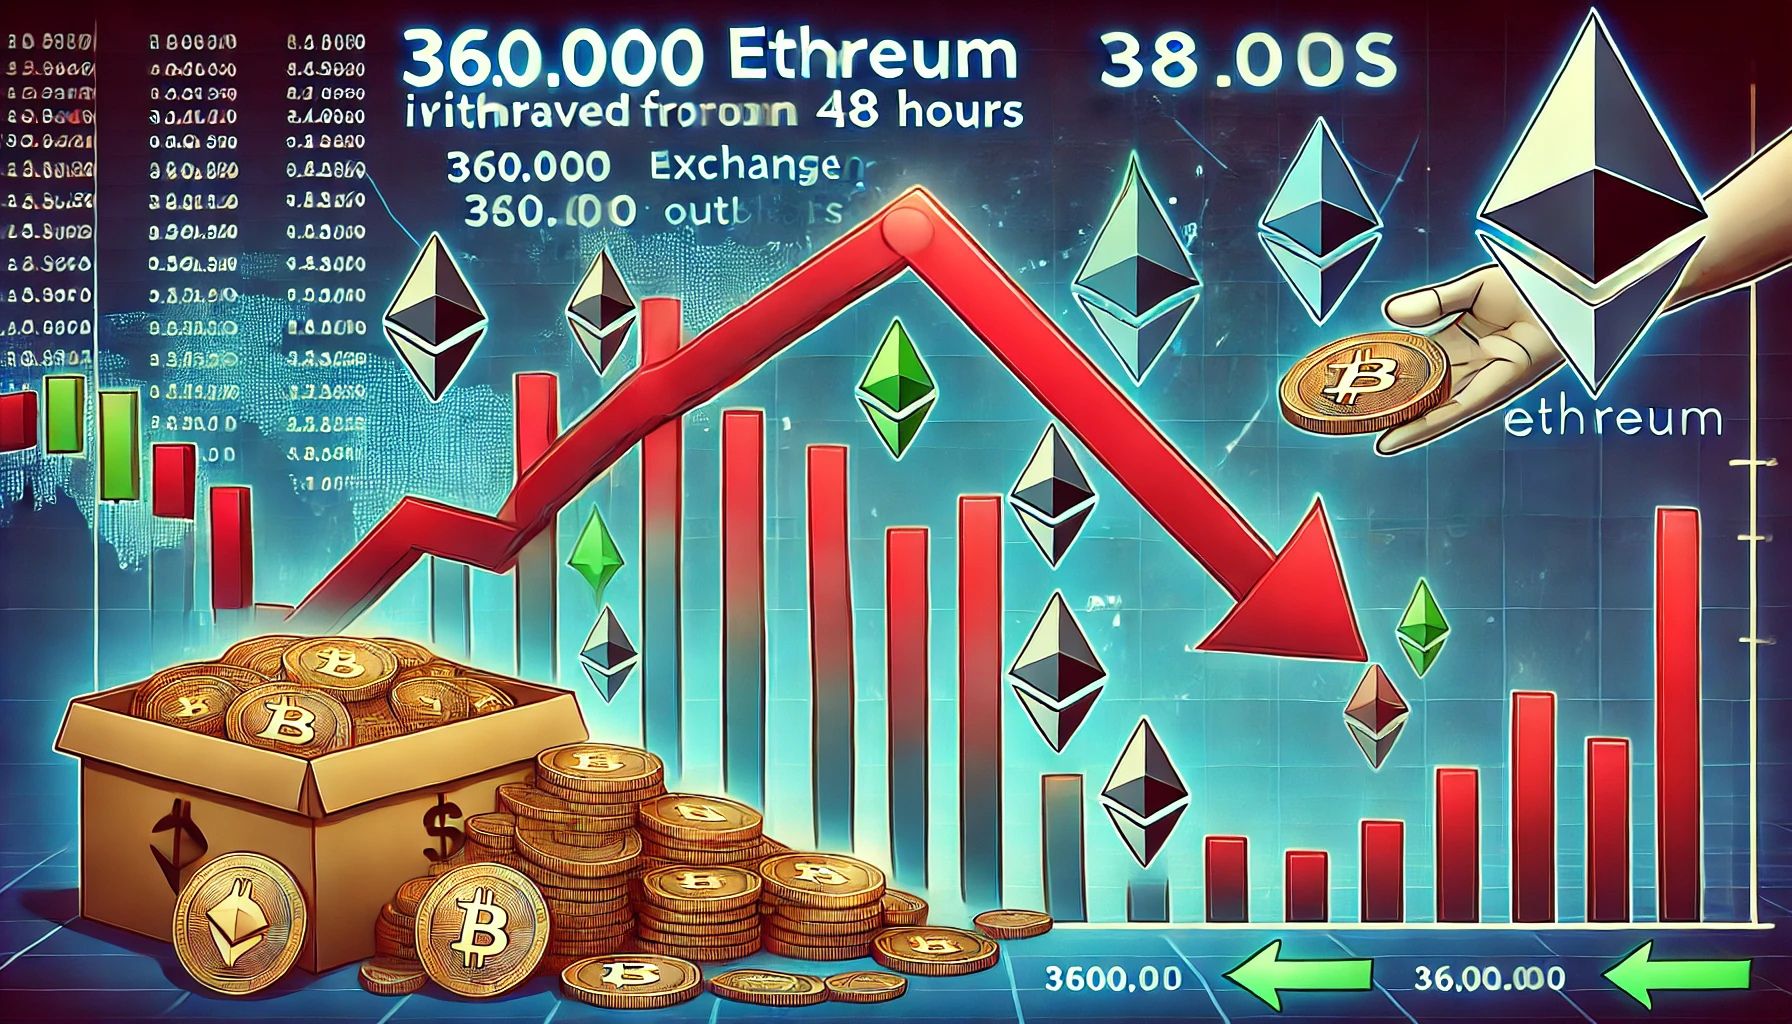
Crypto analyst Ali Martinez has also revealed that whales are actively accumulating ETH, which is bullish for the Ethereum price. In an X post, he stated that 360,000 ETH were withdrawn from crypto exchanges in the last 48 hours, a development that could spark a supply shock.
It is also worth mentioning that the Ethereum price could soon witness a supply shock through the ETH ETFs. Asset managers like Bitwise have filed with the US SEC to include staking in their funds. If approved, this could take more ETH out of circulation as some institutional investors opt to stake their ETH to receive yields.
At the time of writing, the Ethereum price is trading at around $1,969, down almost 2% in the last 24 hours, according to data from CoinMarketCap.
Featured image from Unsplash, chart from Tradingview.com


On-chain data shows the Ethereum Supply on Exchanges has seen a sharp decline recently, something that could be bullish for ETH’s price.
A Large Amount Of Ethereum Has Left Exchanges Recently
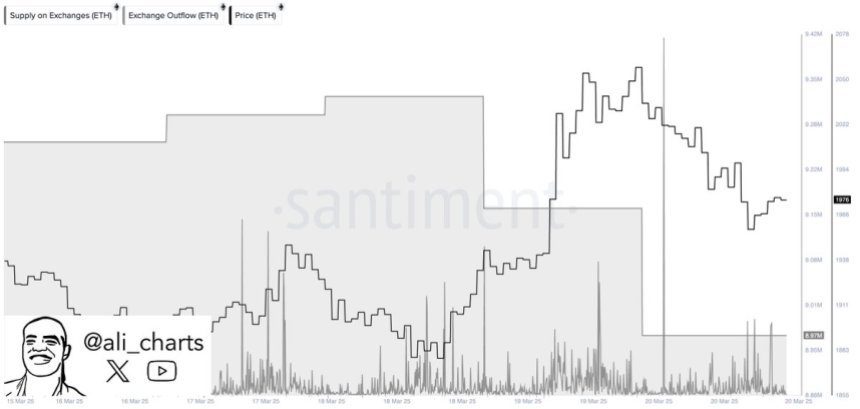
According to data from the on-chain analytics firm Santiment, the ETH Supply on Exchanges has fallen to its lowest point in almost 10 years. The “Supply on Exchanges” refers to an indicator that measures the total amount of Ethereum that’s currently sitting in the wallets of all centralized exchanges.
When the value of this metric observes an increase, it means the investors are depositing a net number of tokens of the asset into these platforms. One of the main reasons why traders transfer to exchanges is for selling-related purposes, and this kind of trend can have a bearish impact on the ETH price.
On the other hand, the indicator going down suggests a net amount of the asset’s supply is leaving the exchanges. Such a trend may be a sign that the investors are accumulating, which can naturally prove to be bullish for the coin.
Now, here is the chart shared by the analytics firm that shows the trend in the Ethereum Supply on Exchanges over the past year:

Looks like the value of the metric has witnessed a plunge in recent days | Source: Santiment on X
As displayed in the above graph, the Ethereum Supply on Exchanges has seen a massive drawdown recently, implying the investors have made a large amount of net withdrawals.
Compared to seven weeks ago, there is now 16.4% less ETH on exchanges. This sharp change has taken the indicator’s value to the lowest level since 2015, nearly a decade ago.
From the chart, it’s apparent that the timing of this latest withdrawal spree has coincided with a plunge in the cryptocurrency’s price. The same graph also shows the data related to the Bitcoin Supply on Exchanges and it would seem that, even though the number one digital asset has seen a decline of its own, the metric has still only continued to move sideways.
It’s possible that this is a sign the whales are making a stronger push to buy the dip for Ethereum, as compared to Bitcoin. However, the more likely explanation may lie in the rich ecosystem of DeFi and staking services that ETH hosts, which may be where this supply is heading off to in this period of market cooldown.
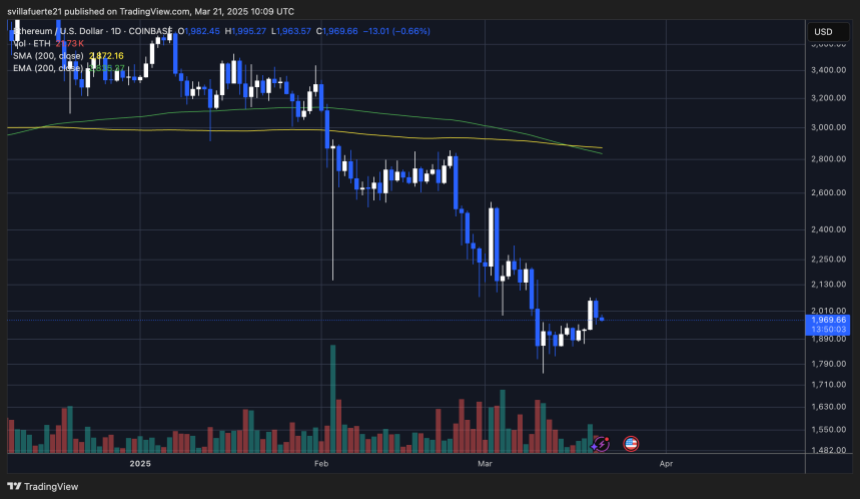
While Ethereum appears positive from an on-chain perspective, the same isn’t true for technical analysis. As analyst Ali Martinez has explained in an X post, the zoomed-out ETH chart may contain a grim picture for the asset.

The TA pattern that ETH has been trading inside for the last couple of years | Source: @ali_charts on X
As is visible in the chart, Ethereum has seemingly been consolidating inside a parallel channel for a while now. Recently, the asset has been on the way down and as the analyst has marked in the chart, a move to the lower level of the channel may be brewing for the coin.
ETH Price
At the time of writing, Ethereum is trading at around $1,960, down more than 3% over the last seven days.
The price of the coin seems to have been moving sideways recently | Source: ETHUSDT on TradingView
Featured image from Dall-E, Santiment.net, charts from TradingView.com
Editorial Process for bitcoinist is centered on delivering thoroughly researched, accurate, and unbiased content. We uphold strict sourcing standards, and each page undergoes diligent review by our team of top technology experts and seasoned editors. This process ensures the integrity, relevance, and value of our content for our readers.
Reason to trust
![]()
Strict editorial policy that focuses on accuracy, relevance, and impartiality
Created by industry experts and meticulously reviewed
The highest standards in reporting and publishing
Strict editorial policy that focuses on accuracy, relevance, and impartiality
Morbi pretium leo et nisl aliquam mollis. Quisque arcu lorem, ultricies quis pellentesque nec, ullamcorper eu odio.
Ethereum has experienced a much-needed surge above the $2,000 level, a key psychological and technical mark that bulls have struggled to reclaim since March 10. This breakout sparked optimism in the market, but the momentum was short-lived, as ETH quickly pulled back below the level and was unable to confirm a solid hold. Analysts widely agree that a strong and sustained move above $2,000 is critical for Ethereum to initiate a broader recovery rally.
Related Reading
Despite the hesitation at resistance, on-chain data shows signs of growing investor confidence. According to Santiment, investors have withdrawn over 360,000 ETH from centralized exchanges in the last 48 hours. This shift is often interpreted as a bullish signal, suggesting that large holders are moving their assets to private wallets, possibly in anticipation of higher prices.
Meanwhile, the broader macroeconomic landscape continues to apply pressure. Trade war tensions and unpredictable policy decisions from the U.S. government have weighed heavily on both crypto and traditional markets, intensifying volatility and investor uncertainty. Still, Ethereum’s latest exchange outflows hint at a potential trend shift — one that could favor accumulation and set the stage for the next major move, provided bulls can reclaim and hold above the $2K threshold.
Ethereum Faces Critical Test Amid Exchange Outflows
Ethereum has lost over 57% of its value since mid-December, falling from a high of around $4,100 to recent lows near $1,750. This sharp correction has created a challenging environment for bulls, who have repeatedly failed to reclaim and hold higher price levels.
Now, the $2,000 mark stands as a psychological and technical battlefield. If Ethereum can firmly establish support above this level, it could provide the foundation for a recovery rally. However, a failure to do so would likely result in further downside and reinforce the bearish trend.
Related Reading
The current market landscape struggles with uncertainty. On one side, continued macroeconomic headwinds—rising trade tensions, inflation concerns, and policy shifts from the U.S. government—have weakened investor confidence and driven volatility across risk assets. On the other hand, there are signs of potential recovery and accumulation.
Top crypto analyst Ali Martinez shared data from Santiment, revealing that investors have withdrawn over 360,000 ETH from centralized exchanges in the past 48 hours. Historically, large-scale withdrawals are considered a bullish signal, as they suggest investors are moving assets into cold storage for long-term holding rather than preparing to sell.
This move could indicate growing confidence among large holders and signal the early stages of a new accumulation phase—provided Ethereum can hold above $2,000.
Price Holds Steady Below $2,000
Ethereum is currently trading at $1,960 after briefly attempting to reclaim the $2,000 mark in yesterday’s session. The psychological and technical resistance at $2,000 remains a crucial barrier that bulls must overcome to shift market momentum in their favor. Despite a small bounce from recent lows, Ethereum has struggled to gain traction amid persistent market uncertainty.
Bulls need to push ETH above $2,000 and reclaim higher levels such as $2,150 and $2,300 to confirm the beginning of a recovery phase. A sustained move above these levels would not only signal a potential trend reversal but could also attract sidelined investors back into the market. Until that happens, Ethereum remains vulnerable to continued downside pressure.
Related Reading
If bulls fail to break above the $2,000 resistance in the coming sessions, Ethereum could lose support at current levels and revisit lower demand zones around $1,850 or even $1,750. With the broader crypto market still under the influence of macroeconomic volatility and weak sentiment, the coming days are likely to be pivotal for ETH’s short-term direction. A decisive move either above or below this key range will likely set the tone for the next major price action.
Featured image from Dall-E, chart from TradingView

After Ethereum (ETH) surged past the psychologically significant $2,000 price level yesterday, its next major price hurdle stands at $2,400. Seasoned crypto analyst Ali Martinez emphasized that ETH must clear this level to regain bullish momentum.
Ethereum Needs To Clear $2,400 To Turn Bullish
Ethereum has climbed nearly 4.5% over the past week, rising from approximately $1,800 on March 13 to $1,992 at the time of writing. However, Martinez points out that despite the recent upward movement, ETH must conquer the $2,400 level to confirm a bullish shift.

While $2,400 remains about 20% away from current price levels, multiple crypto analysts believe ETH could be on the verge of a bullish trend reversal. Crypto analyst Merlijn The Trader highlighted that ETH has broken out of a symmetrical triangle pattern on the 4-hour chart.
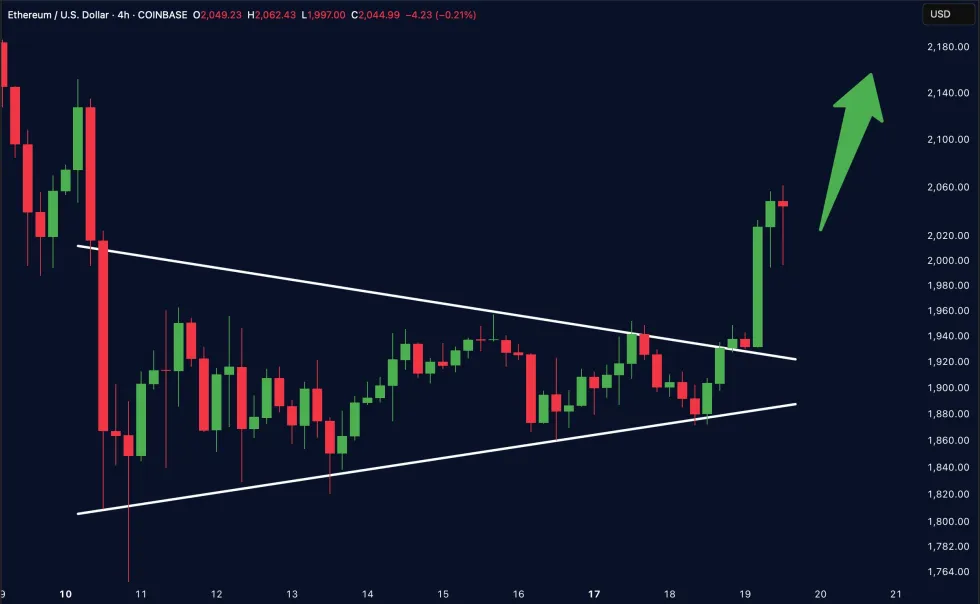
The analyst added that ETH’s “most hated rally is about to ignite.” Merlijn’s assessment aligns with fellow analyst Ted, who noted that a short squeeze could rapidly propel ETH to $3,000.
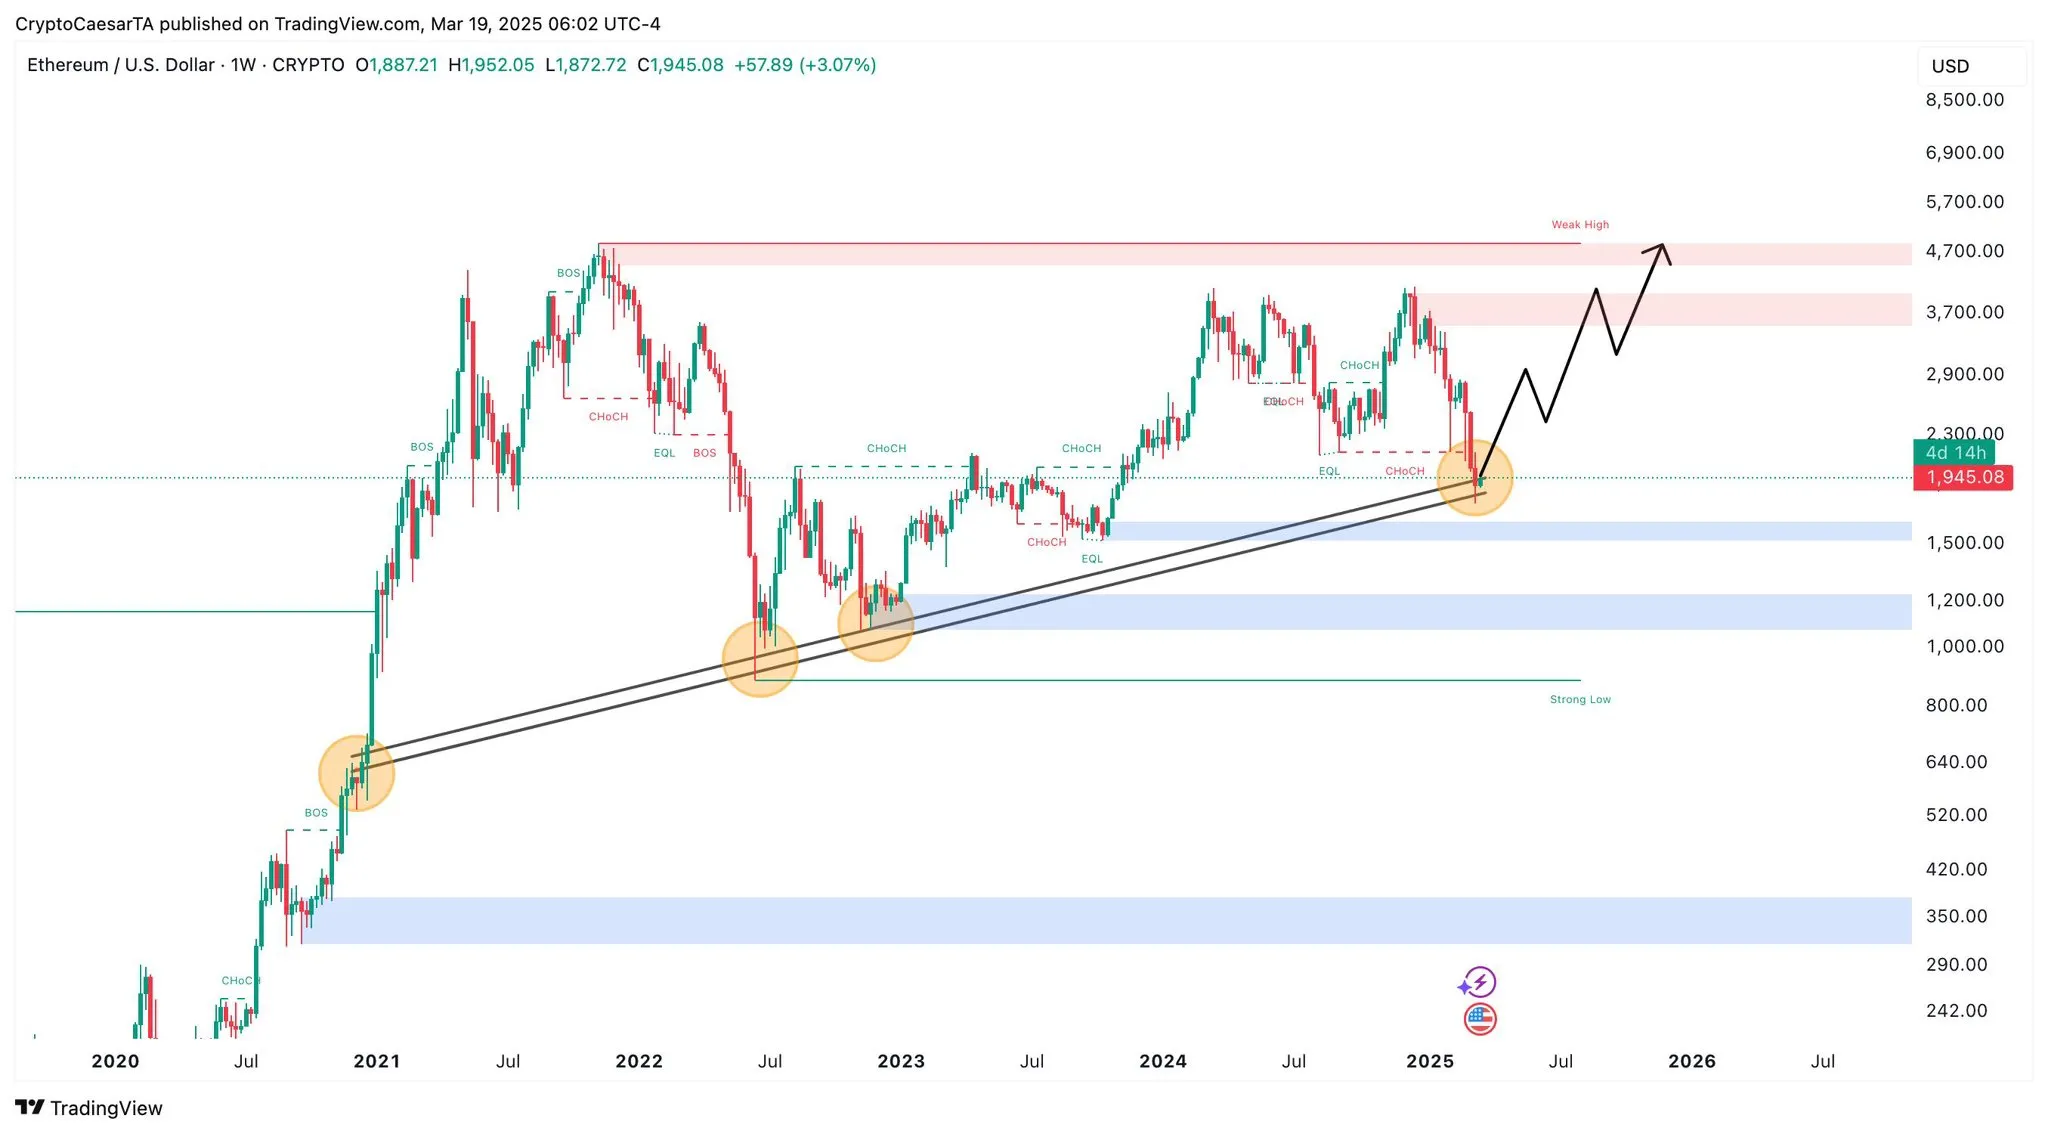
Similarly, in an X post, crypto analyst Crypto Caesar suggested that ETH may be near this market cycle’s bottom and could soon experience a strong upward trend reversal. The analyst shared a chart showing ETH bouncing off a long-standing trendline multiple times since mid-2022.
Further supporting the bullish case, analyst Amr Taha explained in a CryptoQuant Quicktake post that over 150,000 ETH have exited derivatives exchanges in the past two days. Taha noted that such large outflows often signal accumulation by institutional investors – a traditionally bullish indicator.

ETH Threatens Slumping To $1,060
Despite the optimistic signals, some analysts warn that ETH may face more downside before any significant upside move. In an X post, crypto trader Mags suggested ETH could crash to a range low of $1,060 if no meaningful support level holds.
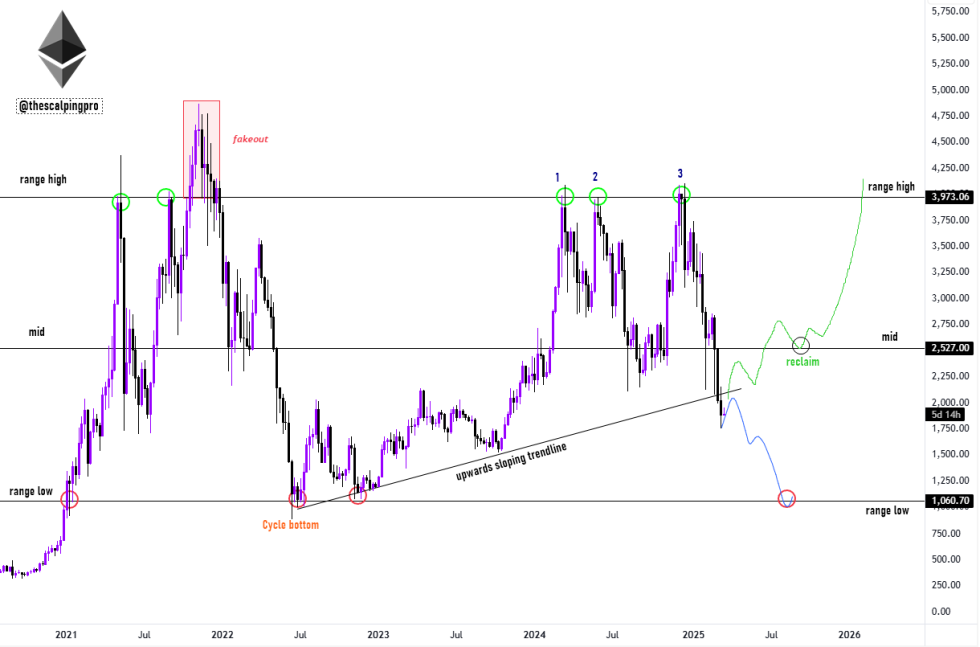
Additionally, other analysts caution that ETH could fall as low as $800 if it breaks down from an ascending triangle pattern. Data from crypto exchange-traded funds (ETF) tracker SoSoValue also indicates waning institutional confidence in ETH.
Notably, US-based spot ETH ETFs have seen continuous net outflows since March 5. As of now, total net assets held in spot ETH ETFs stand slightly above $7 billion, representing approximately 2.8% of ETH’s total supply.
That said, Ethereum’s MVRV Ratio dropping to 0.9 could signal a bullish setup for the digital asset, though such effects typically take time to play out. At press time, ETH trades at $1,992, down 1.7% in the past 24 hours.

Featured Image from Unsplash.com, Charts from X, CryptoQuant and TradingView.com
Editorial Process for bitcoinist is centered on delivering thoroughly researched, accurate, and unbiased content. We uphold strict sourcing standards, and each page undergoes diligent review by our team of top technology experts and seasoned editors. This process ensures the integrity, relevance, and value of our content for our readers.

Cardano (ADA) Faces Death Cross After Price Falls 37% In March

PancakeSwap Price Rallies As Trading Volume Tops $2.5B; What’s Happening?

Bitcoin ETFs Rebound With a $744 Million Weekly Inflow
Binance Reveals the Dark Side of Crypto Airdrops

Shiba Inu Price Eyes 81% Upside With SHIB Burn Rate Rising

Is Ethena Price At Risk? Market Maker Offloads $10M ENA Raising Concerns

2.52 Million Altcoins Are Ruining Crypto’s Future

Animoca Brands Valuation Tanks 75% In Two Years, Here’s Why

Crypto exchange BingX hacked for $43 million

Are The Big Players Losing Interest?

Hong Kong’s Securities Association Tips Authorities On Crypto Self-Regulation

Coinbase cbBTC Set to go Live on Solana
2.52 Million Altcoins Are Ruining Crypto’s Future
Animoca Brands Valuation Tanks 75% In Two Years, Here’s Why
Crypto exchange BingX hacked for $43 million
Are The Big Players Losing Interest?
Hong Kong’s Securities Association Tips Authorities On Crypto Self-Regulation
Coinbase cbBTC Set to go Live on Solana
-
 Altcoin24 hours ago
Why Is Solana DEX ORCA Price Skyrocketing 170% Today?
-
 Altcoin23 hours ago
Can Shiba Inu Price Hit $0.01 As SHIB Burn Rate Rockets 500%?
-
 Market18 hours ago
German Regulators Reject Ethena’s USDe MiCA Application
-
 Altcoin18 hours ago
Analyst Predicts XRP Price Could Hit New ATH As Ripple Lawsuit Ends
-

 Market23 hours ago
HBAR Traders Bet On Recovery, But Price Continues Falling
-

 Market22 hours ago
Is Binance Favoring BNB Chain in Token Listings and Delistings?
-

 Ethereum16 hours ago
Investors Withdraw 360,000 Ethereum From Exchanges In Just 48 Hours – Accumulation Trend?
-

 Bitcoin14 hours ago
Pi Network, XRP, Trump, Binance