
Market
This is Why Coinbase is Considering Deribit Acquisition


Coinbase is reportedly in talks to acquire Deribit, but nothing is certain yet. If the deal goes through, it could turn Coinbase into a “crypto empire,” thanks to the lucrative derivatives market.
Last year, Deribit posted nearly $1.2 trillion in options, futures, and spot trading. Coinbase has comparatively little derivatives volume, and this merger could supercharge the firm.
Will Coinbase Acquire Deribit
Coinbase, one of the world’s largest crypto exchanges, has gone through a few changes recently. Since the SEC dropped its lawsuit against the company, it’s been able to expand its services. According to a new report from Bloomberg, Coinbase is currently in talks to acquire Deribit.
Deribit is the world’s largest crypto derivatives exchange, an industry sector that isn’t Coinbase’s strong suit. The firm first filed to offer these services in 2021, but Coinbase Derivatives hasn’t been a huge share of its trade volume. Granted, it sought approval for new futures contracts in January, but this is not a primary source of revenue.
However, since the crypto market has suffered from lasting doldrums, there may be an opportunity for future growth. Earlier this month, Coinbase traffic dropped 29%, and a Deribit acquisition may give it huge new revenue streams. Bloomberg claimed that Deribit’s total trade volume last year was nearly $1.2 trillion, which could be a huge asset:
“Anyone else notice how Coinbase is quietly becoming a crypto empire? They’re about to buy Deribit – one of the biggest crypto derivatives exchanges out there. They’re turning into a global powerhouse. Smart move targeting derivatives – that’s where the real volume is,” Zach Humphries claimed in a social media post.
The report had no clear stance on how likely a deal between Coinbase and Deribit might be nor how much it might cost. In January, Deribit considered an offer to get acquired by Kraken for $5 billion, but the deal fell through. If Coinbase pulled the trigger on it, it could become one of the most important business deals in crypto history.
Until we have more information, it’s difficult to make any firm statements about likely outcomes. For example, Deribit was forced out of one of its largest markets last month due to EU sanctions, but a Coinbase acquisition may not change that equation. If a deal does happen, Coinbase will have a real chance to dominate a very lucrative market.
Disclaimer
In adherence to the Trust Project guidelines, BeInCrypto is committed to unbiased, transparent reporting. This news article aims to provide accurate, timely information. However, readers are advised to verify facts independently and consult with a professional before making any decisions based on this content. Please note that our Terms and Conditions, Privacy Policy, and Disclaimers have been updated.


The meme-inspired cryptocurrency PEPE has once again captured the attention of traders as its price demonstrates remarkable resilience, holding firm above a key 100-day simple moving average (SMA) after a brief pullback. This technical strength has sparked speculation about whether PEPE is gearing up for a bullish continuation, potentially reigniting its upward momentum.
With traders closely monitoring price action, a breakout above nearby resistance could confirm a bullish continuation, setting the stage for further gains. However, failure to maintain support may shift momentum in favor of the bears as PEPE hovers at this critical juncture.
PEPE Recent Price Action: A Snapshot
PEPE has been displaying steady price movement, holding above a key support level and maintaining bullish momentum. After bouncing from recent lows, the meme coin has managed to stay above a crucial moving average. This stability suggests that buyers are still in control, preventing a deeper pullback and keeping the uptrend intact.
Technical indicators continue to support a bullish outlook for PEPE. The Relative Strength Index (RSI) remains in positive territory, reflecting sustained buying momentum. If the RSI holds its current course, it can strengthen the case for more upside, suggesting that the uptrend has room to extend.
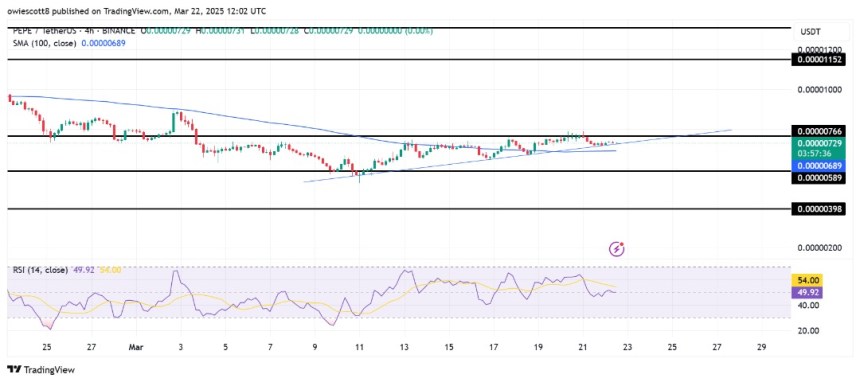
Trading volume has remained consistent, indicating sustained interest from market participants. However, resistance levels ahead will play a crucial role in determining whether PEPE can extend its rally or face a temporary slowdown. If bullish momentum strengthens, the price could push toward the $0.00000766 resistance level.
A decisive breakout above this level serves as a strong bullish confirmation, paving the way for further upside. Should buying pressure intensify, PEPE may rally toward the next significant resistance, attracting more traders looking to capitalize on the upward trend.
Bearish Scenario: Key Support Levels If Momentum Shifts
While PEPE remains in bullish territory, a shift in momentum will open the door for a potential pullback. If selling pressure increases, the first key support to watch is the moving average level that has been acting as a price floor. A break below this level could weaken bullish confidence and trigger a deeper decline.
Further downside raises the risk of a decline toward secondary support zones such as $0.00000589 and $0.00000398, where buyers may attempt to regain control. Failure of the bulls to defend these levels will open the door for other support levels to be tested. Additionally, declining volume and a bearish crossover in momentum indicators such as the MACD or RSI could further confirm a shift in sentiment.
For now, the uptrend remains intact, but traders should remain cautious of any signs of weakness. Holding above these key support zones will be crucial in determining whether bulls can maintain control or if bears will take over.
Reason to trust
![]()
Strict editorial policy that focuses on accuracy, relevance, and impartiality
Created by industry experts and meticulously reviewed
The highest standards in reporting and publishing
Strict editorial policy that focuses on accuracy, relevance, and impartiality
Morbi pretium leo et nisl aliquam mollis. Quisque arcu lorem, ultricies quis pellentesque nec, ullamcorper eu odio.
The XRP price is showing signs of a potential breakout, with a crypto analyst pointing to key technical indicators that suggest a potential surge to $4. Notably, the cryptocurrency has been trading within a descending trendline, but a decisive move above this resistance could ignite a long-awaited rally to a new all-time high.
XRP Price Eyes Breakout To $4
According to pseudonymous TradingView crypto analyst ONE1iMPACT, the XRP price has been making lower highs, forming a descending trendline on the 8-hour chart. The analyst’s chart analysis highlights key technical indicators based on price action that suggest that the XRP price may be gearing up for a possible rally to $4.
Related Reading
XRP’s projected surge to a $4 ATH is dependent on how it reacts to the descending trendline, which acts as a critical resistance area. With this in mind, a breakout and close above this trendline with higher-than-average volume signals bullish momentum for the XRP price.
Interestingly, the analyst disclosed that the market is currently hovering near or just below a key Moving Average (MA), indicated by the blue line in the chart. If XRP’s price can reclaim and hold above this MA, it would reinforce its bullish position and solidify the analyst’s optimistic price target. On the flip side, if it remains below this MA, the TradingView expert believes that it would put a barrier to its upside potential.
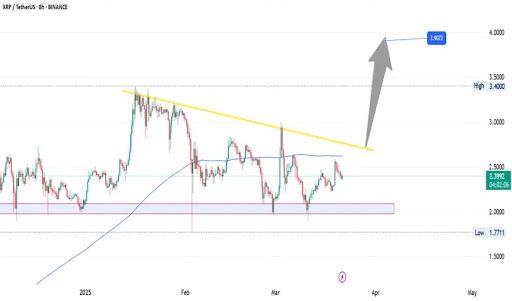
Moving forward, the analyst has shared key technical areas that could determine XRP’s next price movements. He revealed that if the cryptocurrency breaks above the descending trendline, the next major resistance area is the horizontal level around $3.40. Furthermore, a confirmed breakout could send its price toward $3.9 – $4.00, aligning with the target shown by the grey arrow in the chart.
The TradingView crypto expert warned investors and traders to pay attention to the volume and momentum of XRP as it aims for a descending trendline breakout. He explained that a low volume push above the trendline is a clear indication of a possible fakeout, where traders could be lured into entering long positions, only for the price to trace quickly. On the other hand, a high volume surge confirms the conviction of XRP’s bullish potential, leading to a sustained upward momentum and increasing prices.
The analyst also added that oscillators like the Relative Strength Index (RSI) and Moving Average Convergence Divergence (MACD) could help traders gauge whether XRP’s momentum is building or fading as its price approaches the descending trendline resistance.
Possible Downside Target If Resistance Fails
In his analysis, ‘ONE1iMPACT’ also shared a bearish outlook for the XRP price if it fails to break and close above the descending trendline resistance. The TradingView analyst revealed that a rejection at this trendline could trigger further consolidation and decline for XRP.
Related Reading
He has shared several important support levels that could help prevent an even deeper correction in the XRP price. The $2.0 and $2.1 region, marked by the pink and gray box on the chart, acts as a strong support area for XRP, where buyers have stepped in before.
If the XRP price loses this zone, the analyst predicts a major breakdown toward $1.8 – $1.77. Another decline below this price low could result in a much larger correction.
Featured image from Adobe Stock, chart from Tradingview.com
XRP emerged as a major headliner in the past week as the US Securities and Exchange Commission (SEC) officially dropped its four-year case with Ripple. Notably, this development resulted in a significant demand for XRP as the altcoin surged over 13% to briefly trade at $2.60 on March 20. However, XRP has since retraced over the last 24 hours and is now valued at around $2.39. Albeit, the altcoin still remains set for major bullish gains based on recent analysis by market expert Egrag Crypto.
XRP Strong Monthly Close Indicates Major Upside Potential
In an X post on March 21, Egrag Crypto shares an interesting bullish prediction on the XRP based on price action in recent months and the Fibonacci retracement levels.
The analyst notes that XRP has consistently closed above Fib. 1.0 level over the past three months forming full body candles. This development demonstrates XRP’s resilience amidst an uncertain crypto market reinforcing the potential of bullish momentum. This is because full-body candles provide stronger confirmation of price movements compared to wick formations.
With the altcoin maintaining such strong technical strength, Egrag predicts XRP could soon start gaining with its first price target at Fib 1.236. However, there is no serious resistance at this level suggesting a continuous surge to Fib Circle 5 and Fib 1.414 i.e. a price range of $5-$6.

Based on the Fibonacci levels, XRP could then see major price extensions to Fib 1.618 hinting at a potential price target of $9-$10. However, it is worth noting that the timing of these events is quite consequential for XRP and the general crypto market.
According to Egrag Crypto, if the projected price gains occur between now and May, a price correction is likely to follow hinting at a continuation of the bull run and higher price targets for XRP. However, if the anticipated price movements happen in the summer of 2025 or in Q4 2025, it could suggest a market top, marking the end of the current market cycle.
XRP Market Overview
According to Coincodex, market sentiment is currently neutral as the crypto market struggles to establish a clear trajectory. However, there are some significant potential positives for the fourth-largest cryptocurrency on the horizon.
Aside from recent legal developments, Ripple CEO Brad Garlinghouse has expressed much optimism on an XRP Spot ETF suggesting a possible approval before 2025 runs out. In addition, Garlinghouse expects US President Donald Trump to include XRP in the digital asset stockpile.
At the time of writing, XRP trades at $2.38 reflecting a 1.43% price loss in the past day. Meanwhile, the asset’s daily trading volume is down by 31.64% indicating a decline in market interest despite a recent price surge.

Dogecoin Open Interest Dumps To November 2024 Levels, Will Price Follow?

PEPE Bulls Regain Control As Price Stays Above Moving Average

Trump Administration Push for Blockchain-Powered USAID Overhaul—Here’s What Could Change
US FOMC, XRP Lawsuit, & Pi Network In Spotlight

XRP Flashes Descending Trendline, Why A Surge To $4 Is Still In The Cards

Shiba Inu Burns Slow To A Crawl With Only 2 Transactions In 24 Hours, What’s Happening?

2.52 Million Altcoins Are Ruining Crypto’s Future

Animoca Brands Valuation Tanks 75% In Two Years, Here’s Why

Crypto exchange BingX hacked for $43 million

Are The Big Players Losing Interest?

Hong Kong’s Securities Association Tips Authorities On Crypto Self-Regulation

Coinbase cbBTC Set to go Live on Solana
2.52 Million Altcoins Are Ruining Crypto’s Future
Animoca Brands Valuation Tanks 75% In Two Years, Here’s Why
Crypto exchange BingX hacked for $43 million
Are The Big Players Losing Interest?
Hong Kong’s Securities Association Tips Authorities On Crypto Self-Regulation
Coinbase cbBTC Set to go Live on Solana
-

 Bitcoin22 hours ago
Bitcoin ETFs Rebound With a $744 Million Weekly Inflow
-

 Bitcoin20 hours ago
Bitcoin Rally Incoming? M2 Money Supply Rebound Signals Big Moves Ahead
-
 Market23 hours ago
Binance Reveals the Dark Side of Crypto Airdrops
-
 Altcoin16 hours ago
What Could XRP Price Be In Trump’s Second term
-
 Altcoin22 hours ago
PancakeSwap Price Rallies As Trading Volume Tops $2.5B; What’s Happening?
-

 Market21 hours ago
Cardano (ADA) Faces Death Cross After Price Falls 37% In March
-

 Ethereum17 hours ago
Ethereum Price Nears Major Resistance At $2,200, Why A 13% Crash Could Follow
-
 Market17 hours ago
PancakeSwap Whales Buy 25 Million CAKE After 50% Price Rally