
Market
SPX Rallies, While TOSHI, PNUT Simmer

The crypto market had a rather stable week, with the leader, Bitcoin, safe from witnessing any sharp rise or fall. This extended to the meme coins as well, with the lack of volatility resulting in altcoins taking a direction.
BeInCrypto has analyzed three meme coins that took different directions as the market conditions improved.
Toshi (TOSHI)
TOSHI saw a 22% decline this week, but it managed to hold above the critical support level of $0.000331. This resistance has helped prevent further downside, though the ongoing bearish trend has put the meme coin under pressure.
If the bearish momentum continues, TOSHI risks falling below the $0.000331 support, potentially hitting $0.000194. A drop to this level would result in significant losses for investors and may signal deeper bearish sentiment in the market.
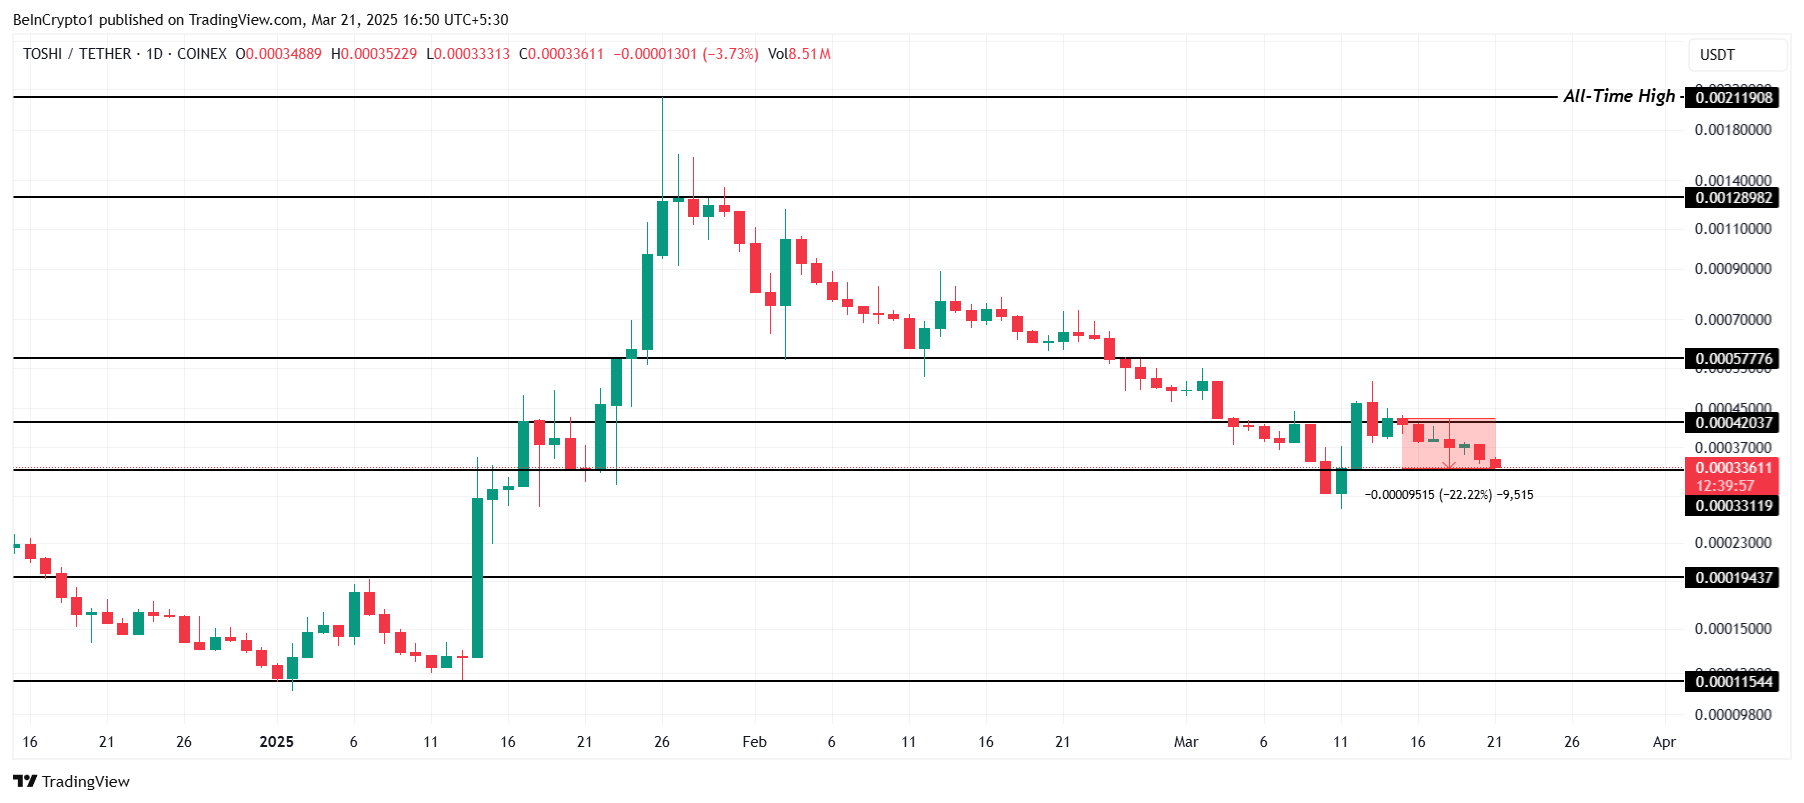
Should TOSHI manage to bounce off the $0.000331 support, a recovery toward $0.000420 is likely. A breach above $0.000420 could propel TOSHI towards $0.000577, indicating a potential rally. This positive price action would mark a shift in sentiment.
Peanut The Squirrel (PNUT)
PNUT has experienced minimal price movement, slipping by 4% over the last seven days to trade at $0.163. Unlike many altcoins, it neither saw a significant surge nor a sharp decline. The price action has remained relatively stable, reflecting the market’s cautious sentiment toward the meme coin.
There is a chance that PNUT could face further declines, potentially testing the support level at $0.152. If the price fails to hold this level, it could fall to $0.137. This would signal increased bearish pressure, making it difficult for PNUT to recover unless market conditions improve substantially.
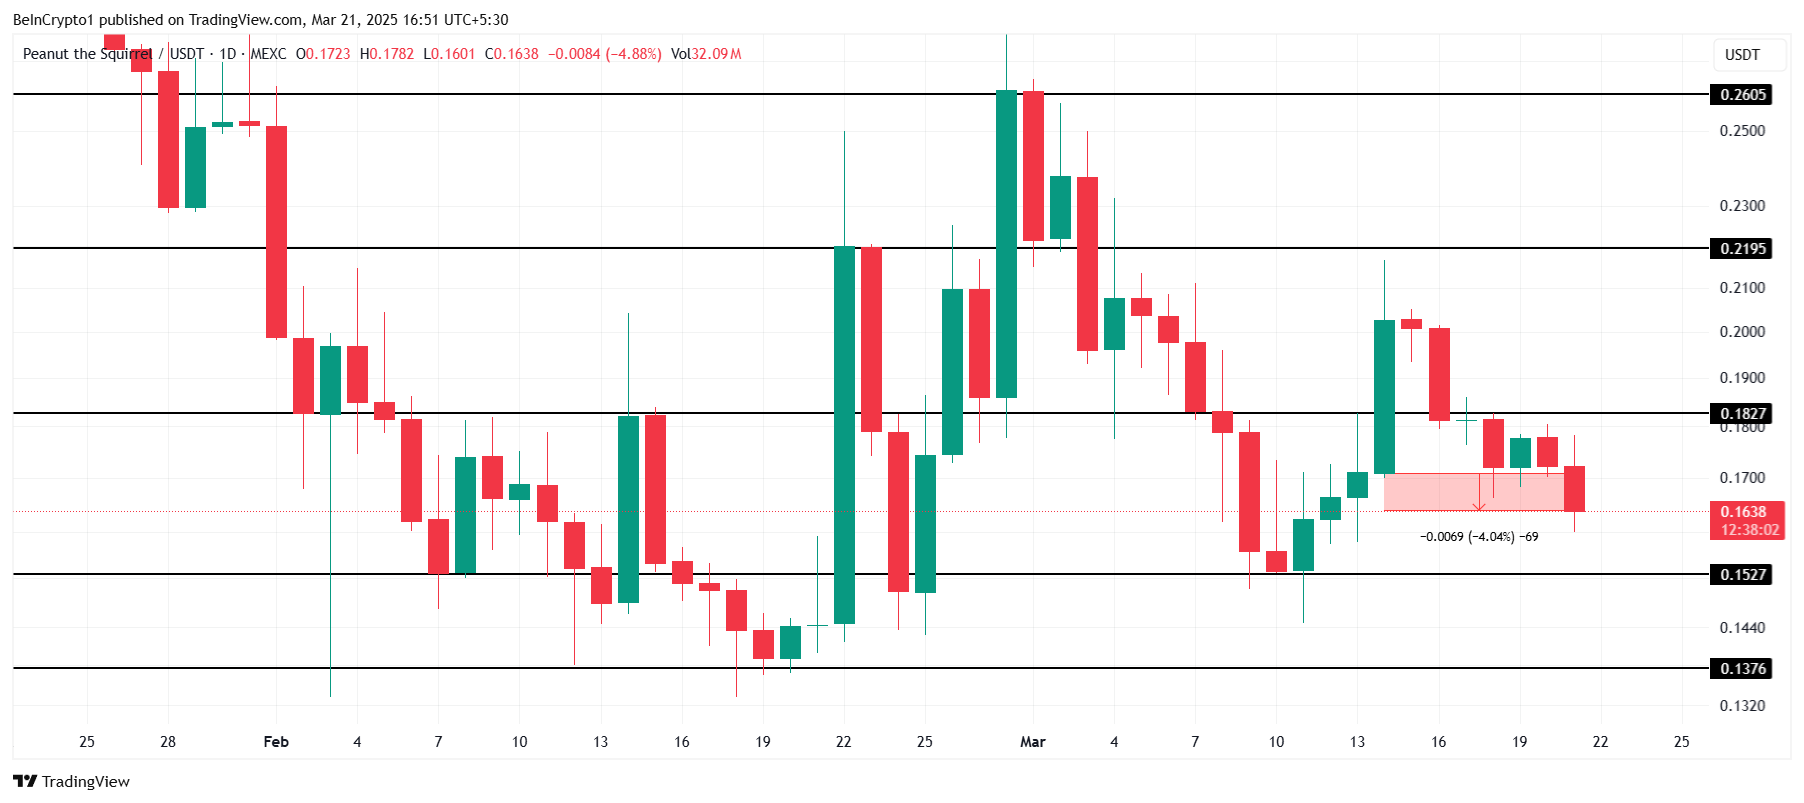
However, if PNUT capitalizes on a recovery and benefits from an improving market sentiment, it could rise to $0.182. A successful breach of this resistance would invalidate the current bearish outlook.
SPX6900 (SPX)
SPX has performed exceptionally well this week, registering a 26% gain. The altcoin is trading at $0.427 at the time of writing, positioning itself as one of the top-performing tokens.
SPX is currently testing the $0.406 support level. If successful in holding this support, the altcoin could see further upside, targeting $0.568. This would help recover losses sustained toward the end of February, pushing SPX toward a more stable and upward trajectory in the coming weeks.
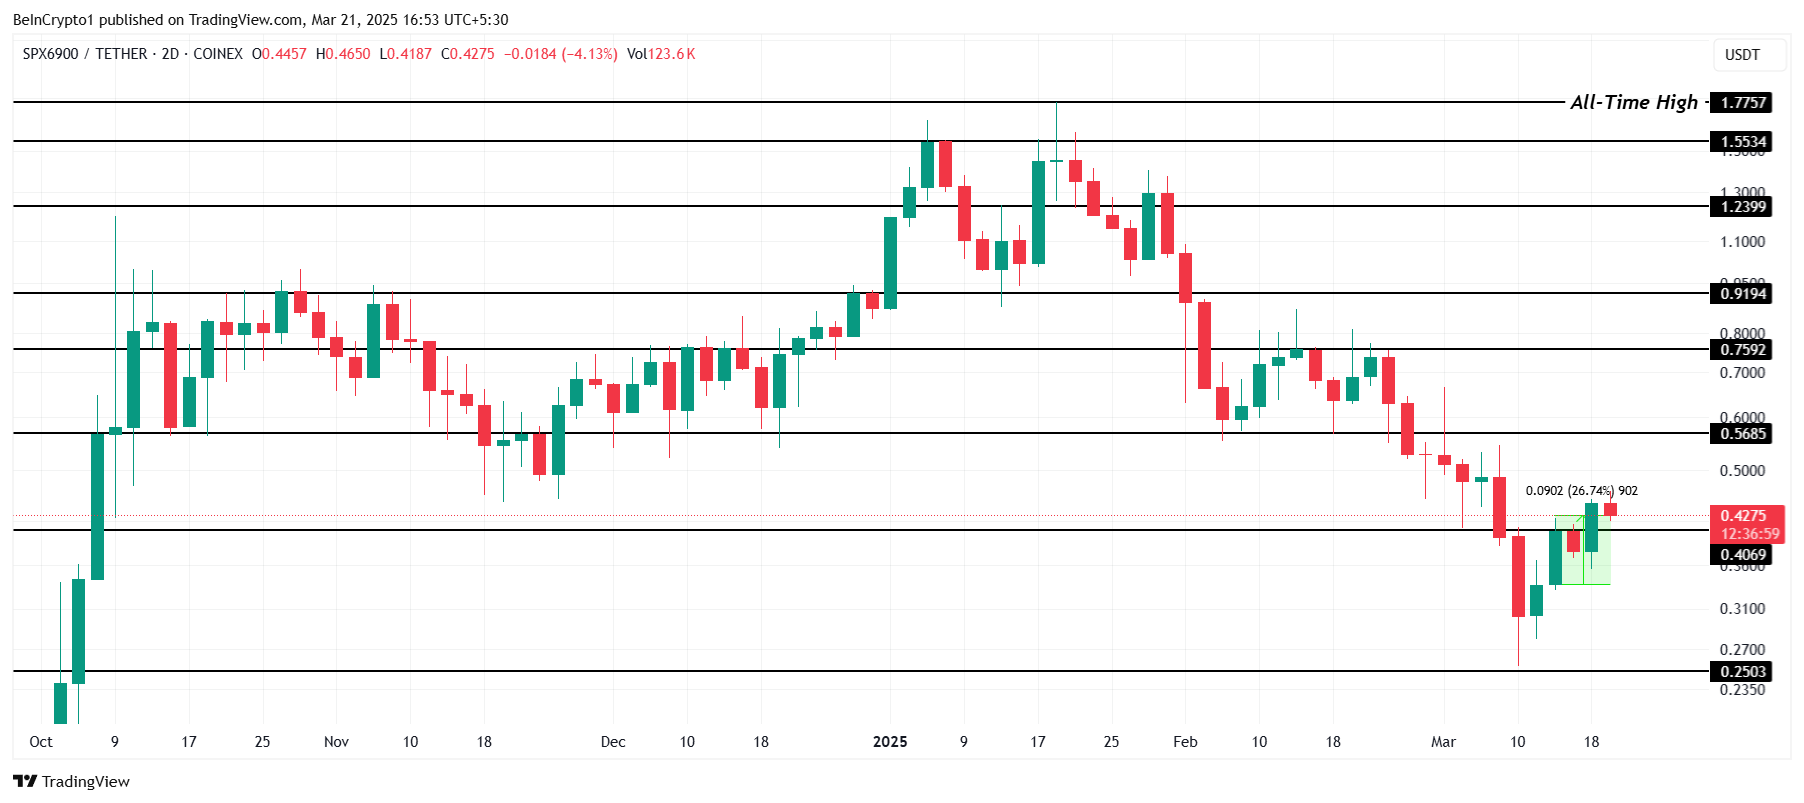
If SPX fails to maintain $0.406 as support, it could face a sharp decline. Falling to $0.250 would mark a significant drop, reaching a five-month low. This would invalidate the bullish outlook and potentially dampen investor sentiment for the altcoin moving forward.
Disclaimer
In line with the Trust Project guidelines, this price analysis article is for informational purposes only and should not be considered financial or investment advice. BeInCrypto is committed to accurate, unbiased reporting, but market conditions are subject to change without notice. Always conduct your own research and consult with a professional before making any financial decisions. Please note that our Terms and Conditions, Privacy Policy, and Disclaimers have been updated.


BlackRock’s tokenized US Treasury fund, BUIDL, has seen a sharp rise in adoption, with the fund’s assets under management (AUM) surging past the $1 billion milestone this month.
This growth highlights a strong shift toward real-world asset (RWA) tokenization, even as broader crypto markets face headwinds.
BlackRock’s BUIDL Leads the RWA Sector
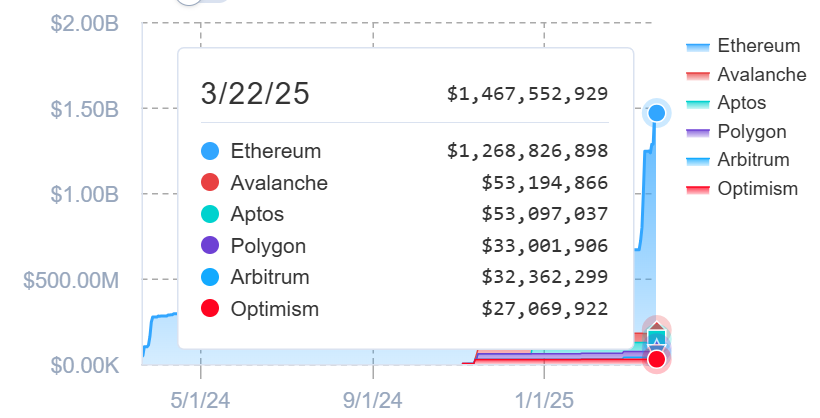
According to data from RWA. XYZ, BUIDL’s AUM, has increased by almost 129% over the last 30 days, bringing it to $1.4 billion.
This milestone means that it took only one year for the fund, which launched on the Securitize platform in March 2024, to cross the $1 billion mark.
While BUIDL has expanded to multiple blockchains, the majority of its supply—over $1 billion, or 86.46%—remains on Ethereum. This indicates strong minting activity on the network.
Other chains, such as Avalanche and Aptos, each hold about $56 million of the fund’s supply, or roughly 3.6%. Ethereum Layer-2 networks like Polygon, Arbitrum, and Optimism host the rest.
Meanwhile, investor participation has also grown. In the past month, the number of holders rose by 19%, bringing the total to 62.
Market observers pointed out that these numbers highlight the growing trust in blockchain-based financial products and the rising institutional interest in tokenizing bonds and credit.
Fidelity Joins the Tokenization Race
BUIDL’s milestone comes as asset management firm Fidelity also moves into the tokenization space.
Over the past week, the firm filed with the US Securities and Exchange Commission (SEC) to launch a blockchain-based version of its Treasury money market fund. The new share class, named “OnChain,” will operate using blockchain as a transfer agent and settlement layer.
“The OnChain class of the fund currently uses the Ethereum network as the public blockchain. In the future, the fund may use other public blockchain networks, subject to eligibility and other requirements that the fund may impose,” the filing added.
Fidelity’s move mirrors a broader trend. Financial institutions are turning to blockchain to tokenize bonds, funds, and credit instruments. This shift offers improved efficiency, round-the-clock settlement, and better transparency.
Meanwhile, the filing comes as institutional interest in RWAs continues to rise, despite a sluggish crypto market. While Bitcoin is down 11% year-to-date, RWA tokens have seen sustainable growth in 2025.
On-chain data shows the total RWA market has grown 18.29% in the past 30 days, reaching $19.23 billion. The number of RWA holders also increased by 5%, now nearing 91,000.
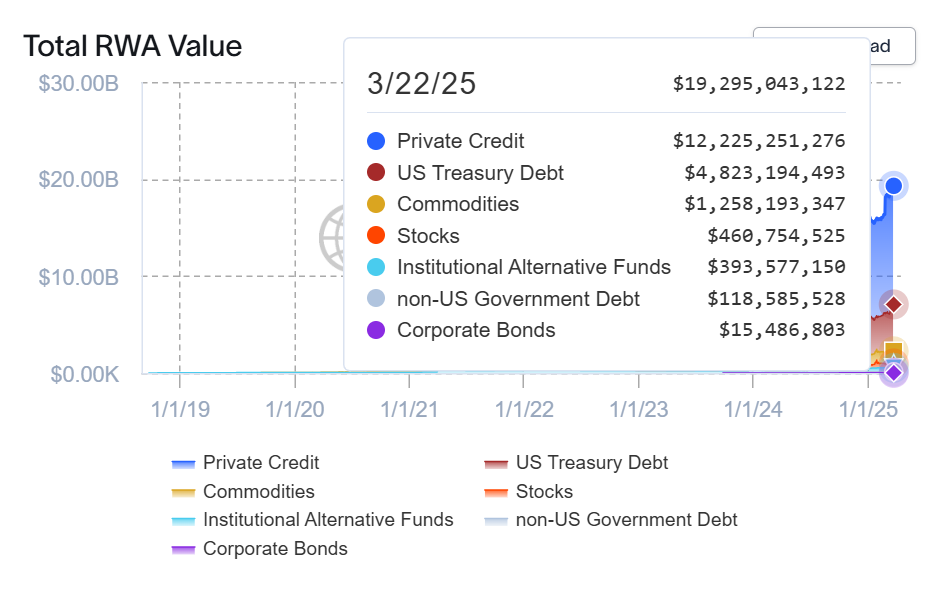
BlackRock’s BUIDL leads the RWA space by market cap. It’s followed by Hashnote’s USDY at $784 million and Tether Gold (XAUT) at $752 million.
Meanwhile, US Treasuries make up $4.76 billion of the total, while private credit dominates with $12.2 billion.
Disclaimer
In adherence to the Trust Project guidelines, BeInCrypto is committed to unbiased, transparent reporting. This news article aims to provide accurate, timely information. However, readers are advised to verify facts independently and consult with a professional before making any decisions based on this content. Please note that our Terms and Conditions, Privacy Policy, and Disclaimers have been updated.

The meme-inspired cryptocurrency PEPE has once again captured the attention of traders as its price demonstrates remarkable resilience, holding firm above a key 100-day simple moving average (SMA) after a brief pullback. This technical strength has sparked speculation about whether PEPE is gearing up for a bullish continuation, potentially reigniting its upward momentum.
With traders closely monitoring price action, a breakout above nearby resistance could confirm a bullish continuation, setting the stage for further gains. However, failure to maintain support may shift momentum in favor of the bears as PEPE hovers at this critical juncture.
PEPE Recent Price Action: A Snapshot
PEPE has been displaying steady price movement, holding above a key support level and maintaining bullish momentum. After bouncing from recent lows, the meme coin has managed to stay above a crucial moving average. This stability suggests that buyers are still in control, preventing a deeper pullback and keeping the uptrend intact.
Technical indicators continue to support a bullish outlook for PEPE. The Relative Strength Index (RSI) remains in positive territory, reflecting sustained buying momentum. If the RSI holds its current course, it can strengthen the case for more upside, suggesting that the uptrend has room to extend.
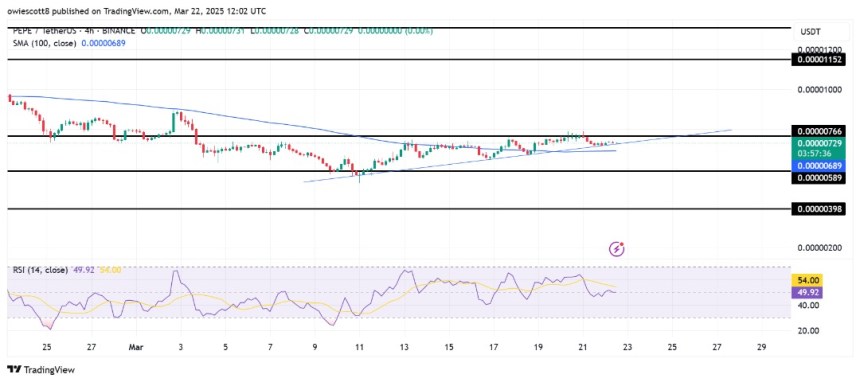
Trading volume has remained consistent, indicating sustained interest from market participants. However, resistance levels ahead will play a crucial role in determining whether PEPE can extend its rally or face a temporary slowdown. If bullish momentum strengthens, the price could push toward the $0.00000766 resistance level.
A decisive breakout above this level serves as a strong bullish confirmation, paving the way for further upside. Should buying pressure intensify, PEPE may rally toward the next significant resistance, attracting more traders looking to capitalize on the upward trend.
Bearish Scenario: Key Support Levels If Momentum Shifts
While PEPE remains in bullish territory, a shift in momentum will open the door for a potential pullback. If selling pressure increases, the first key support to watch is the moving average level that has been acting as a price floor. A break below this level could weaken bullish confidence and trigger a deeper decline.
Further downside raises the risk of a decline toward secondary support zones such as $0.00000589 and $0.00000398, where buyers may attempt to regain control. Failure of the bulls to defend these levels will open the door for other support levels to be tested. Additionally, declining volume and a bearish crossover in momentum indicators such as the MACD or RSI could further confirm a shift in sentiment.
For now, the uptrend remains intact, but traders should remain cautious of any signs of weakness. Holding above these key support zones will be crucial in determining whether bulls can maintain control or if bears will take over.
Reason to trust
![]()
Strict editorial policy that focuses on accuracy, relevance, and impartiality
Created by industry experts and meticulously reviewed
The highest standards in reporting and publishing
Strict editorial policy that focuses on accuracy, relevance, and impartiality
Morbi pretium leo et nisl aliquam mollis. Quisque arcu lorem, ultricies quis pellentesque nec, ullamcorper eu odio.
The XRP price is showing signs of a potential breakout, with a crypto analyst pointing to key technical indicators that suggest a potential surge to $4. Notably, the cryptocurrency has been trading within a descending trendline, but a decisive move above this resistance could ignite a long-awaited rally to a new all-time high.
XRP Price Eyes Breakout To $4
According to pseudonymous TradingView crypto analyst ONE1iMPACT, the XRP price has been making lower highs, forming a descending trendline on the 8-hour chart. The analyst’s chart analysis highlights key technical indicators based on price action that suggest that the XRP price may be gearing up for a possible rally to $4.
Related Reading
XRP’s projected surge to a $4 ATH is dependent on how it reacts to the descending trendline, which acts as a critical resistance area. With this in mind, a breakout and close above this trendline with higher-than-average volume signals bullish momentum for the XRP price.
Interestingly, the analyst disclosed that the market is currently hovering near or just below a key Moving Average (MA), indicated by the blue line in the chart. If XRP’s price can reclaim and hold above this MA, it would reinforce its bullish position and solidify the analyst’s optimistic price target. On the flip side, if it remains below this MA, the TradingView expert believes that it would put a barrier to its upside potential.
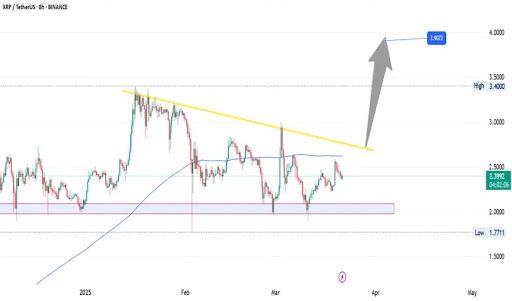
Moving forward, the analyst has shared key technical areas that could determine XRP’s next price movements. He revealed that if the cryptocurrency breaks above the descending trendline, the next major resistance area is the horizontal level around $3.40. Furthermore, a confirmed breakout could send its price toward $3.9 – $4.00, aligning with the target shown by the grey arrow in the chart.
The TradingView crypto expert warned investors and traders to pay attention to the volume and momentum of XRP as it aims for a descending trendline breakout. He explained that a low volume push above the trendline is a clear indication of a possible fakeout, where traders could be lured into entering long positions, only for the price to trace quickly. On the other hand, a high volume surge confirms the conviction of XRP’s bullish potential, leading to a sustained upward momentum and increasing prices.
The analyst also added that oscillators like the Relative Strength Index (RSI) and Moving Average Convergence Divergence (MACD) could help traders gauge whether XRP’s momentum is building or fading as its price approaches the descending trendline resistance.
Possible Downside Target If Resistance Fails
In his analysis, ‘ONE1iMPACT’ also shared a bearish outlook for the XRP price if it fails to break and close above the descending trendline resistance. The TradingView analyst revealed that a rejection at this trendline could trigger further consolidation and decline for XRP.
Related Reading
He has shared several important support levels that could help prevent an even deeper correction in the XRP price. The $2.0 and $2.1 region, marked by the pink and gray box on the chart, acts as a strong support area for XRP, where buyers have stepped in before.
If the XRP price loses this zone, the analyst predicts a major breakdown toward $1.8 – $1.77. Another decline below this price low could result in a much larger correction.
Featured image from Adobe Stock, chart from Tradingview.com

Dogecoin Consolidation Suggests Uptrend Could Continue, But There’s A Threat

BlackRock Dominates RWA With BUIDL’s AUM Nearing $1.5 Billion

Burwick Law Demands Compensation—Here’s Why

Dogecoin Open Interest Dumps To November 2024 Levels, Will Price Follow?

PEPE Bulls Regain Control As Price Stays Above Moving Average

Trump Administration Push for Blockchain-Powered USAID Overhaul—Here’s What Could Change

2.52 Million Altcoins Are Ruining Crypto’s Future

Animoca Brands Valuation Tanks 75% In Two Years, Here’s Why

Crypto exchange BingX hacked for $43 million

Are The Big Players Losing Interest?

Hong Kong’s Securities Association Tips Authorities On Crypto Self-Regulation

Coinbase cbBTC Set to go Live on Solana
2.52 Million Altcoins Are Ruining Crypto’s Future
Animoca Brands Valuation Tanks 75% In Two Years, Here’s Why
Crypto exchange BingX hacked for $43 million
Are The Big Players Losing Interest?
Hong Kong’s Securities Association Tips Authorities On Crypto Self-Regulation
Coinbase cbBTC Set to go Live on Solana
-

 Bitcoin23 hours ago
Bitcoin Rally Incoming? M2 Money Supply Rebound Signals Big Moves Ahead
-
 Altcoin23 hours ago
Will ETH ETF Net Outflow Exceed $20 Million?
-
 Altcoin18 hours ago
What Could XRP Price Be In Trump’s Second term
-

 Market24 hours ago
Cardano (ADA) Faces Death Cross After Price Falls 37% In March
-

 Market23 hours ago
Tornado Cash (TORN) Price is Set For Correction After 40% Rally
-

 Bitcoin22 hours ago
Bitcoin To The Rescue? Saylor Says EU Will Need BTC Amid Euro Woes
-

 Ethereum20 hours ago
Ethereum Price Nears Major Resistance At $2,200, Why A 13% Crash Could Follow
-
 Market20 hours ago
PancakeSwap Whales Buy 25 Million CAKE After 50% Price Rally