
Market
KAVA Coin Surges to 30-Day High, Defying Market Downturn
Layer-1 (L1) coin KAVA emerged as the market’s top gainer on Friday, defying the broader downturn to post gains over the past 24 hours. While most cryptocurrencies have struggled within a narrow range in recent weeks, KAVA has surged, setting itself apart from the pack.
Now trading at a 30-day high, the altcoin shows strong bullish momentum and could be gearing up for even more upside.
KAVA Defies Market Downtrend, Surges to 30-Day High
KAVA is up 7% over the past day. It trades at a 30-day high of $0.55, bucking the general market decline to record 21% gains over the past month. With a strengthening bullish bias, the L1 coin eyes more gains.
On the KAVA/USD one-day chart, the coin’s Aroon Up Line is at 100%, confirming the strength of its current uptrend.
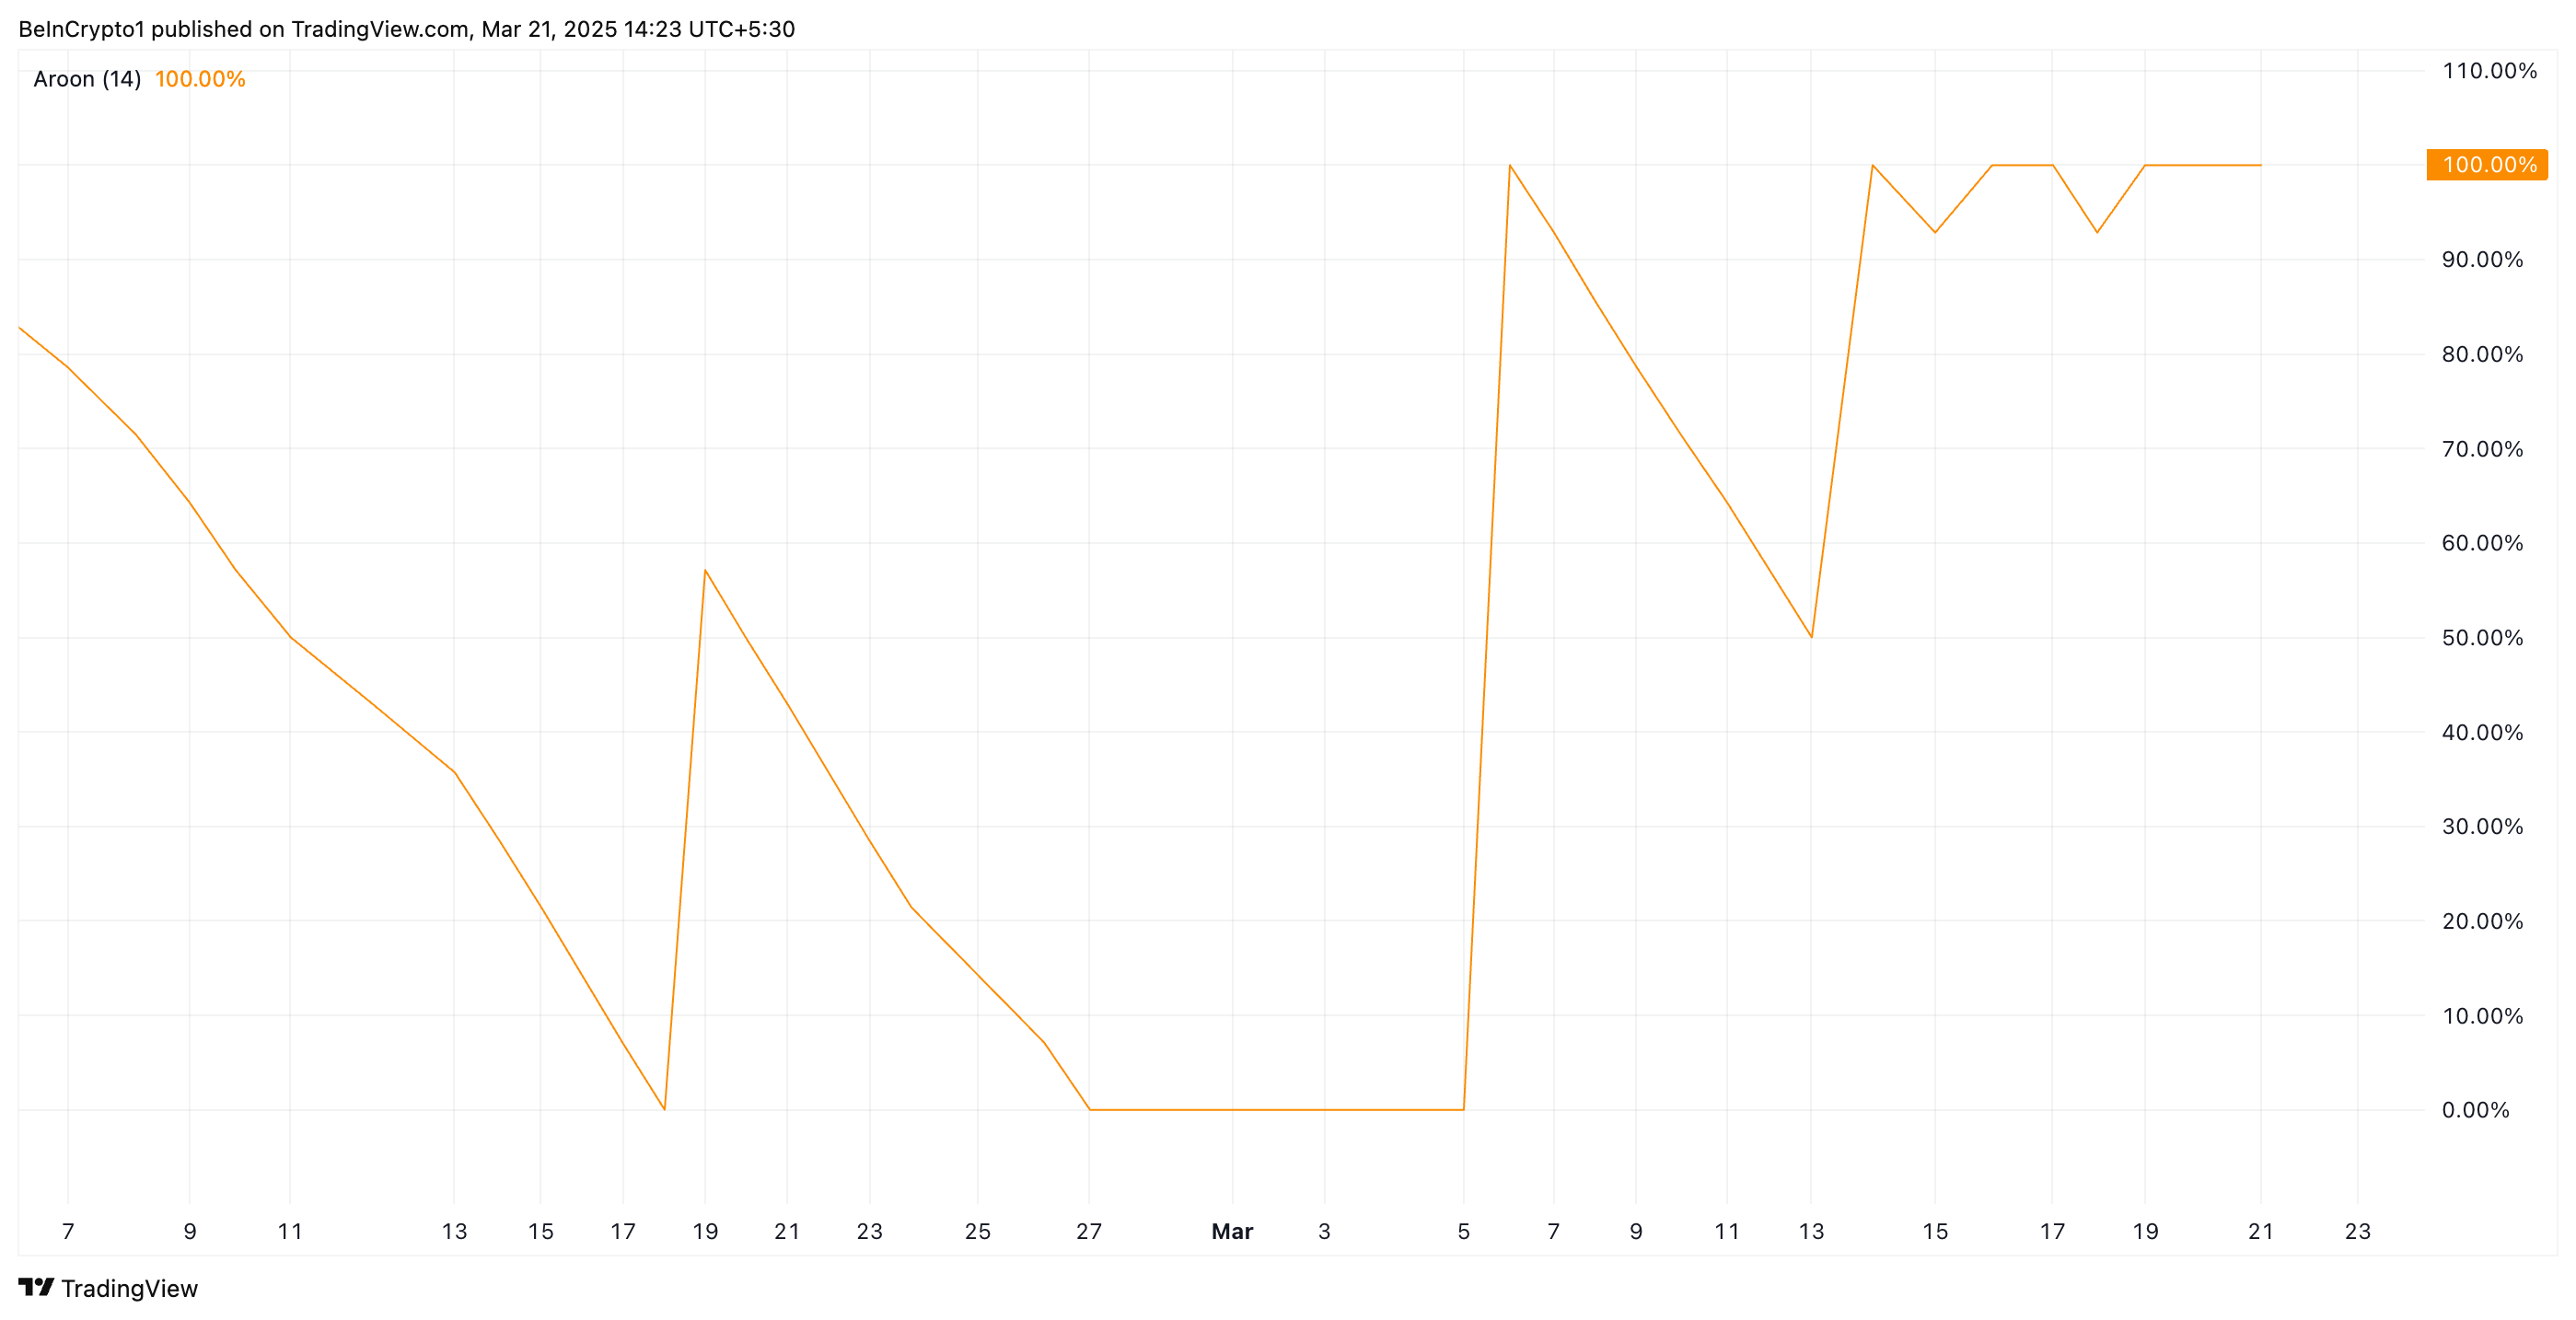
The indicator measures the strength of an asset’s price trends. It consists of two lines: Aroon Up, which tracks the time since the highest high, and Aroon Down, which tracks the time since the lowest low.
When the Aroon Up line is at 100% or near it, the asset has recently hit a new high and is in a strong uptrend. This is true of KAVA, which trades at its highest price in 30 days. It reflects the strong bullish momentum in the coin’s spot markets, indicating that buyers are in control and its price may continue rising.
Further, the coin’s Moving Average Convergence Divergence (MACD) setup confirms this bullish outlook. At press time, KAVA’s MACD line (blue) rests above its signal line (orange).
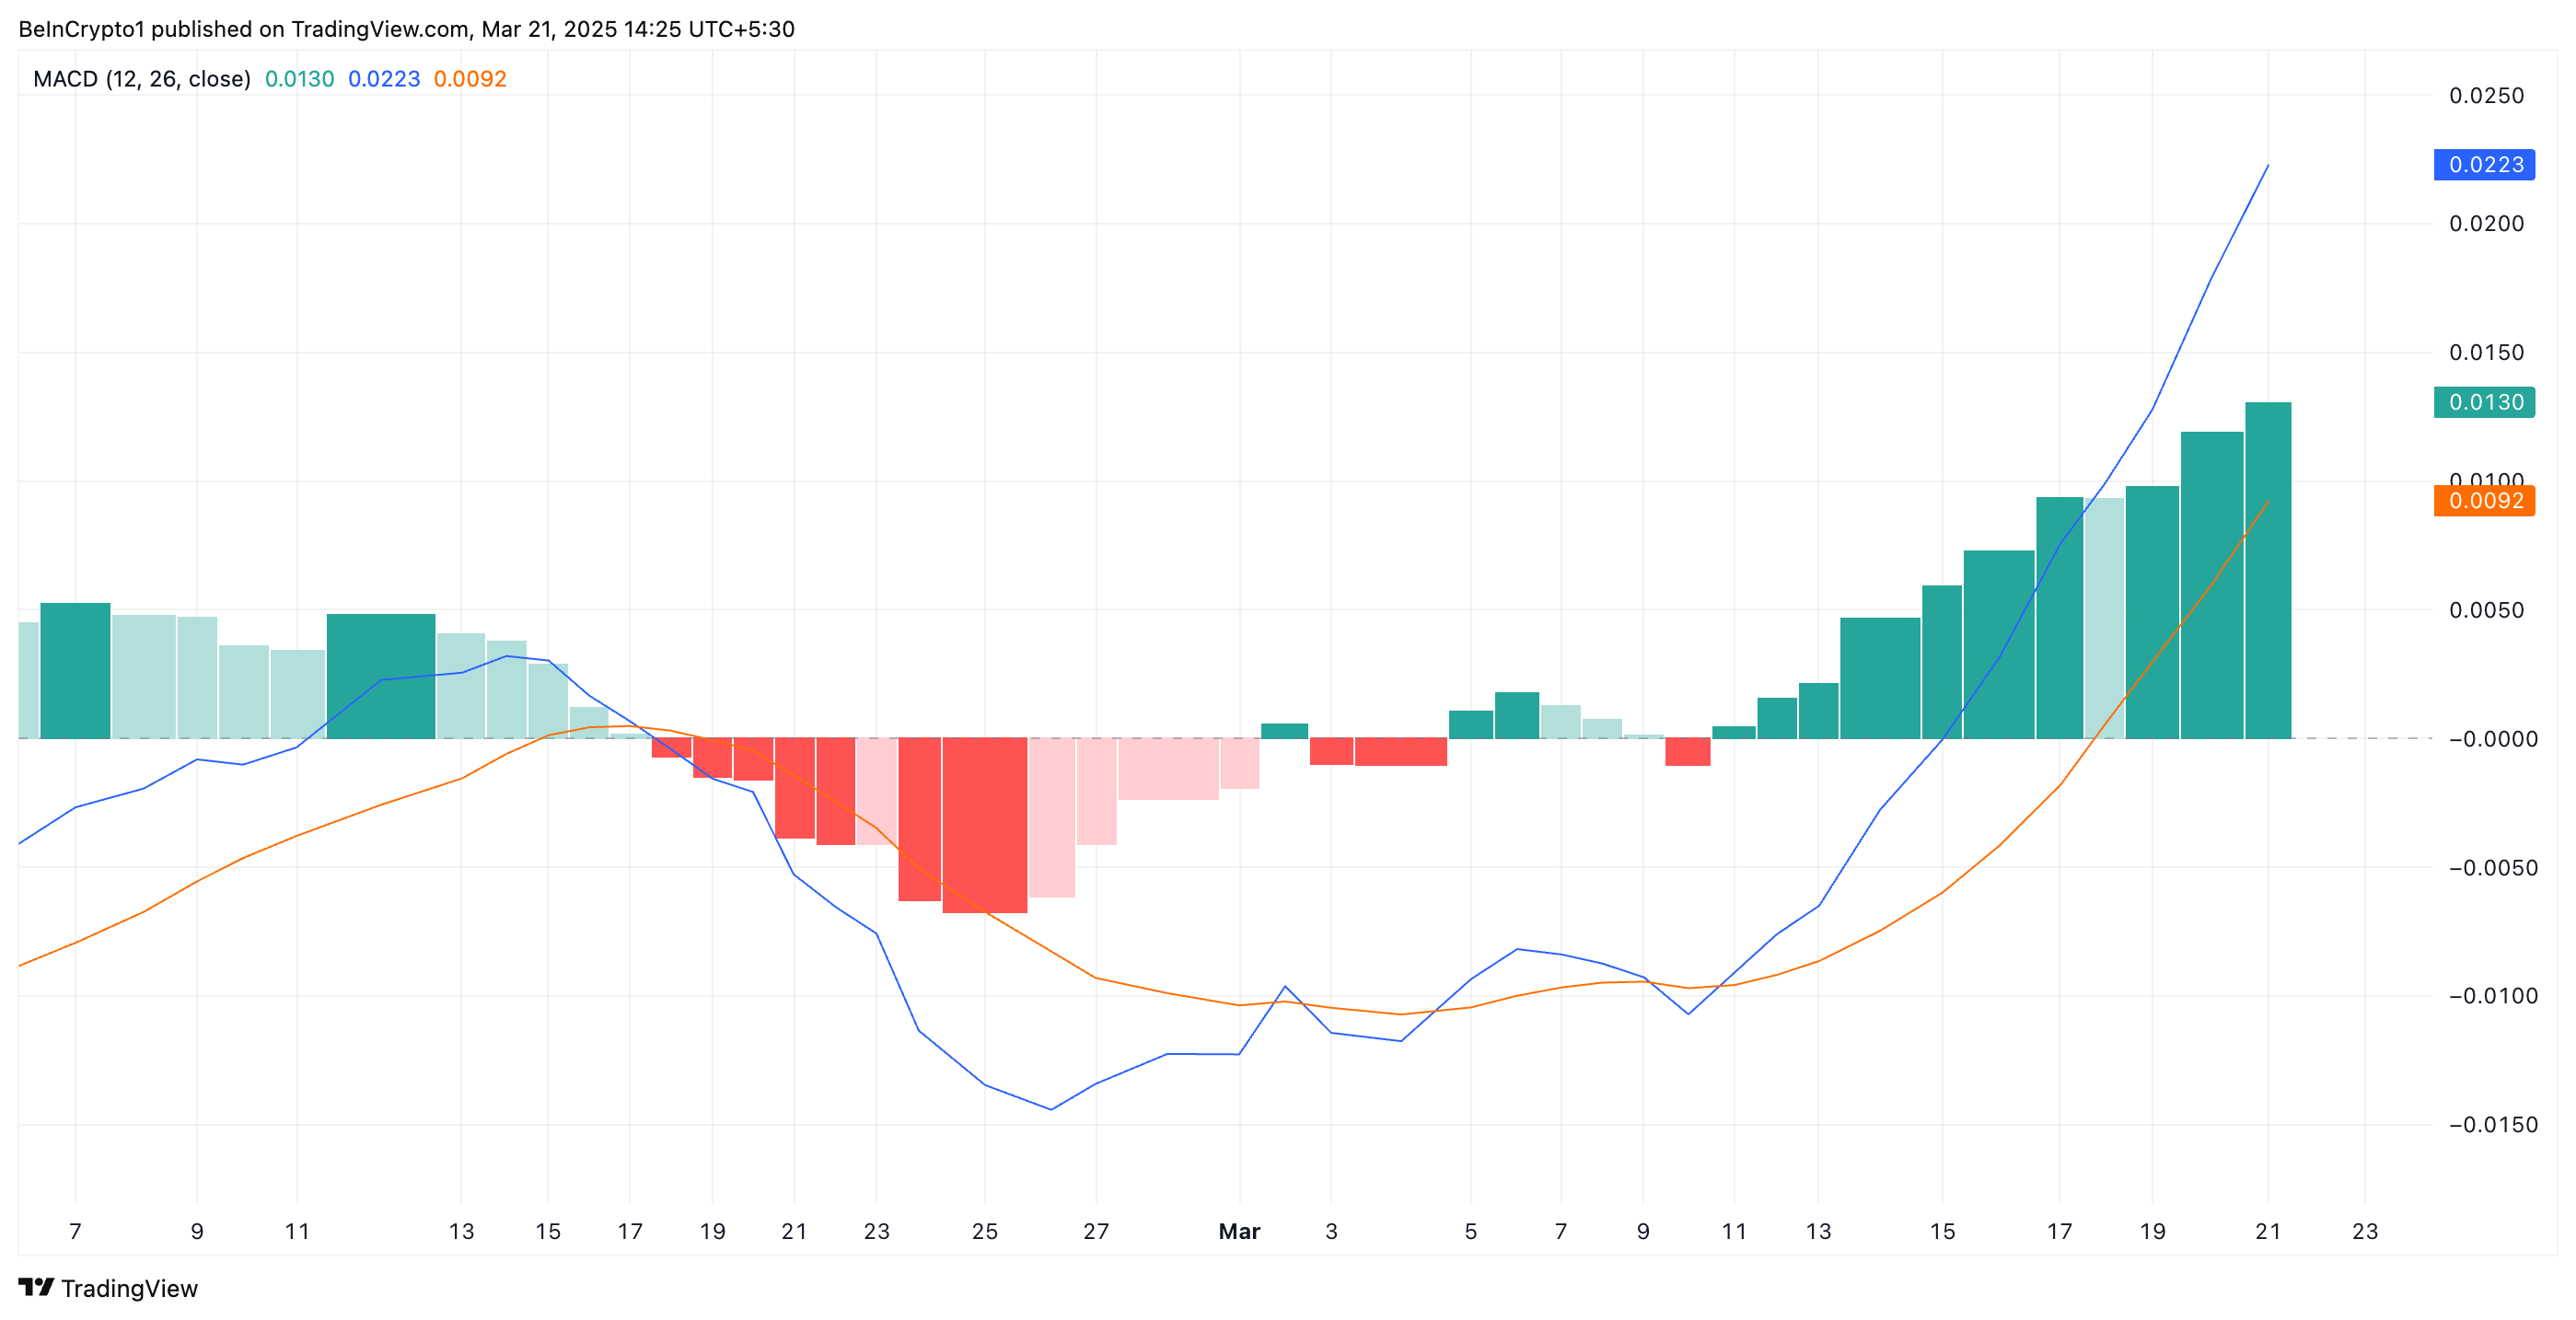
The MACD indicator measures the strength and direction of an asset’s momentum. It helps traders identify potential trend reversals and momentum shifts.
When the MACD line is above the signal line, it is a bullish signal, often interpreted by traders as a buy signal.
KAVA’s Uptrend Remains Intact, Eyeing a Three-Month High at $0.74
KAVA has traded within an ascending parallel channel since March 10. This bullish pattern is formed when an asset’s price moves between two upward-sloping parallel trendlines, indicating a sustained uptrend.
It signals consistent higher highs and higher lows, showing strong bullish pressure as KAVA buyers dominate the market. If this continues, the coin’s price could break past resistance at $0.58 and climb toward a three-month high of $0.74.
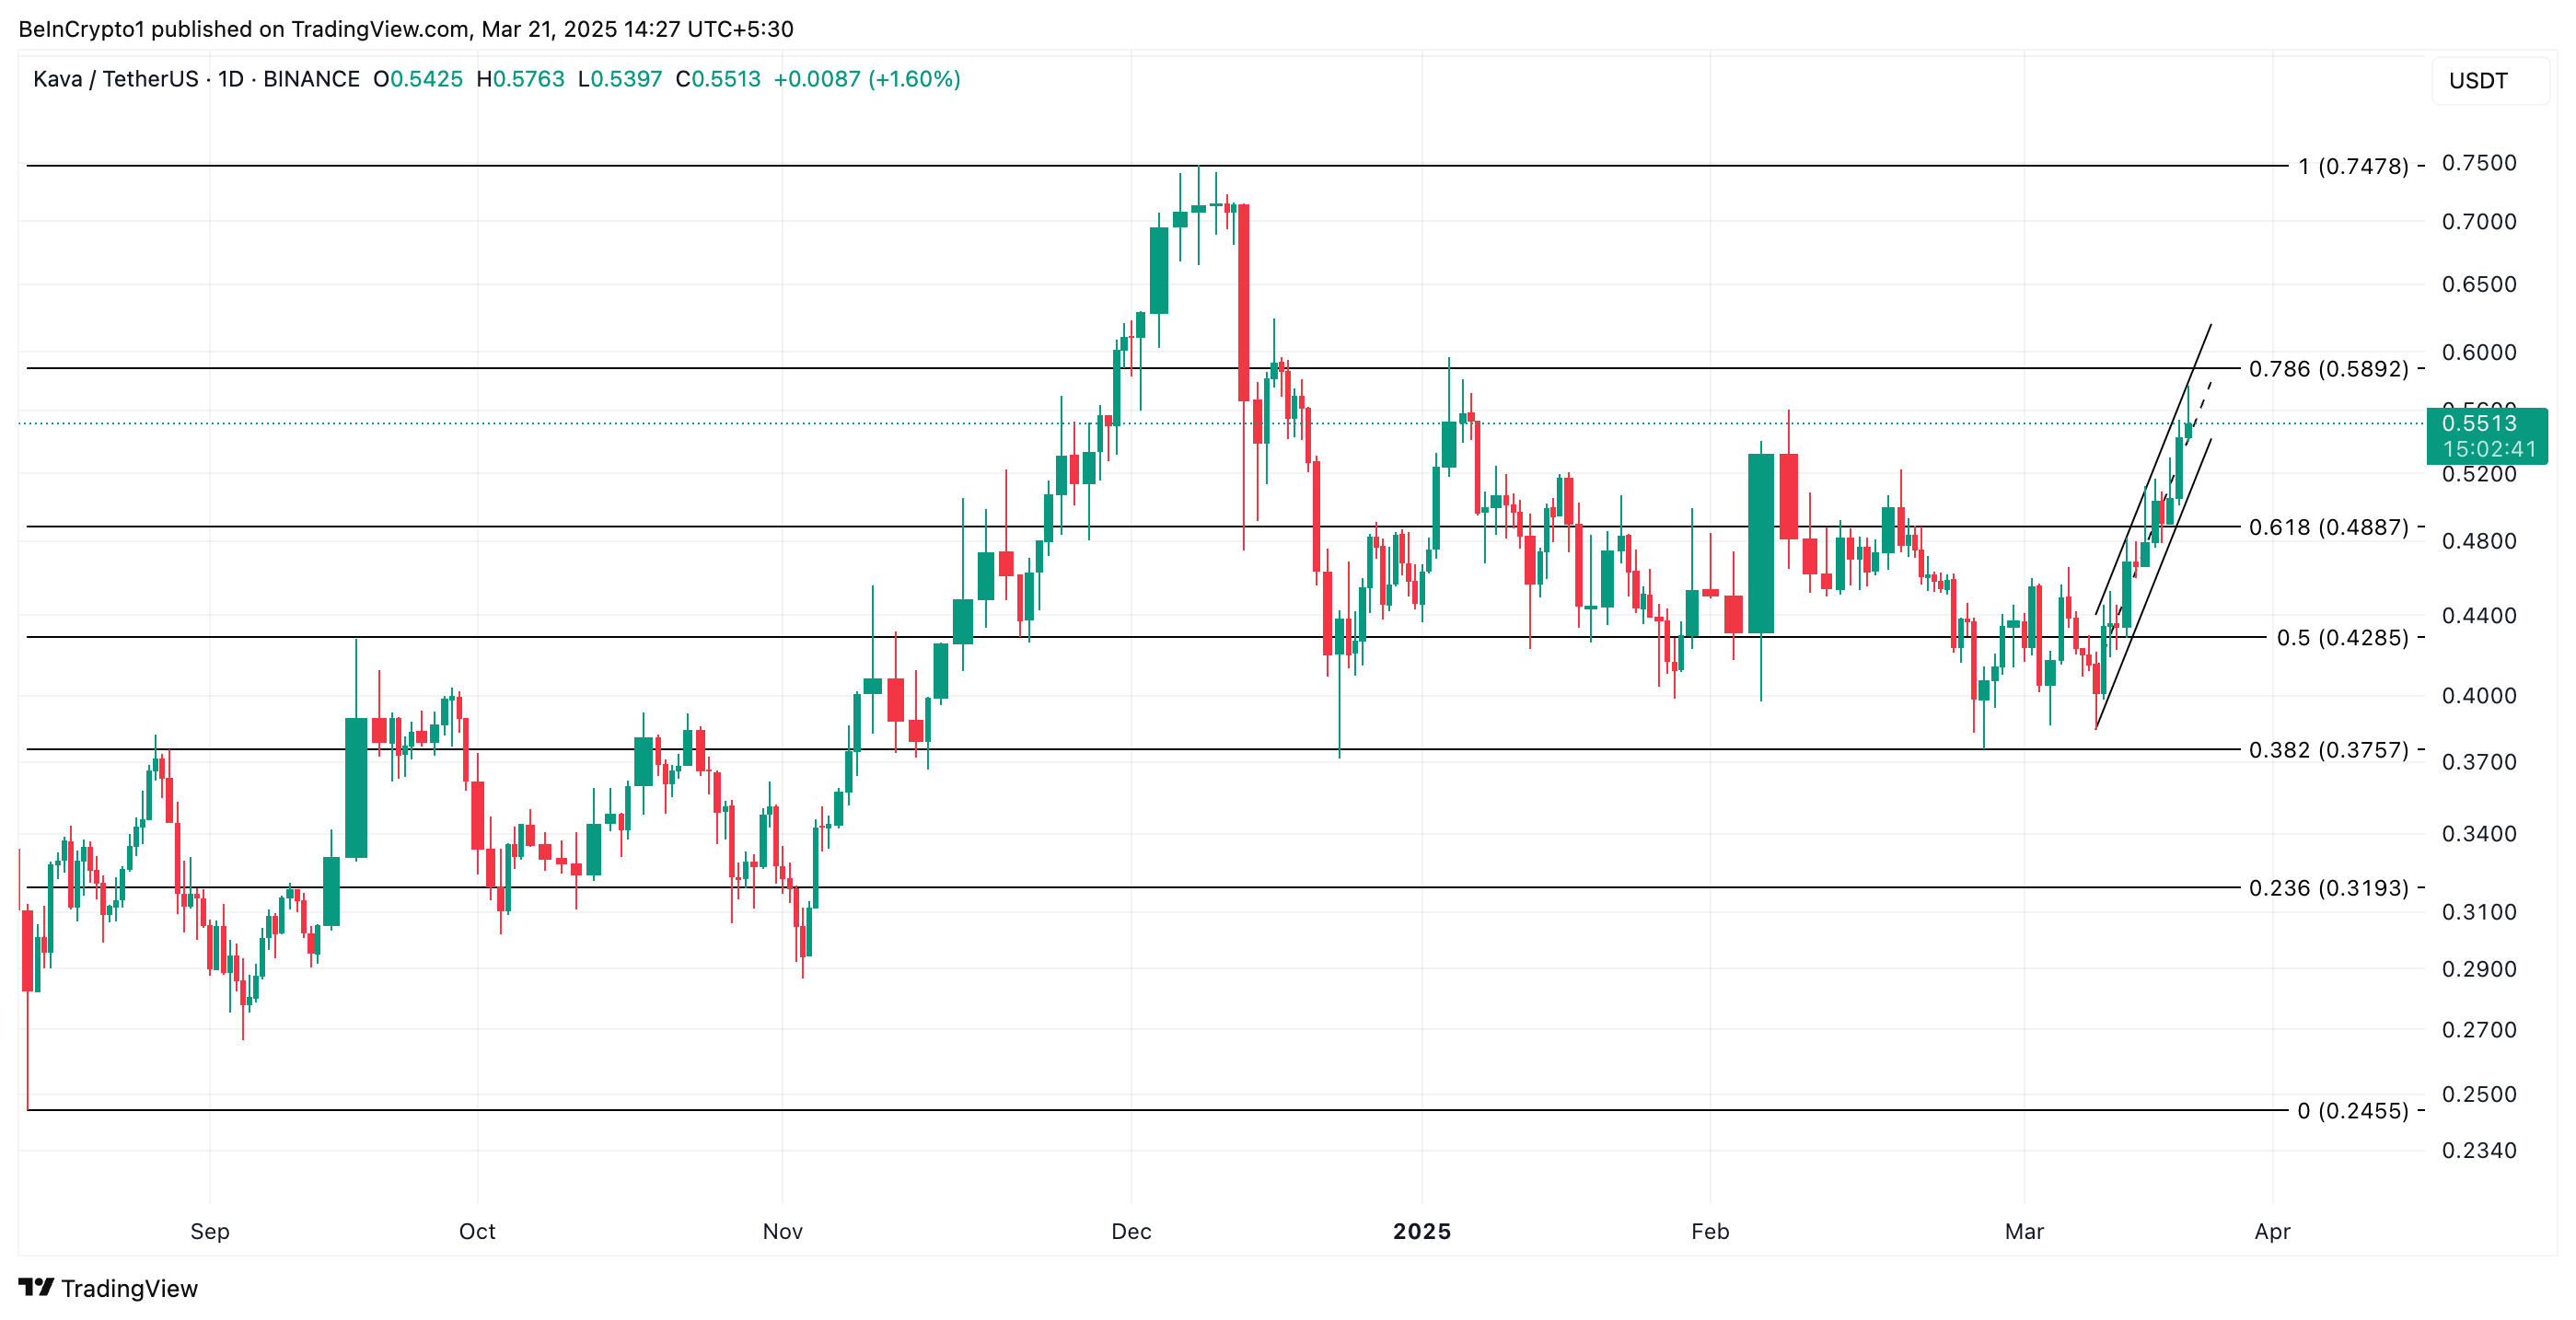
On the other hand, if buying activity weakens, KAVA could shed its recent gains and fall to $0.48.
Disclaimer
In line with the Trust Project guidelines, this price analysis article is for informational purposes only and should not be considered financial or investment advice. BeInCrypto is committed to accurate, unbiased reporting, but market conditions are subject to change without notice. Always conduct your own research and consult with a professional before making any financial decisions. Please note that our Terms and Conditions, Privacy Policy, and Disclaimers have been updated.


According to reports, World Network is in talks with Visa to launch a new stablecoin wallet. This would integrate crypto-native features into Visa’s massive customer base.
Worldcoin’s price jumped 13% since this news first broke. However, there is no firm indication of how likely these parties are to reach an actual deal.
Will Visa Partner with Worldcoin?
World Network (formerly Worldcoin), a blockchain-based biometric identification system, may be entering a partnership with Visa soon.
According to recent reports, World’s parent company, Tools for Humanity, initiated this dialogue. It wishes to team up with Visa to create a new stablecoin wallet integrated with a massive customer base:
“OpenAI CEO Sam Altman is reportedly working with Visa to develop a crypto stablecoin wallet tied to the Worldcoin ecosystem. The wallet would integrate on-chain card features and allow stablecoin payments across Visa’s global network. Sources say the goal is to make the World Wallet a ‘mini bank account’ with FX, fiat ramps, and more,” Mario Nawfal stated on X.
Over the past few months, Worldcoin’s value has gone down dramatically. Although it briefly rallied towards the end of 2024, investor sell-offs and regulatory setbacks have consistently frustrated its fans.
However, since the talks between Visa and World network were first publicized, Worldcoin managed a rally of 13%.
Visa, for its part, has collaborated with several crypto companies in the past. It entered the RWA market in 2024 and also partnered with Coinbase to allow Visa debit cards for instant fund transfers.
However, the firm also explored stablecoin market trends last year, with discouraging results. Stablecoins may even threaten Visa’s core business model.
In other words, World Network wants stablecoins at the center of a future deal with Visa, but that might be a sticking point. So far, the talks are apparently in the early stages, and there is no indication whatsoever of how likely a deal is. Nonetheless, active discussions are happening, and this has helped Worldcoin’s value rebound.
It’s important to remember that stablecoins may be a much bigger component of world finance soon. In a recent speech, Donald Trump claimed that stableoins will have an important role in promoting dollar dominance worldwide.
This may possibly incentivize Visa to partner with World Network, but it’s too soon to say.
Disclaimer
In adherence to the Trust Project guidelines, BeInCrypto is committed to unbiased, transparent reporting. This news article aims to provide accurate, timely information. However, readers are advised to verify facts independently and consult with a professional before making any decisions based on this content. Please note that our Terms and Conditions, Privacy Policy, and Disclaimers have been updated.
Reason to trust
![]()
Strict editorial policy that focuses on accuracy, relevance, and impartiality
Created by industry experts and meticulously reviewed
The highest standards in reporting and publishing
Strict editorial policy that focuses on accuracy, relevance, and impartiality
Morbi pretium leo et nisl aliquam mollis. Quisque arcu lorem, ultricies quis pellentesque nec, ullamcorper eu odio.
The XRP price has been consolidating for an extended period after its previous rally. However, a crypto analyst warns that the cryptocurrency could face a flash crash in April, potentially driving its price to new lows. Despite this, the analyst anticipated that the downturn may be short-lived, predicting a rebound shortly after.
MetaShackle, a crypto analyst on TradingView, has shared a chart presenting an Elliott Wave-based analysis of XRP’s price movements. The analyst has also used technical levels such as Fair Value Gaps (FVGs), liquidity zones, and trendlines to determine XRP’s next price action.
XRP Price False Breakout Ahead Of Flash Crash
Related Reading
The XRP price chart follows an advanced 6-wave pattern, with a potential 7th-wave breakout. XRP is currently in Wave 4 of a larger cycle. While Waves 1 to 3 represented a strong upward move, Wave 4 triggered a major correction for the XRP price. If Wave 4 is completed, the cryptocurrency’s price could push higher into Wave 5, reaching $2.80 – $3.00, where an FVG awaits. This move would create a false breakout, taking out liquidity above recent highs.
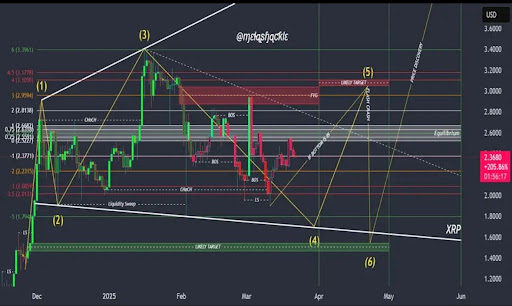
After the projected false breakout, XRP is expected to experience a flash crash in Wave 6 by April 2025. This flash crash will likely hold above the lower white trendline after breaking the upper trendline and targeting the green target area between $1.6 and $1.4 $highlighted by the chart.
The flash crash in April is a theoretical move in which the XRP price retraces sharply before a real breakout. This breakout is expected to start in Wave 7, potentially leading to a price discovery for XRP and reaching a likely target of $3.00 before skyrocketing to new highs above $3.6.
Notably, the analyst predicts that Wave 7 will begin in May 2025. The breakout is anticipated to take out previous all-time highs for the altcoin, surpassing its $3.84 price record in 2018.
Update On Price Analysis
The XRP price is now trading at $2.44 after increasing by 4.56% in the past week. Despite a sharp price crash from its $3.00 high earlier this year, the cryptocurrency remains resilient, and analysts are closely watching its next move.
Related Reading
Notably, analysts continue to take a bullish stance on the XRP price outlook, predicting a potential breakout in the short term. An X (formerly Twitter) market expert, identified as ‘Steph Is Crypto,’ forecasts that the asset could surge to $3.4 soon, marking a 39.34% jump from its market price.
Featured image from Adobe Stock, chart from Tradingview.com

On March 19, the US SEC officially ended its four-year-long lawsuit against Ripple, sparking a surge in XRP network activity. On the same day, the number of active addresses that traded the token skyrocketed to a year-to-date (YTD) high, reflecting heightened investor interest.
However, this momentum has turned short-lived, as on-chain data reveals a steady decline in active wallet count since then.
XRP Demand Fades as Post-Lawsuit Hype Dies
On March 19, Ripple announced that the SEC had officially dropped its four-year-old lawsuit against the payment services company. This led to an immediate spike in the demand for the altcoin, reflected by its high active address count on that day.
According to Glassnode, this climbed to a year-to-date high of 626,854. However, as the post-lawsuit hype wanes, XRP demand has fallen. By March 23, its active address count had plummeted to a 30-day low of 54,704, highlighting the weakening buying pressure in the market.
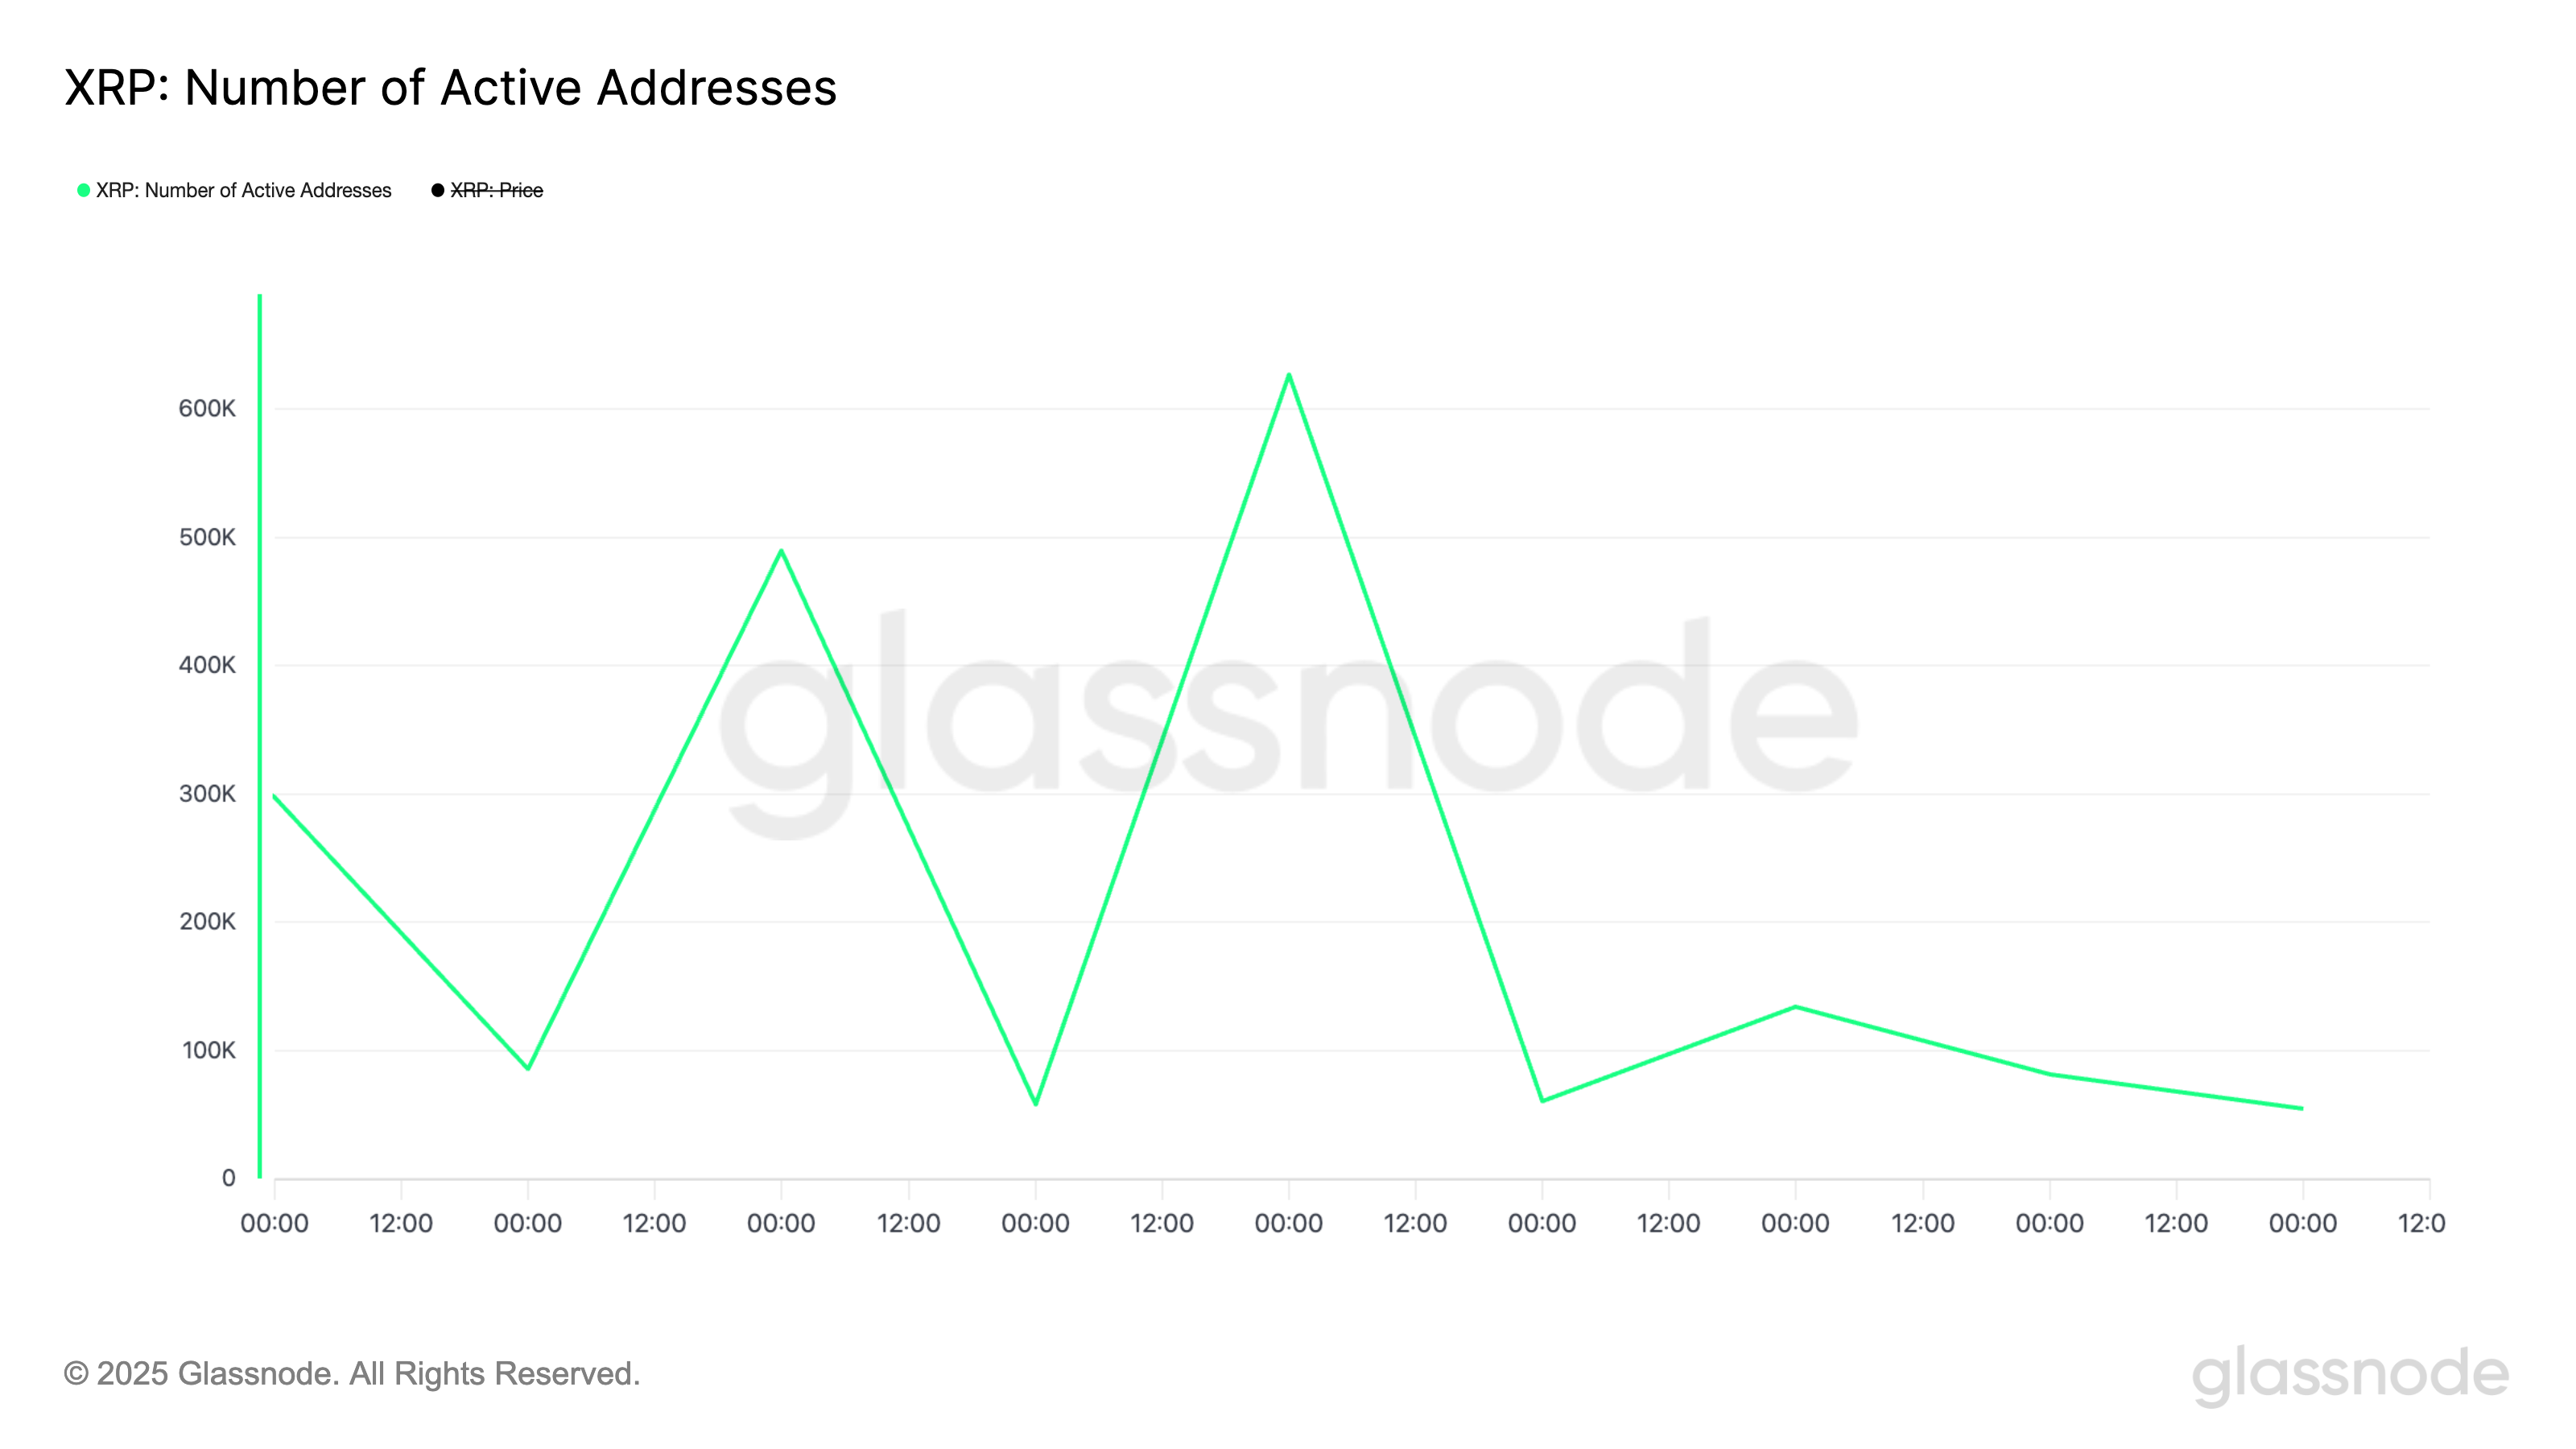
A decline in an asset’s active address count suggests reduced transaction activity and waning buying interest. This is a bearish signal, as it signals declining liquidity, weak investor participation, and decreased utility for XRP.
In addition, on the price chart, XRP remains below its Super Trend Indicator, signaling continued bearish pressure in the market. As of this writing, this momentum indicator forms dynamic resistance above the altcoin’s price at $2.84.
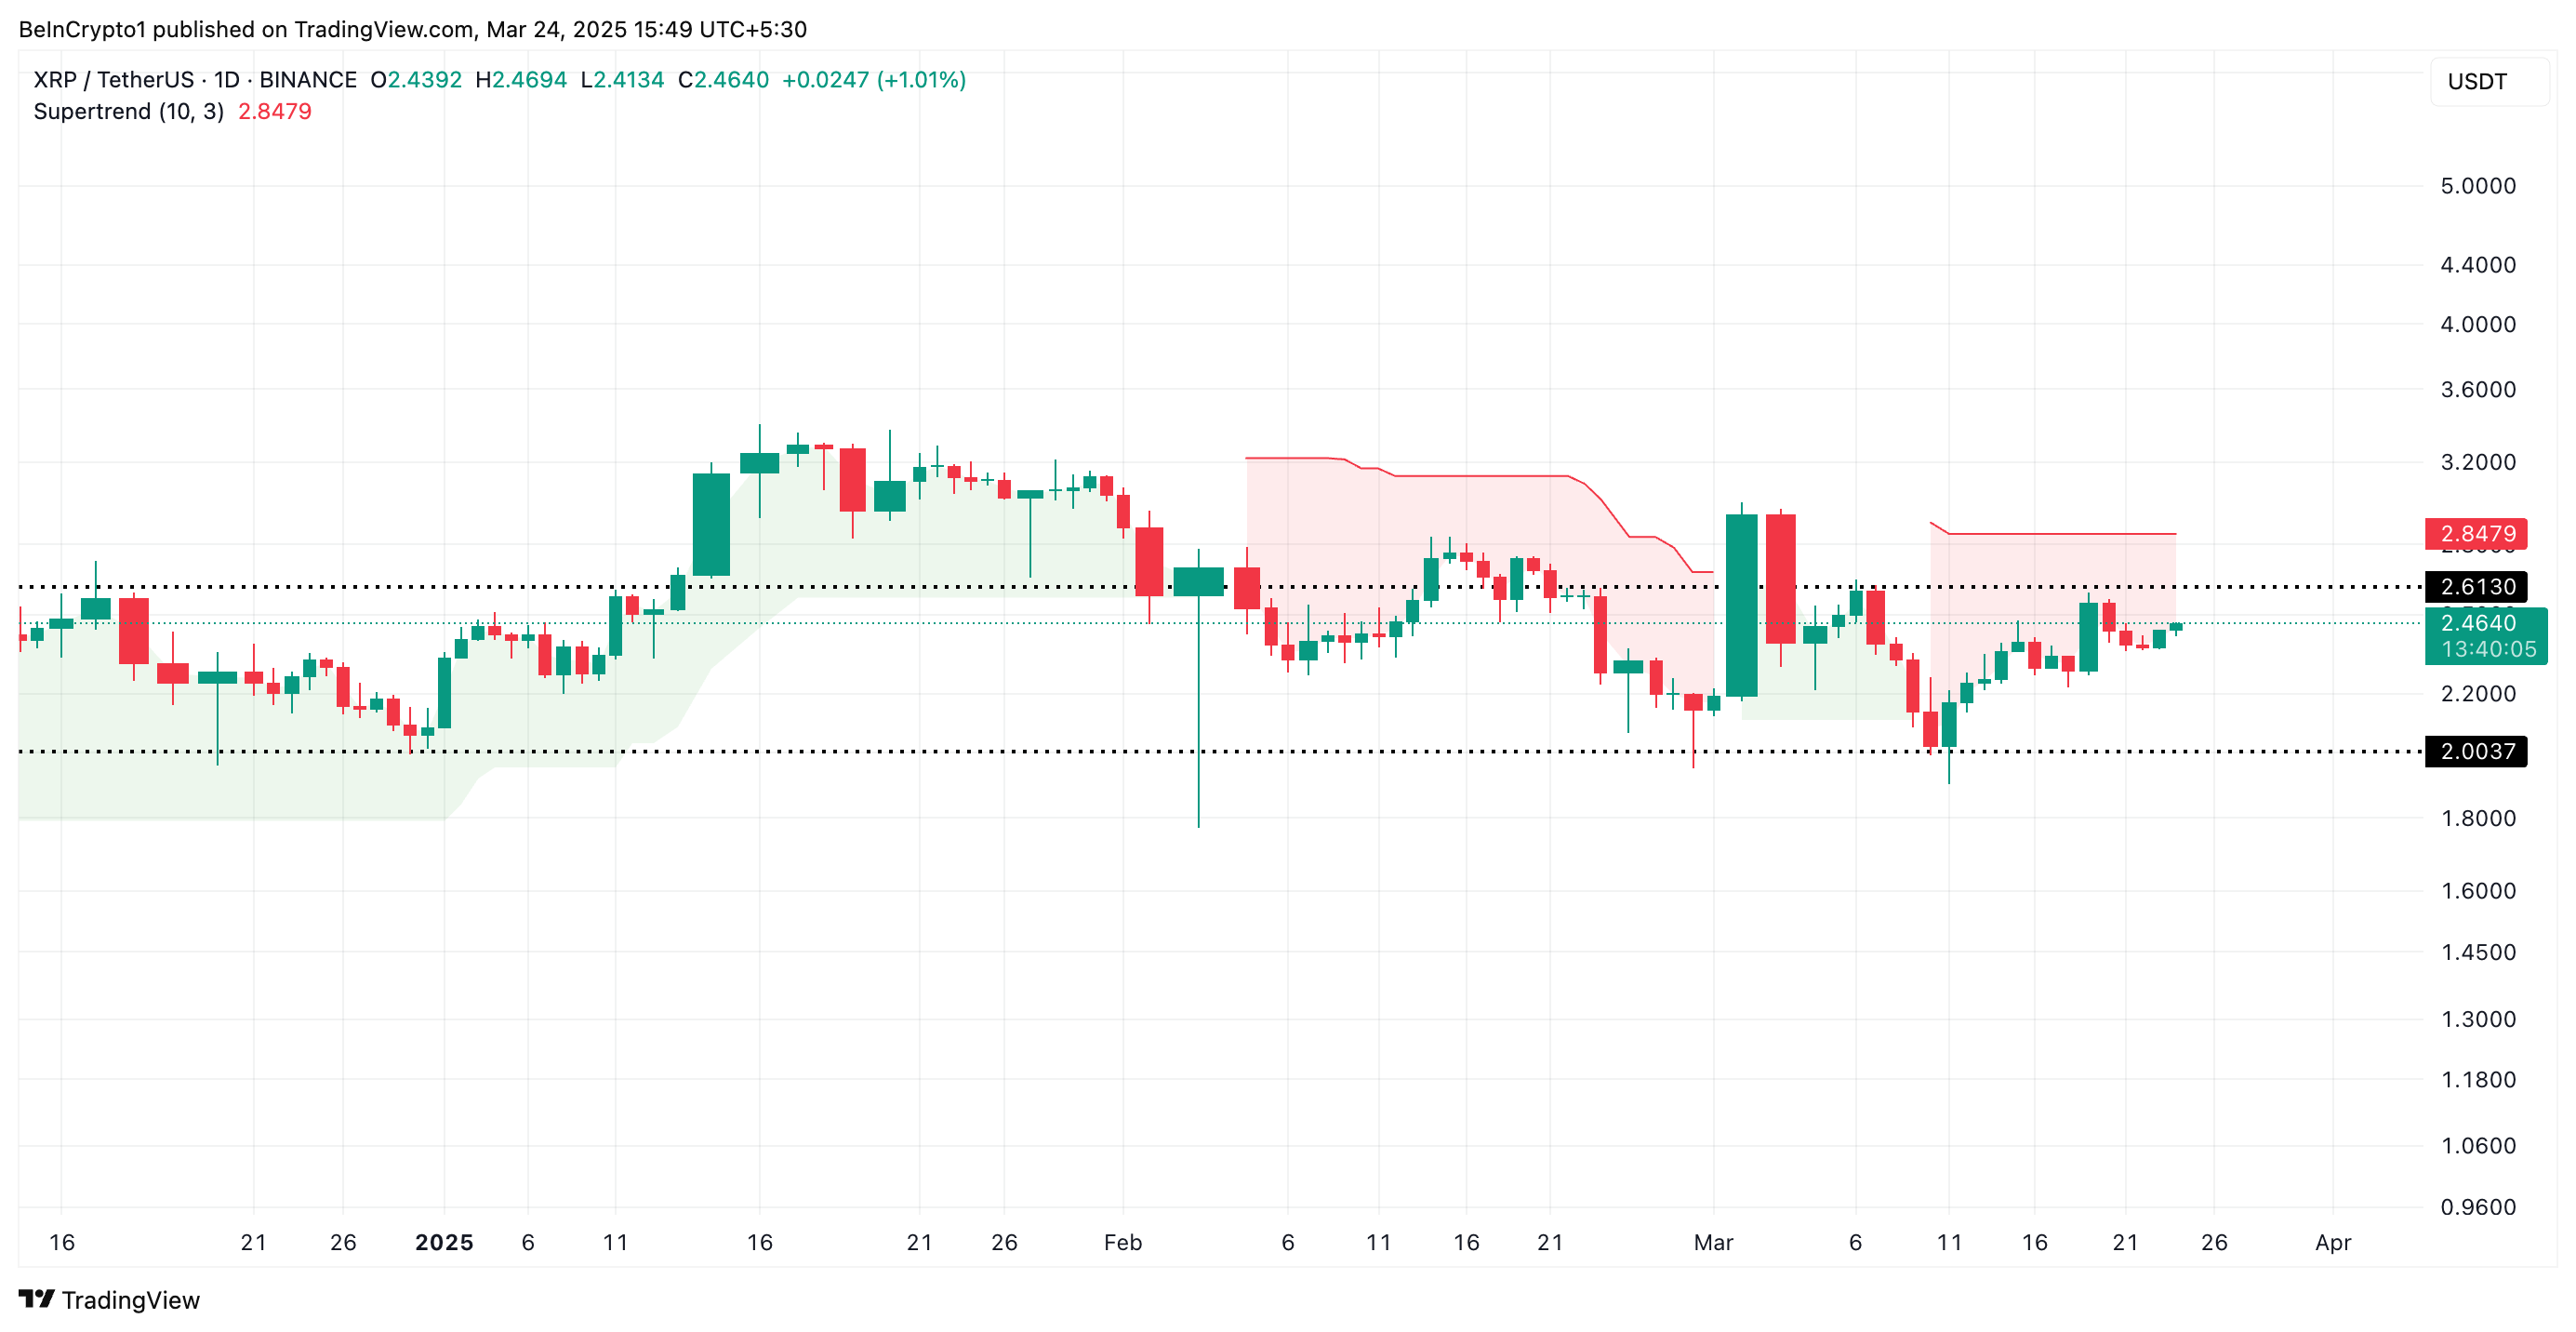
The Super Trend indicator measures the direction and strength of an asset’s price trend. It appears as a line on the price chart, changing color to signify the trend: green for an uptrend and red for a downtrend.
When an asset’s price is below this indicator, the market is in a bearish trend. Traders interpret this as a sell signal or a warning to exit long positions and take short ones.
XRP Bulls Eye Recovery—Breaking $2.61 Could Trigger a Run Toward $2.84
XRP trades at $2.46 at press time, holding above the long-term support formed at $2.13. If bearish pressure climbs, the token could attempt to test this support.
Should it fail to hold, XRP’s price could plunge to $2, where another strong support lies.
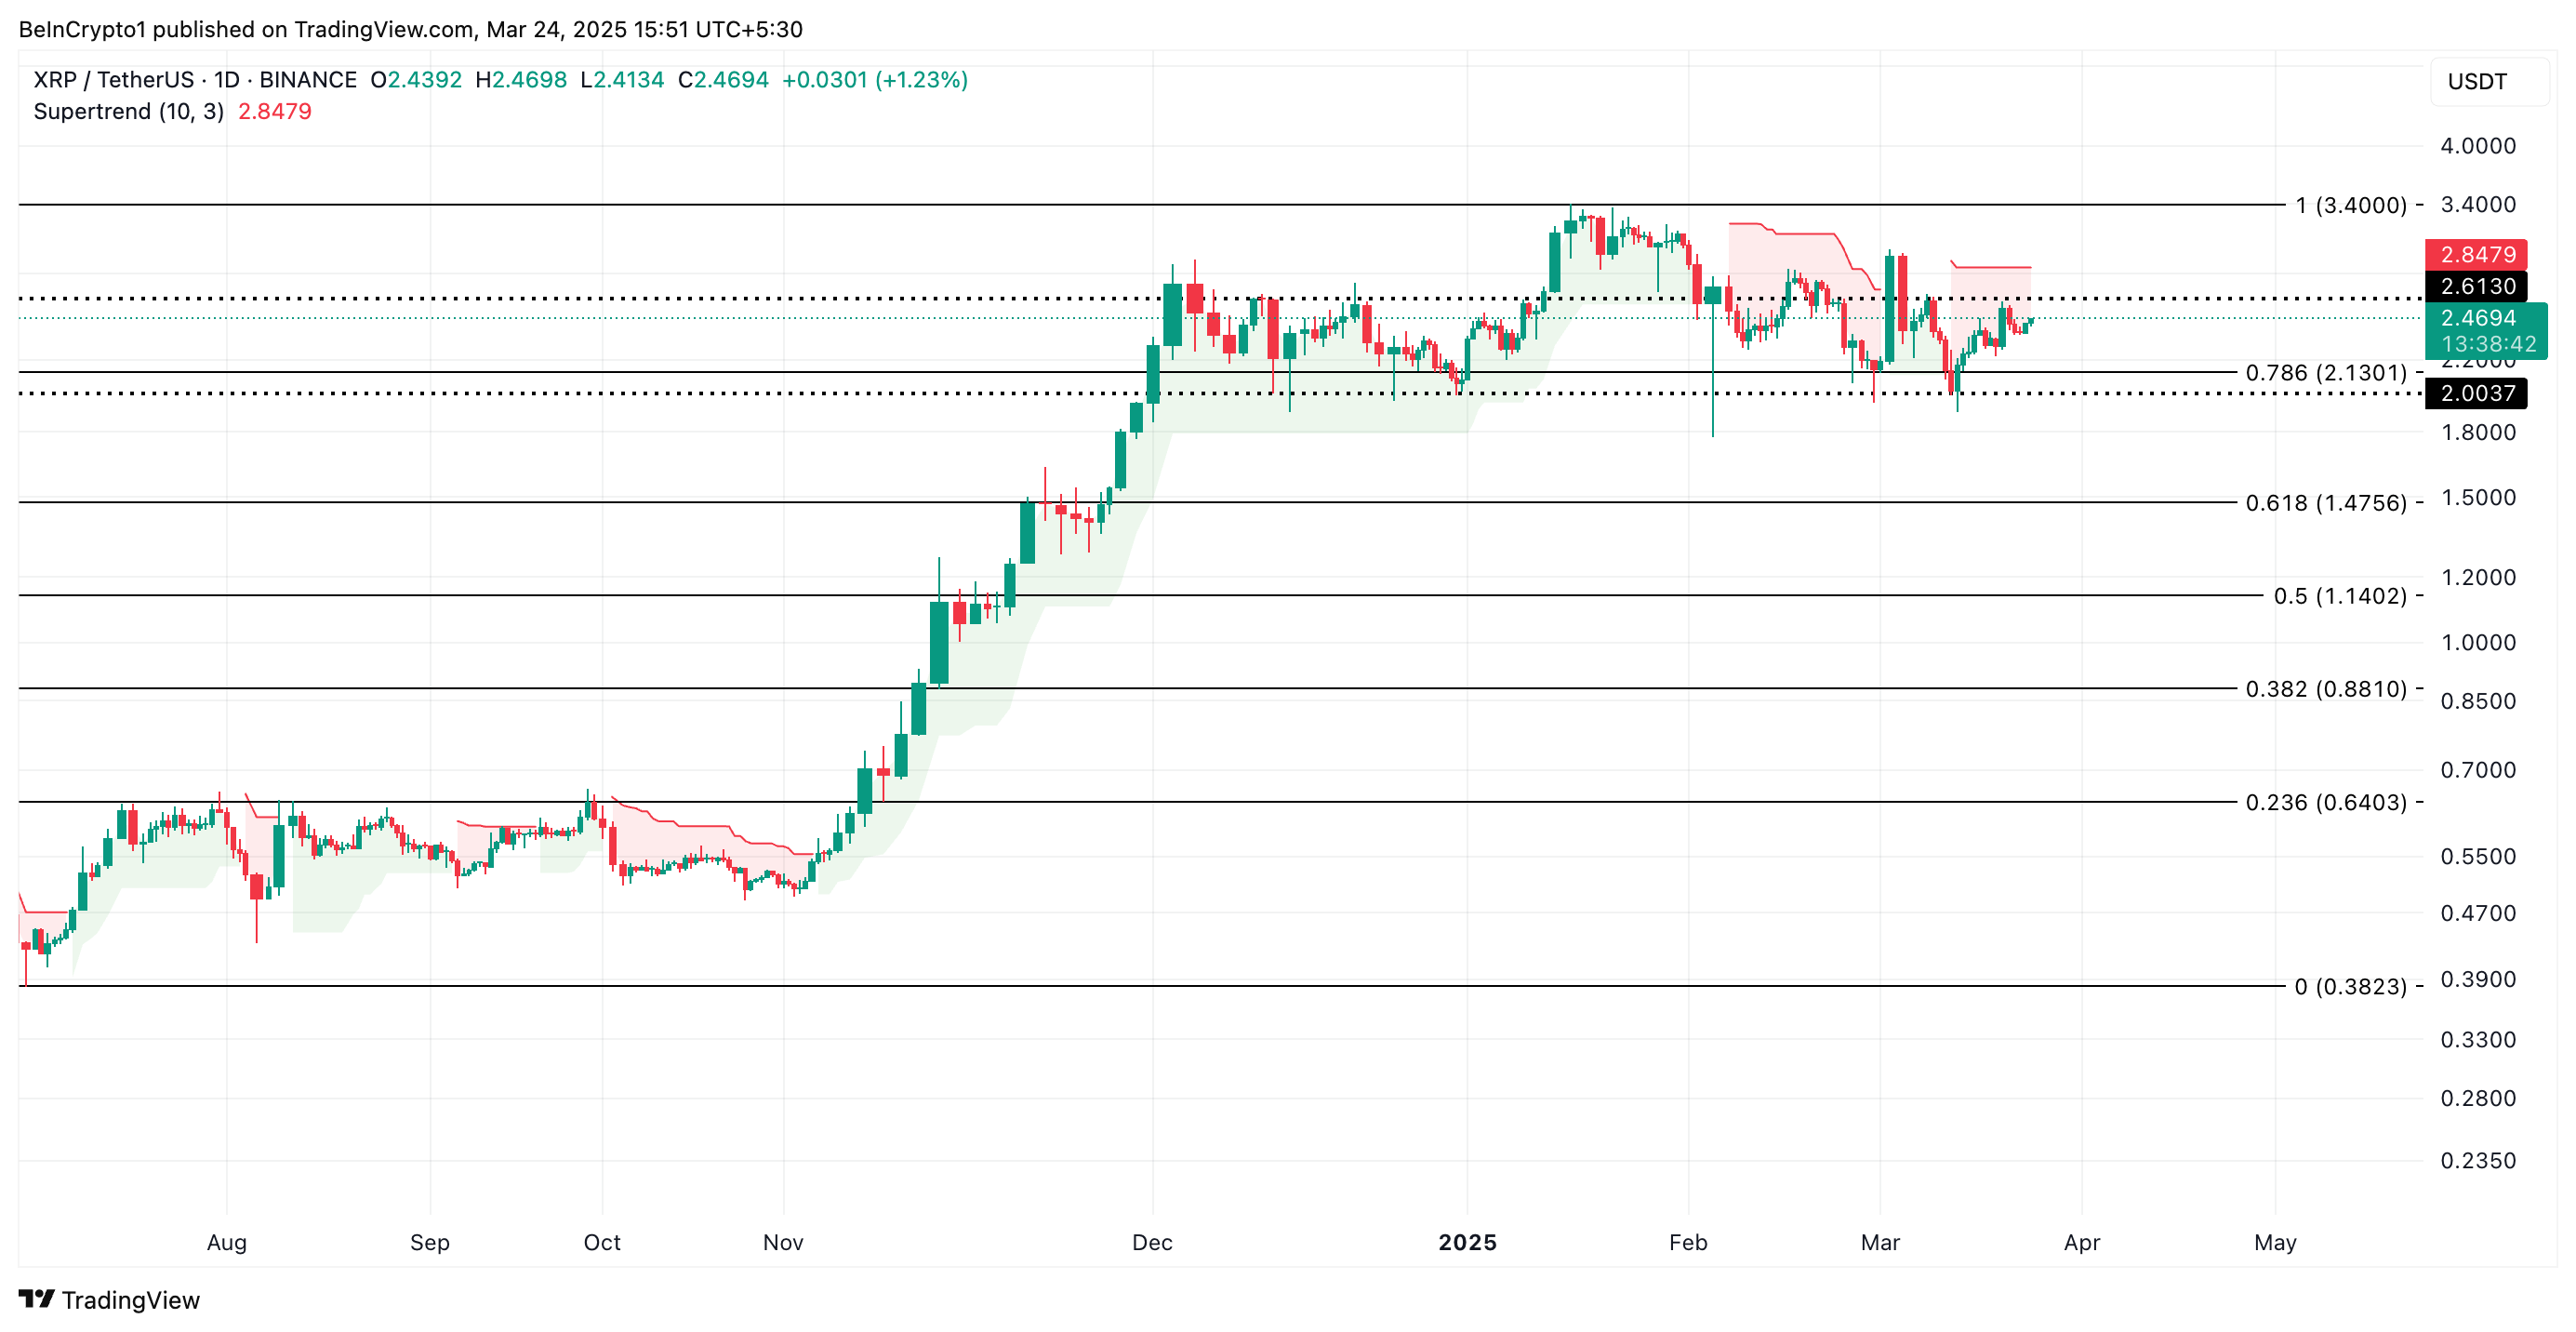
Conversely, if buying activity gains momentum, the altcoin could attempt a break above the resistance at $2.61. If the breach is successful, XRP could climb toward its Super Trend indicator at $2.84.
Disclaimer
In line with the Trust Project guidelines, this price analysis article is for informational purposes only and should not be considered financial or investment advice. BeInCrypto is committed to accurate, unbiased reporting, but market conditions are subject to change without notice. Always conduct your own research and consult with a professional before making any financial decisions. Please note that our Terms and Conditions, Privacy Policy, and Disclaimers have been updated.

Worldcoin Jumps 13% As World Network Eyes VISA Partnership
MicroStrategy’s Bitcoin Holdings Exceed 500,000 BTC

XRP Price Could Suffer April Flash Crash, Analyst Shows How Low It Could Go

XRP Demand Dips as Bearish Trends Set In Post-SEC Lawsuit

Can Tron Compete with Solana?

Crypto Inflows Return with $644 Million Boost, Bitcoin Leads

2.52 Million Altcoins Are Ruining Crypto’s Future

Animoca Brands Valuation Tanks 75% In Two Years, Here’s Why

Crypto exchange BingX hacked for $43 million

Are The Big Players Losing Interest?

Hong Kong’s Securities Association Tips Authorities On Crypto Self-Regulation

Coinbase cbBTC Set to go Live on Solana
2.52 Million Altcoins Are Ruining Crypto’s Future
Animoca Brands Valuation Tanks 75% In Two Years, Here’s Why
Crypto exchange BingX hacked for $43 million
Are The Big Players Losing Interest?
Hong Kong’s Securities Association Tips Authorities On Crypto Self-Regulation
Coinbase cbBTC Set to go Live on Solana
-

 Altcoin20 hours ago
Crypto Tycoon Drops $1 Billion On Private Space Station
-

 Market23 hours ago
Number of New XRP Investors Drop to a 4-Month Low
-

 Ethereum22 hours ago
Time To Buy Ethereum (ETH)? Here’s What This Analyst Thinks
-

 Altcoin19 hours ago
Coinbase CLO Criticizes The US Treasury Over Tornado Cash SDN Delisting Procedure
-

 Ethereum24 hours ago
Ethereum Exchange Reserve Hits New All-Time Low — Bullish For ETH Price?
-
 Bitcoin18 hours ago
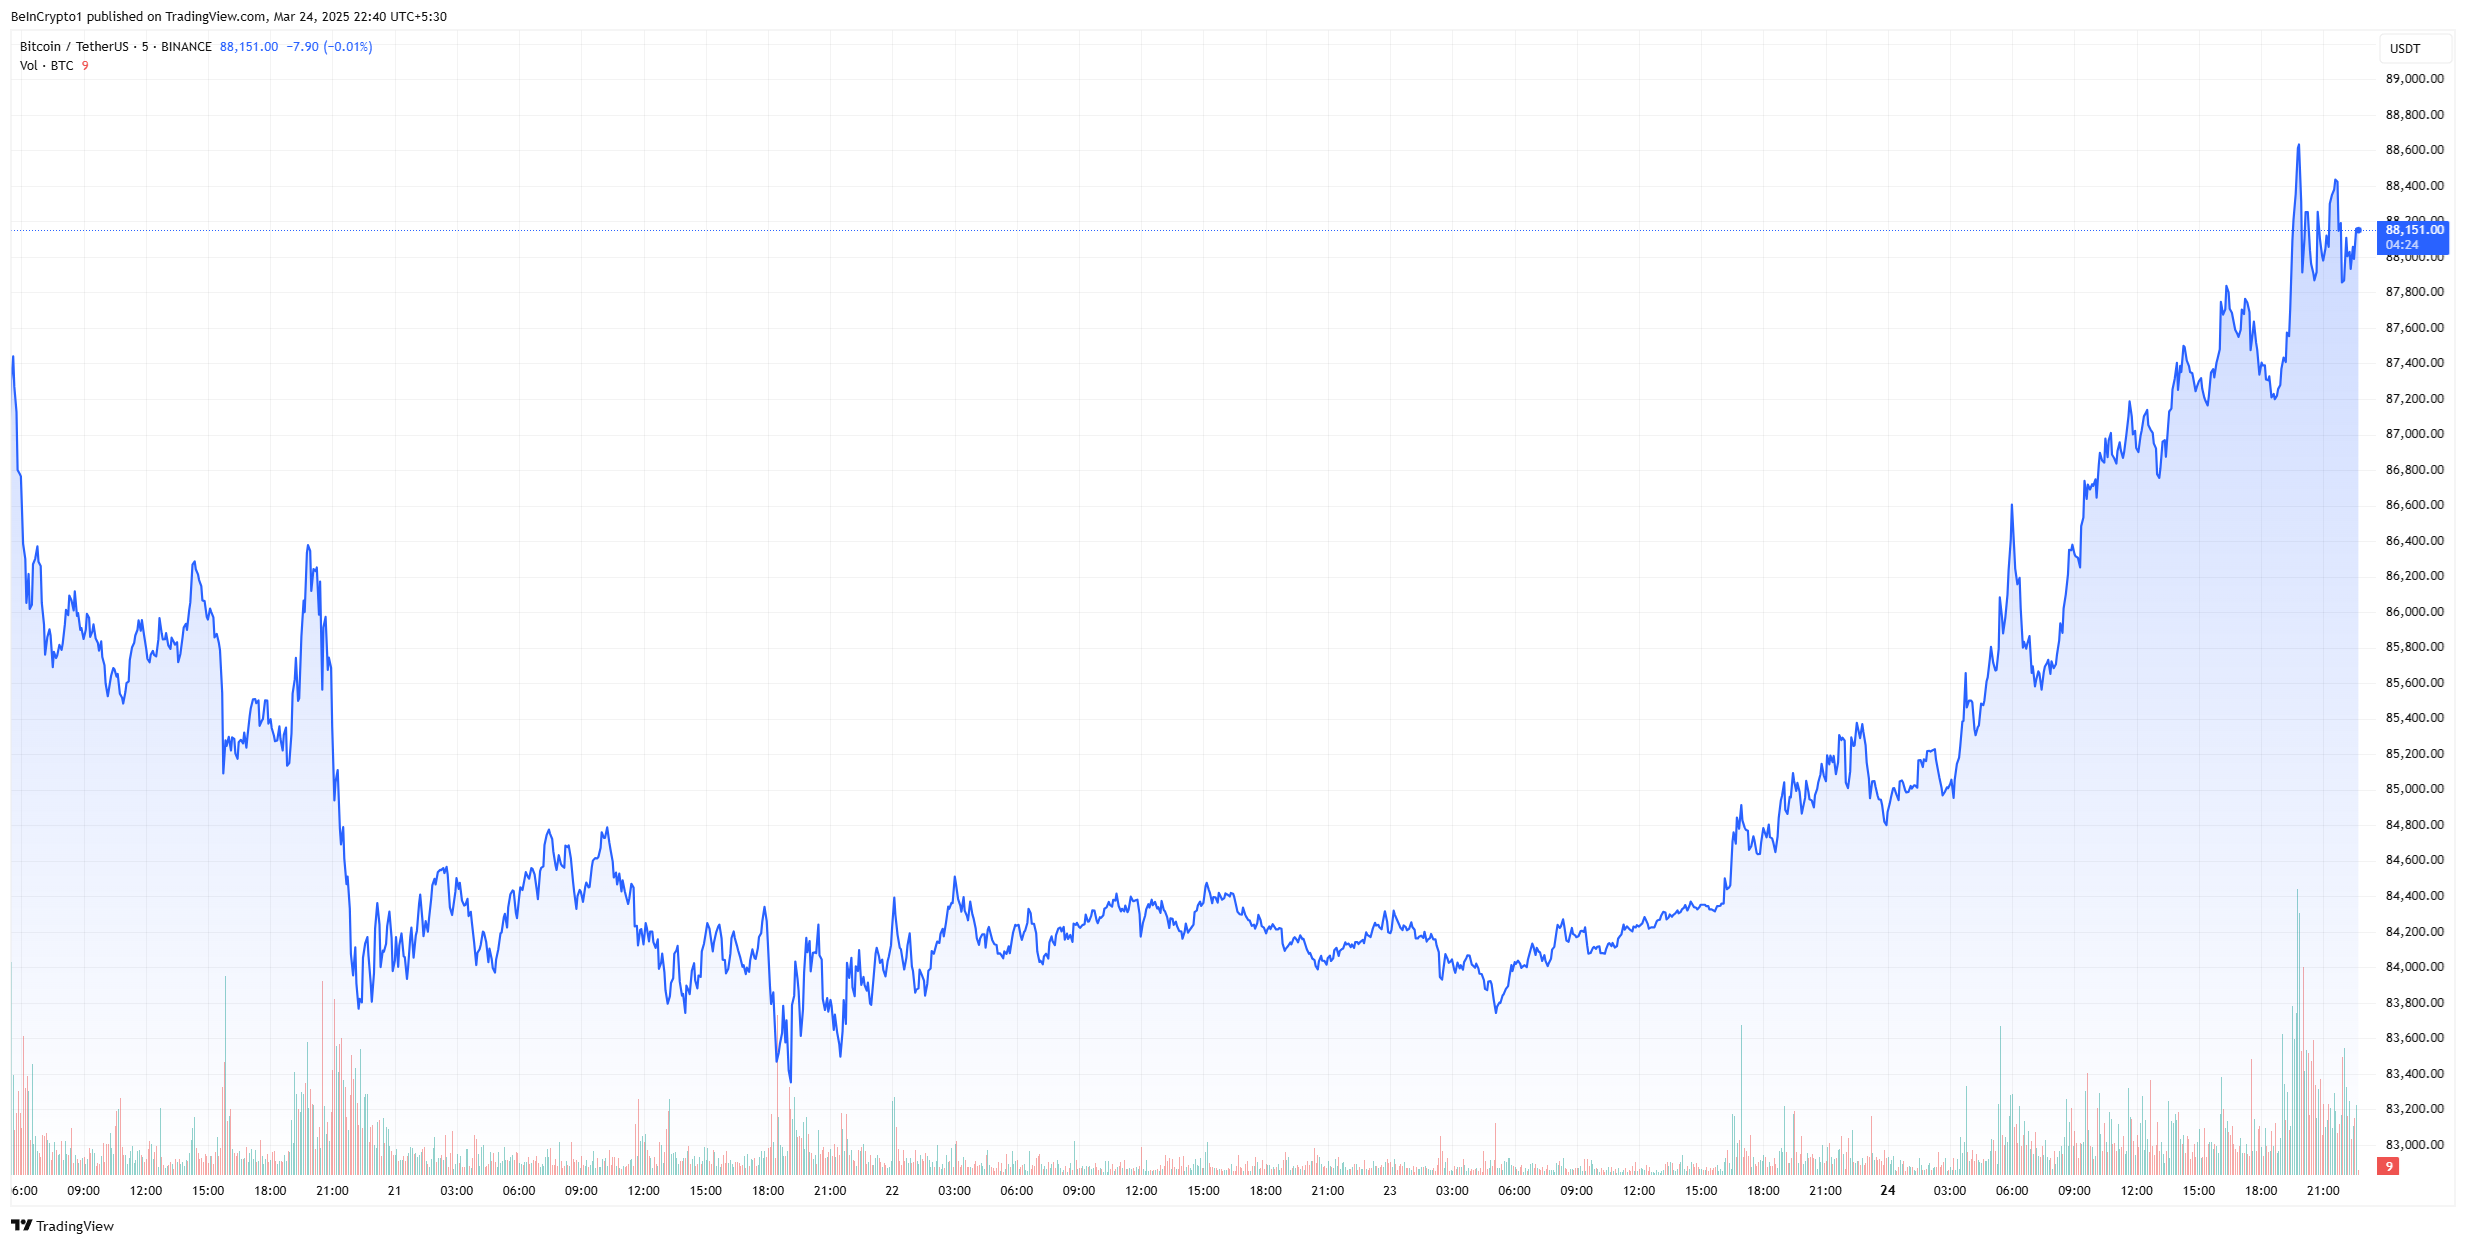
Bitcoin Holds Critical Support At $83,444 As Bulls Target Key Resisitance
-
 Altcoin16 hours ago
Stablecoin Market Cap Hits $220 Billion
-
 Bitcoin9 hours ago
US Economic Data This Week: Key Events Shaping Bitcoin