
Market
Hedera (HBAR) Sellers Are Taking Control Below $0.20
Hedera (HBAR) has been trading below the $0.20 mark for the past week. The persistent downtrend has kept the token under pressure, as both technical indicators and price action suggest a cautious market environment.
Recent signals from both the DMI and Ichimoku Cloud highlight growing bearish sentiment, with sellers starting to gain ground. The question now is whether HBAR can maintain its footing above crucial support or if further downside is on the horizon.
Hedera DMI Shows Buyers Are Still In Control, But Sellers Are Growing
Hedera ADX, which measures trend strength, is currently at 16.15, up from 11.5 yesterday. Earlier today, it briefly reached as high as 17.16. While this is a modest uptick, it indicates that the trend is slowly gaining some momentum.
Alongside this, the +DI line, which tracks bullish pressure, has declined from 26.95 yesterday to 20.27, suggesting weakening buying strength.
On the flip side, the -DI line, representing bearish pressure, has increased from 13.97 to 16.65, indicating that sellers are becoming more active.
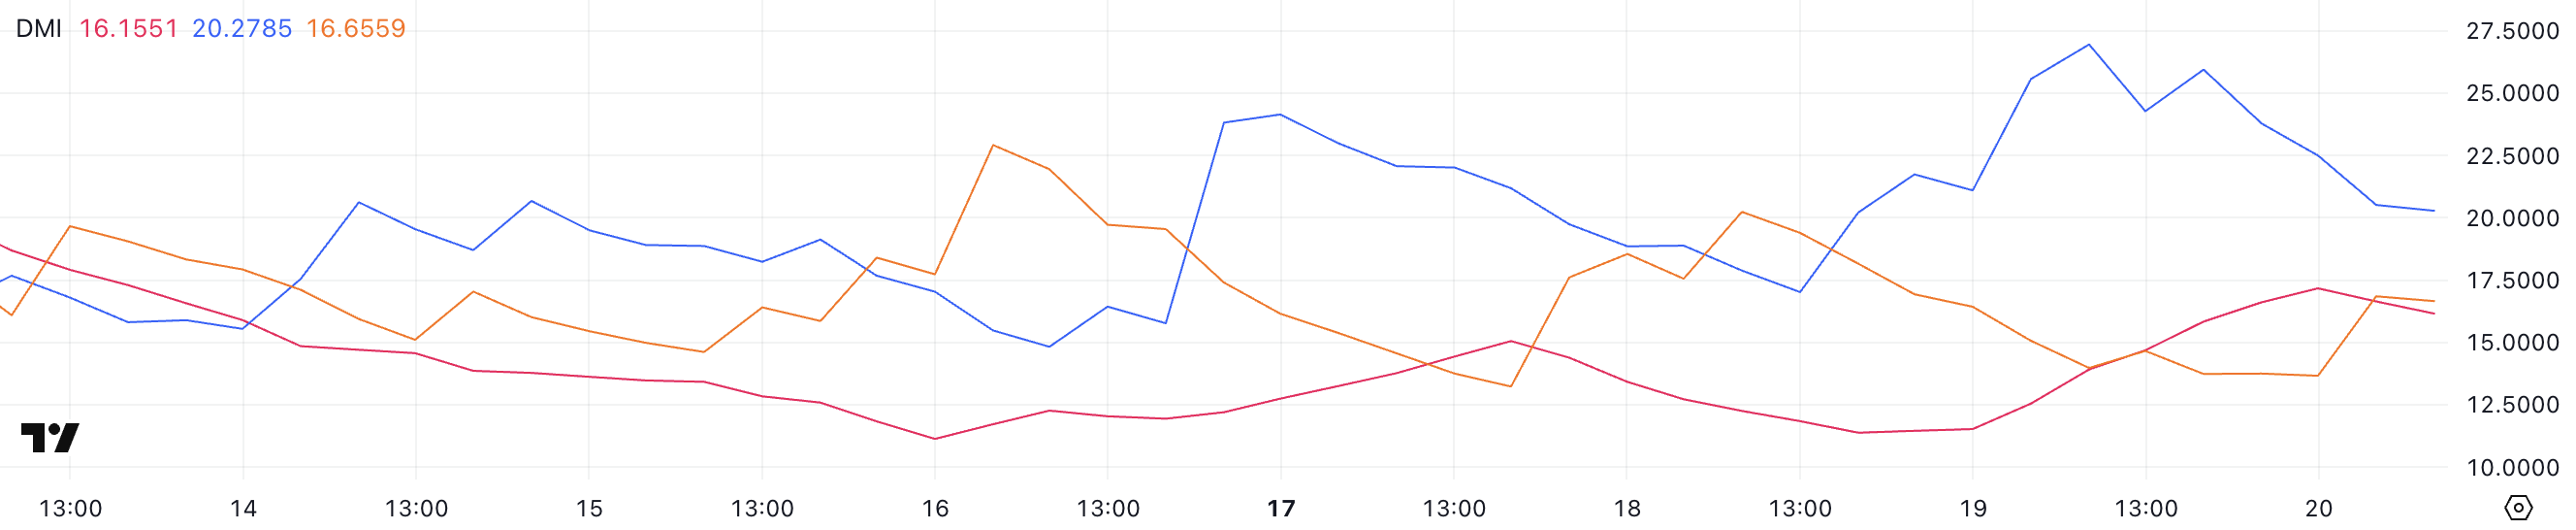
The ADX (Average Directional Index) gauges the strength of a trend regardless of its direction. Typically, an ADX reading below 20 signals a weak or non-existent trend, between 20 and 40 suggests a developing or moderate trend, and above 40 indicates a strong trend.
With Hedera’s ADX still below 20, the trend remains weak, but the recent uptick could hint at strengthening in the near future. However, with +DI declining and -DI rising, this shift suggests that bearish momentum is starting to outweigh bullish forces.
Even though the trend strength is still soft, this pattern could mean that HBAR may continue its downtrend unless buying pressure returns to overpower the sellers.
HBAR Ichimoku Cloud Shows a Bearish Setup After Key Resistance Wasn’t Broken
The Ichimoku Cloud chart for Hedera shows that the price is still struggling below the Kumo (cloud), which reinforces the prevailing bearish trend.
The price is currently trading just under both the Tenkan-sen (conversion line) and the Kijun-sen (base line). This suggests a lack of bullish momentum and confirms indecision in the short term.
The cloud ahead is red and thick, indicating strong overhead resistance. Until the price can decisively break above this resistance area, the bearish bias is likely to persist.
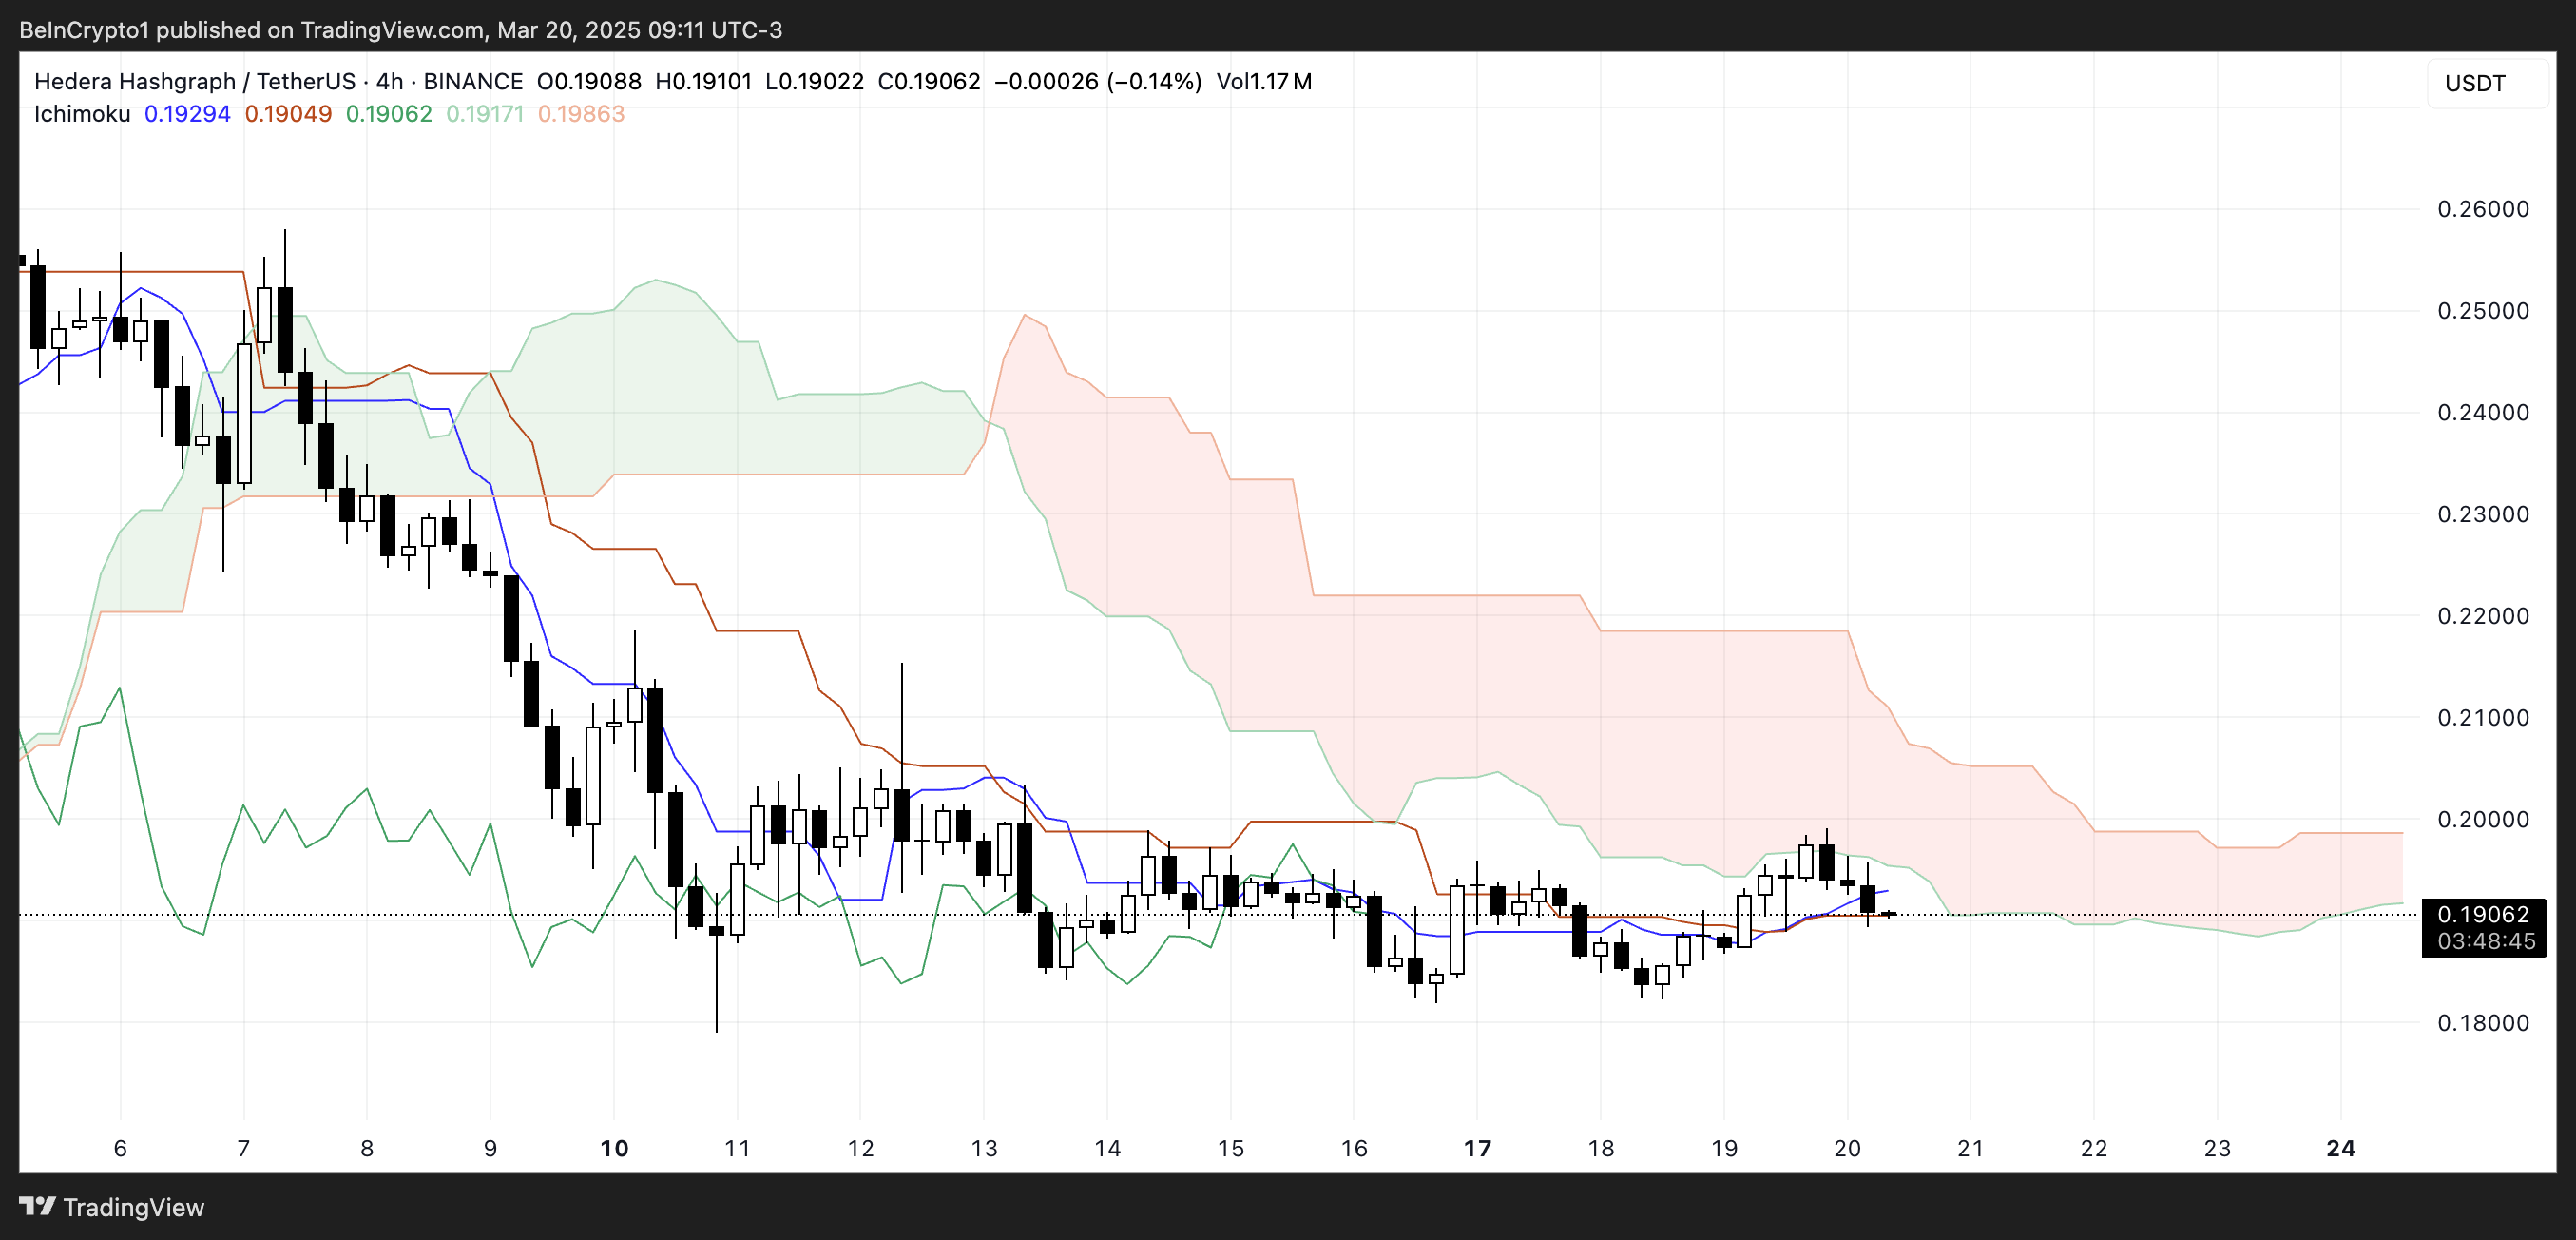
The Ichimoku Cloud system provides a holistic view of support, resistance, trend direction, and momentum. When the price is below the cloud, as HBAR is now, the asset is considered to be in a downtrend.
The Tenkan-sen and Kijun-sen lines provide shorter-term signals. The Tenkan-sen’s slight below the Kijun-sen is a subtle bearish signal, though their proximity also reflects a weak trend and potential consolidation.
Given that the price is below both lines and the cloud is acting as resistance above, HBAR is likely to remain under pressure in the short term unless buying volume increases enough to push it back above the cloud and trigger a trend reversal.
Can Hedera Fall Below $0.17 Soon?
Hedera price is currently trading within a tight range, caught between a resistance level at $0.195 and a key support level at $0.184.
The price action suggests that if the $0.184 support is retested and fails to hold, HBAR could quickly move lower to test the next significant support at $0.178.
A loss of that level could open the door for further downside, potentially driving the price below $0.17.
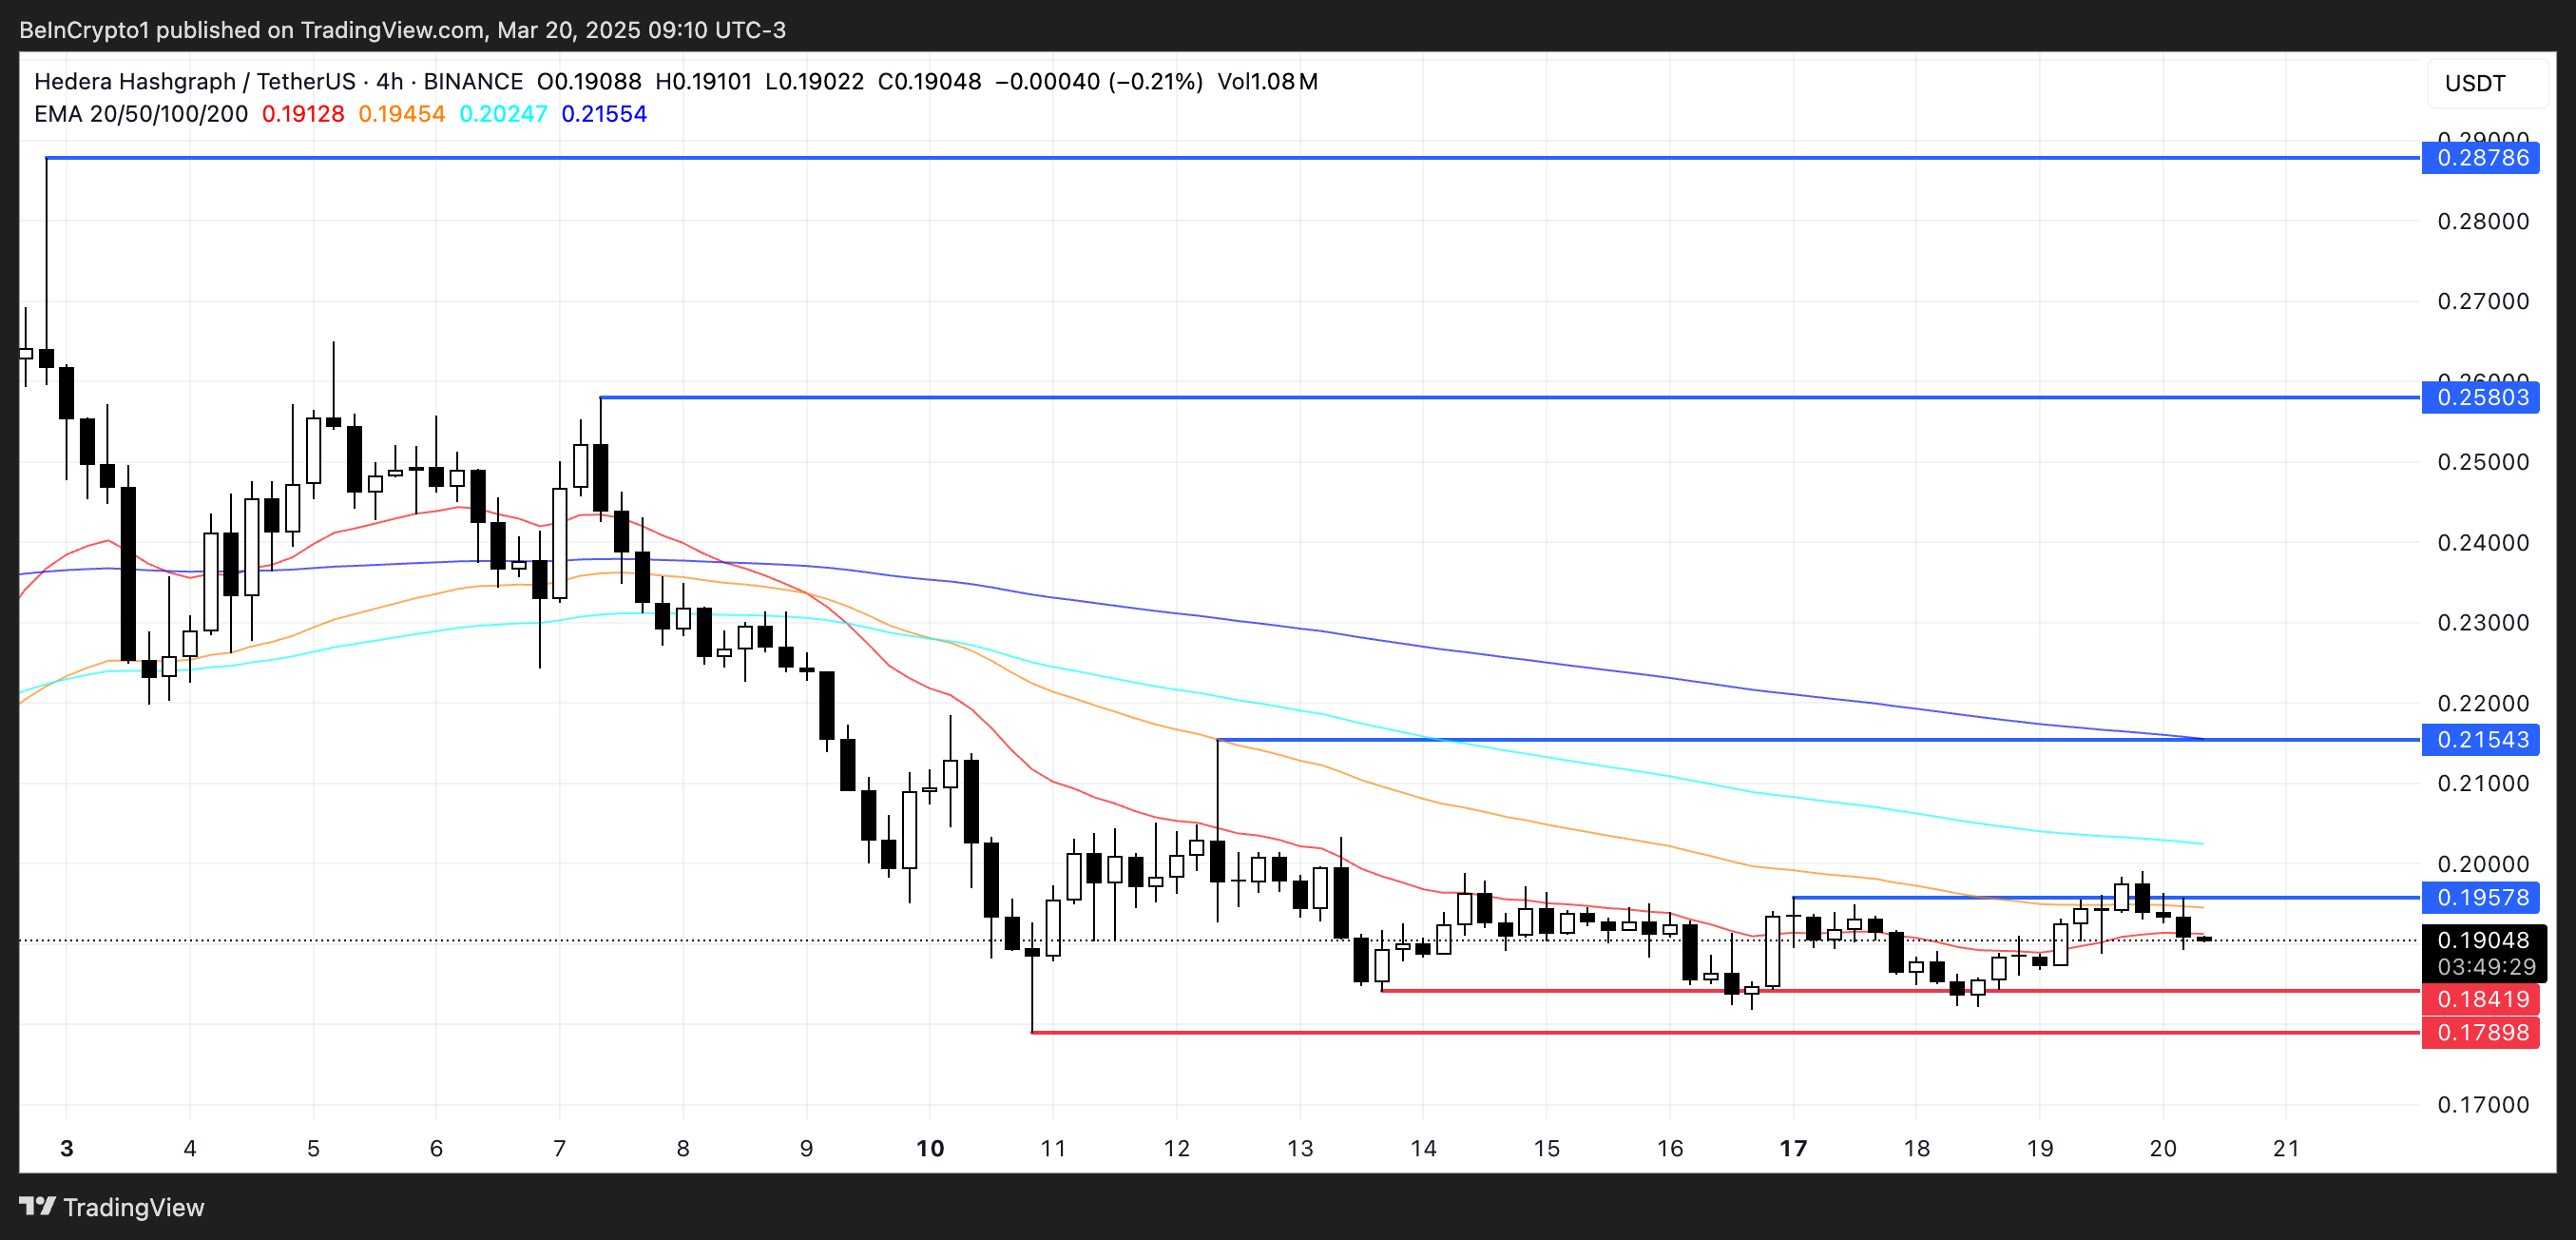
However, if HBAR manages to reverse this downtrend, the first hurdle will be the $0.195 resistance—an area it attempted to break above yesterday but failed.
A successful breakout above $0.195 could shift the momentum back in favor of the bulls and potentially trigger a move toward the next resistance at $0.21.
If bullish momentum strengthens beyond that, the price could target higher levels at $0.258 and $0.287, with a possible retest of $0.30 – the level HBAR hasn’t touched since January 31.
Disclaimer
In line with the Trust Project guidelines, this price analysis article is for informational purposes only and should not be considered financial or investment advice. BeInCrypto is committed to accurate, unbiased reporting, but market conditions are subject to change without notice. Always conduct your own research and consult with a professional before making any financial decisions. Please note that our Terms and Conditions, Privacy Policy, and Disclaimers have been updated.


RSS3, JAM, and ALI are the top-performing AI coins of the third week of March 2025. RSS3 and JAM have both surged 78% in the past seven days, while ALI is up 48%.
Combined, they stand out for their strong price action and growing market caps. Here’s a breakdown of why these AI coins are making headlines this week.
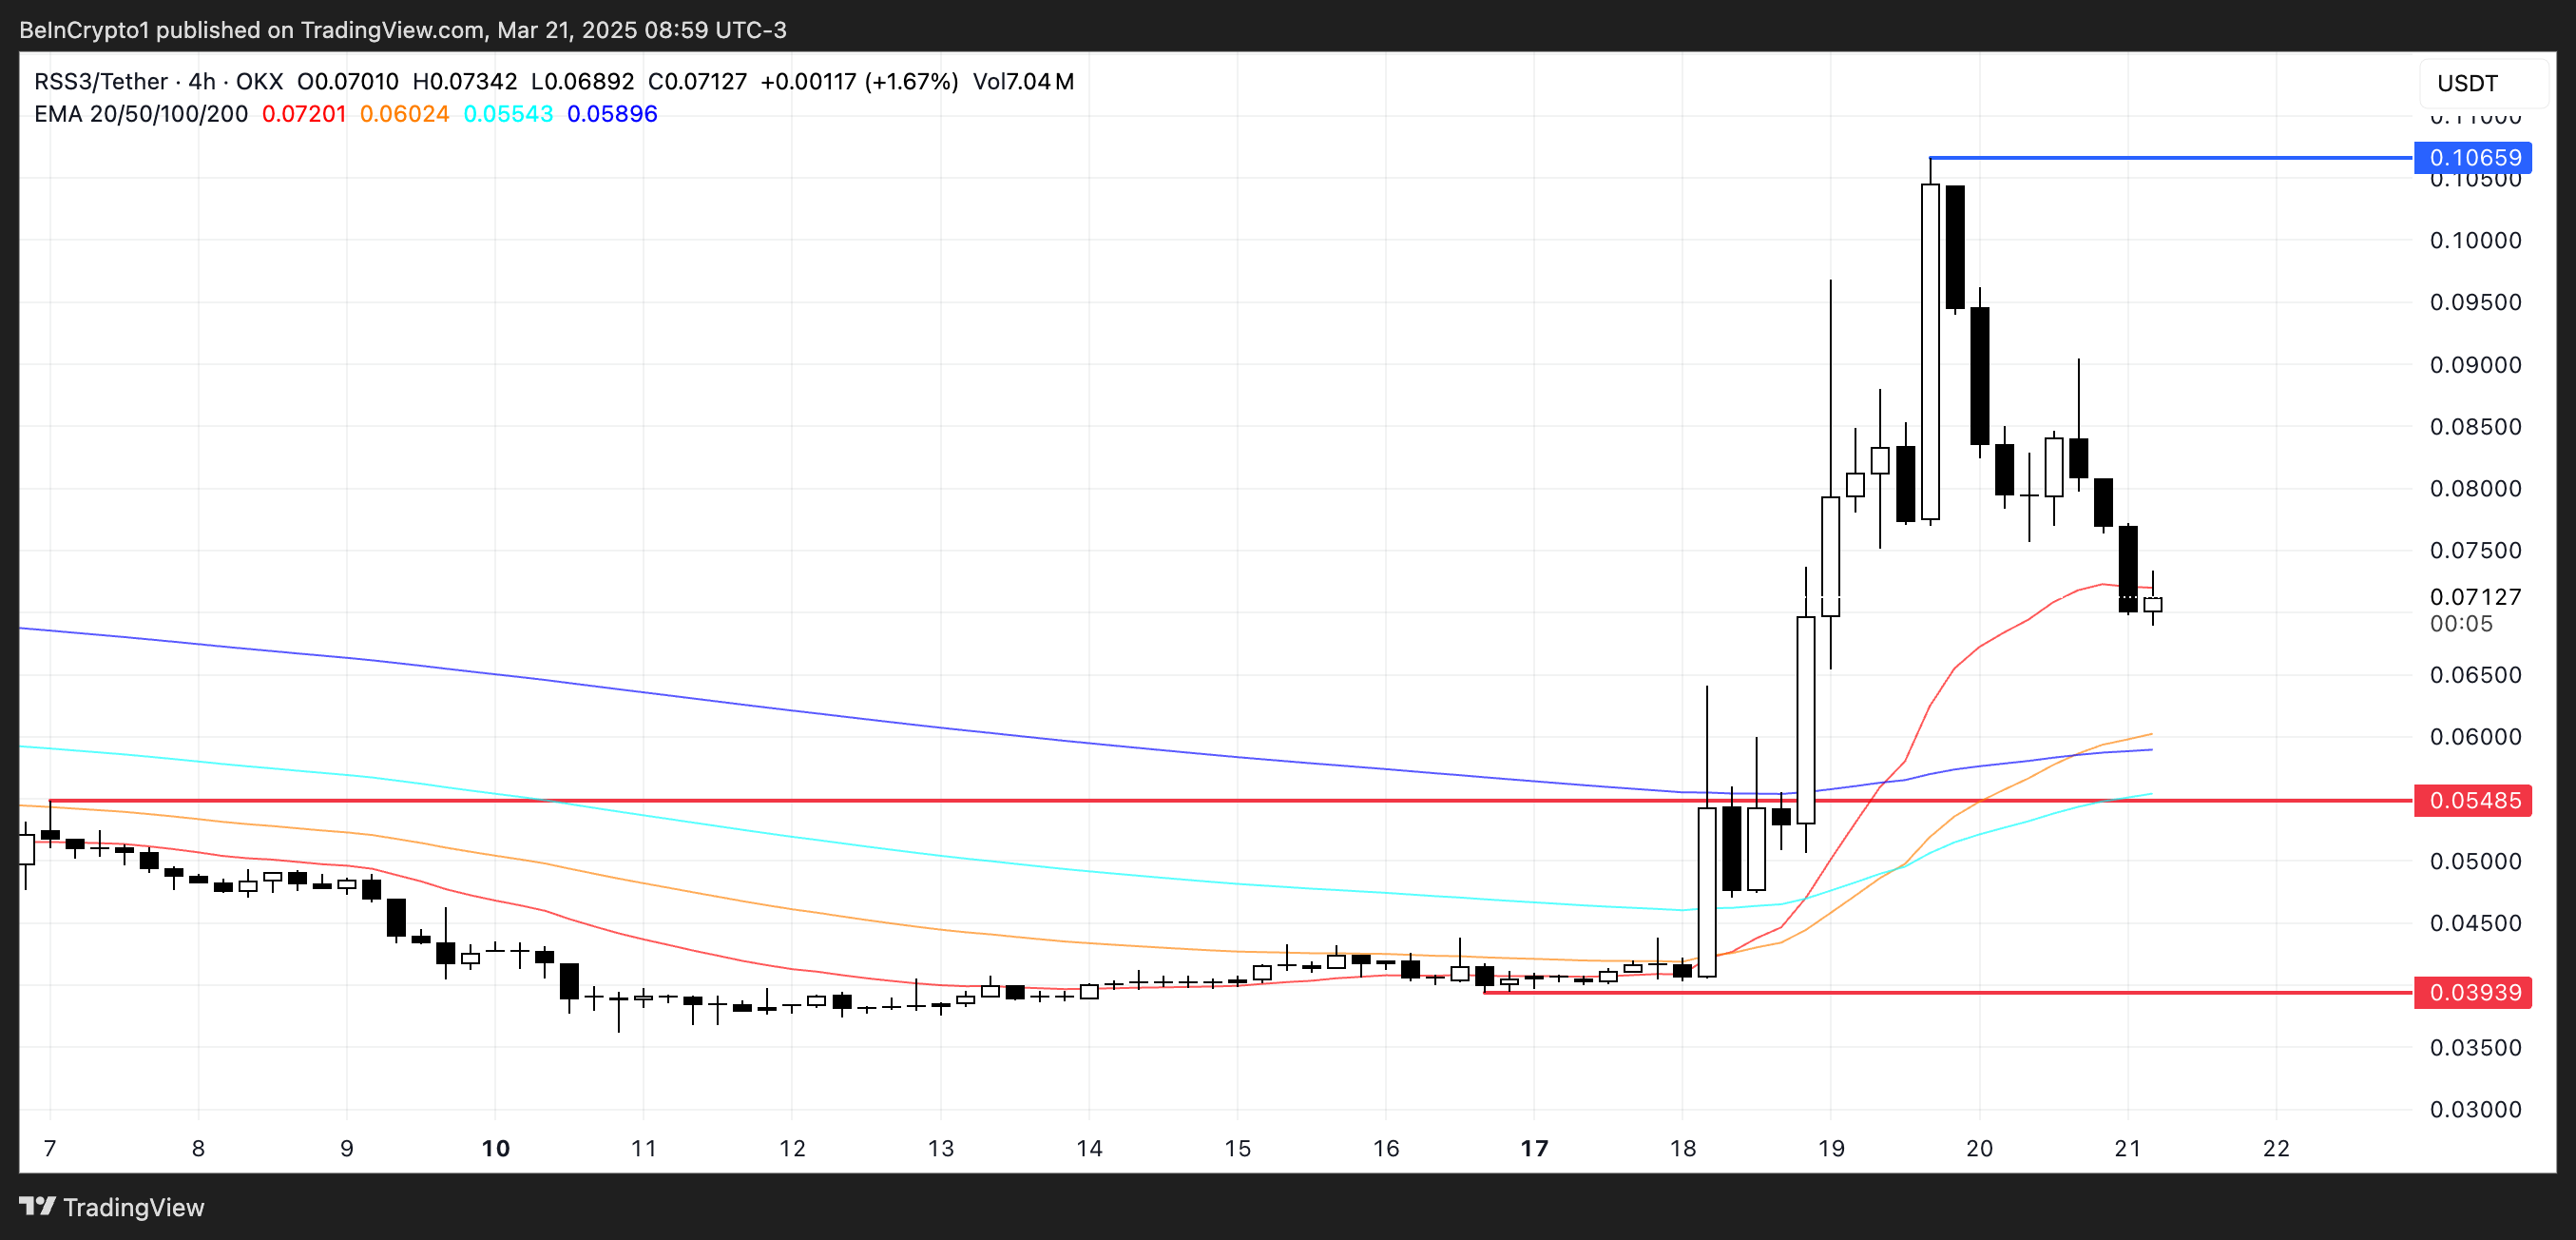
RSS3 has surged over 78% in the past week, pushing its market cap to $51 million.
The strong rally has made it one of the top performers among AI coins, despite the general correction in that sector.
RSS3 is a decentralized network that indexes and structures open information. Inspired by the original RSS, it supports the Open Information Initiative, aiming to power the Open Web and open artificial intelligence.
If momentum continues, RSS3 could retest resistance at $0.106, possibly reaching $0.11 for the first time since January 17. If momentum fades, support sits at $0.054, with further downside risk to $0.039.
JAM
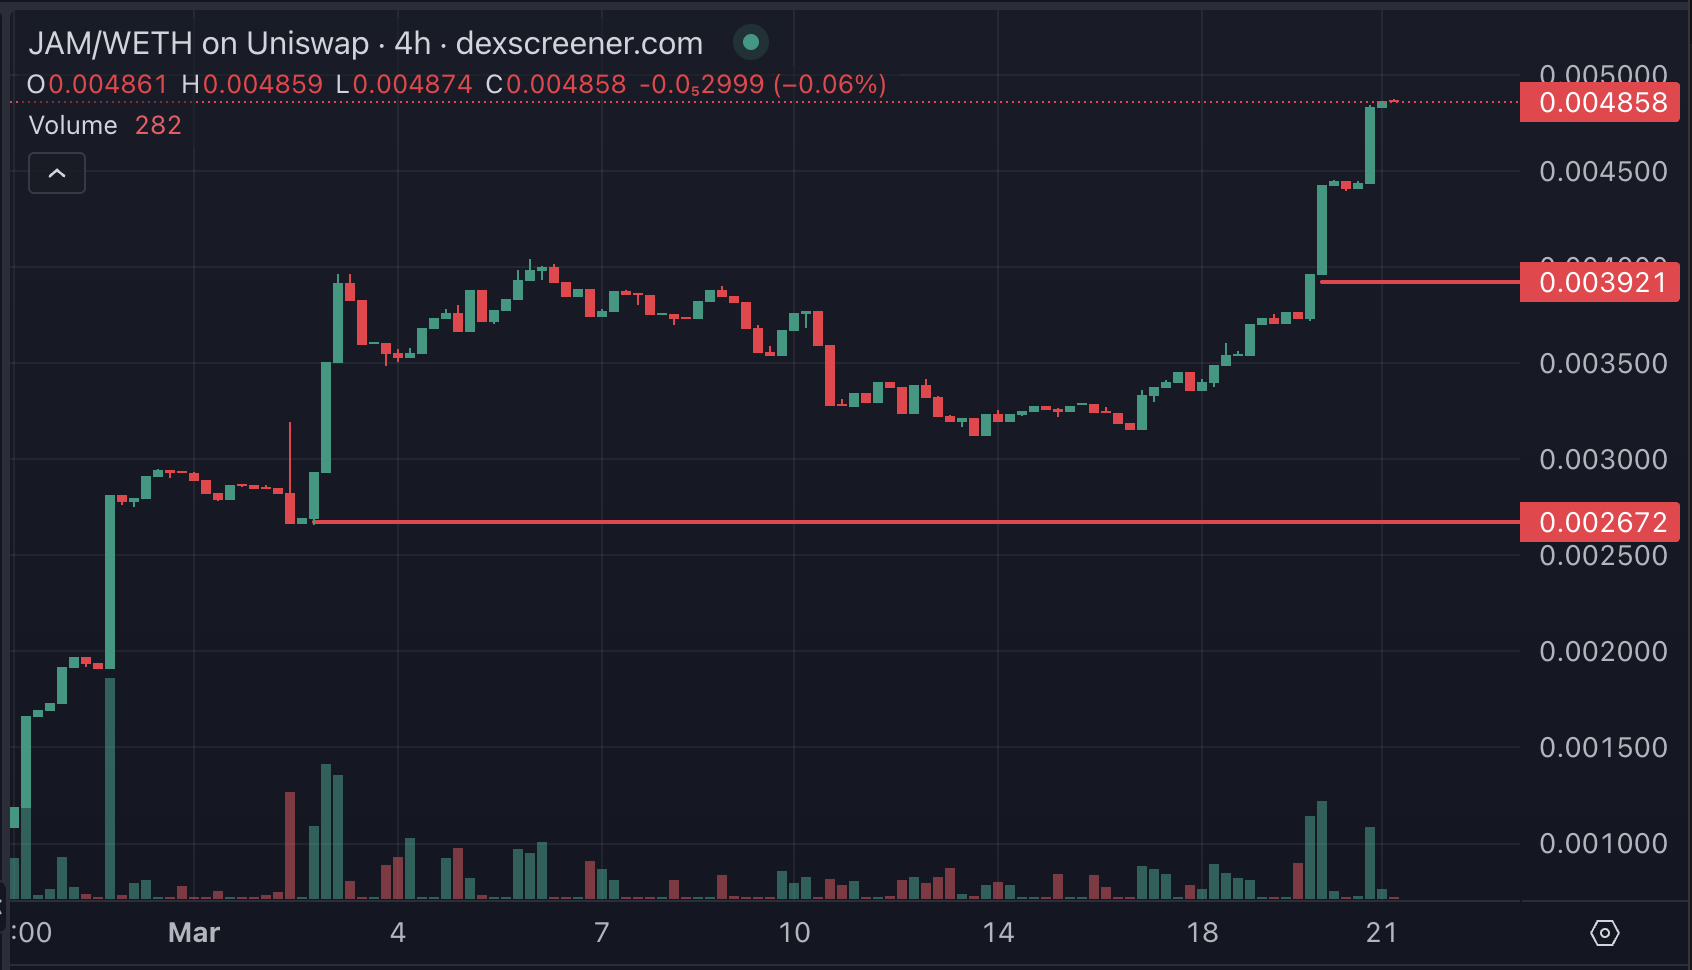
JAM is one of the hottest AI coins on the Base network. It has soared 78% over the past week and reached a market cap of $18 million.
JAM powers JamAI, a platform where users can create AI agents with unique personalities. It combines elements of an AI agents platform and a crypto launchpad, with roots as a creator community on Farcaster.
JAM has been setting fresh all-time highs, and if momentum holds, it could break above $0.0050 and aim for $0.0075. If momentum fades, key support levels sit at $0.0039 and $0.0026.
Artificial Liquid Intelligence (ALI)
Artificial Liquid Intelligence is driving several AI-focused crypto projects, including the AI Protocol, which builds a decentralized infrastructure for tokenized AI systems.
The company is also behind Alethea AI and its on-chain agentic AI characters, blending AI with blockchain to create interactive digital personas. Additionally, its ALI Agents Beta is set to launch soon, featuring staking, rewards, and upgraded AI functions.
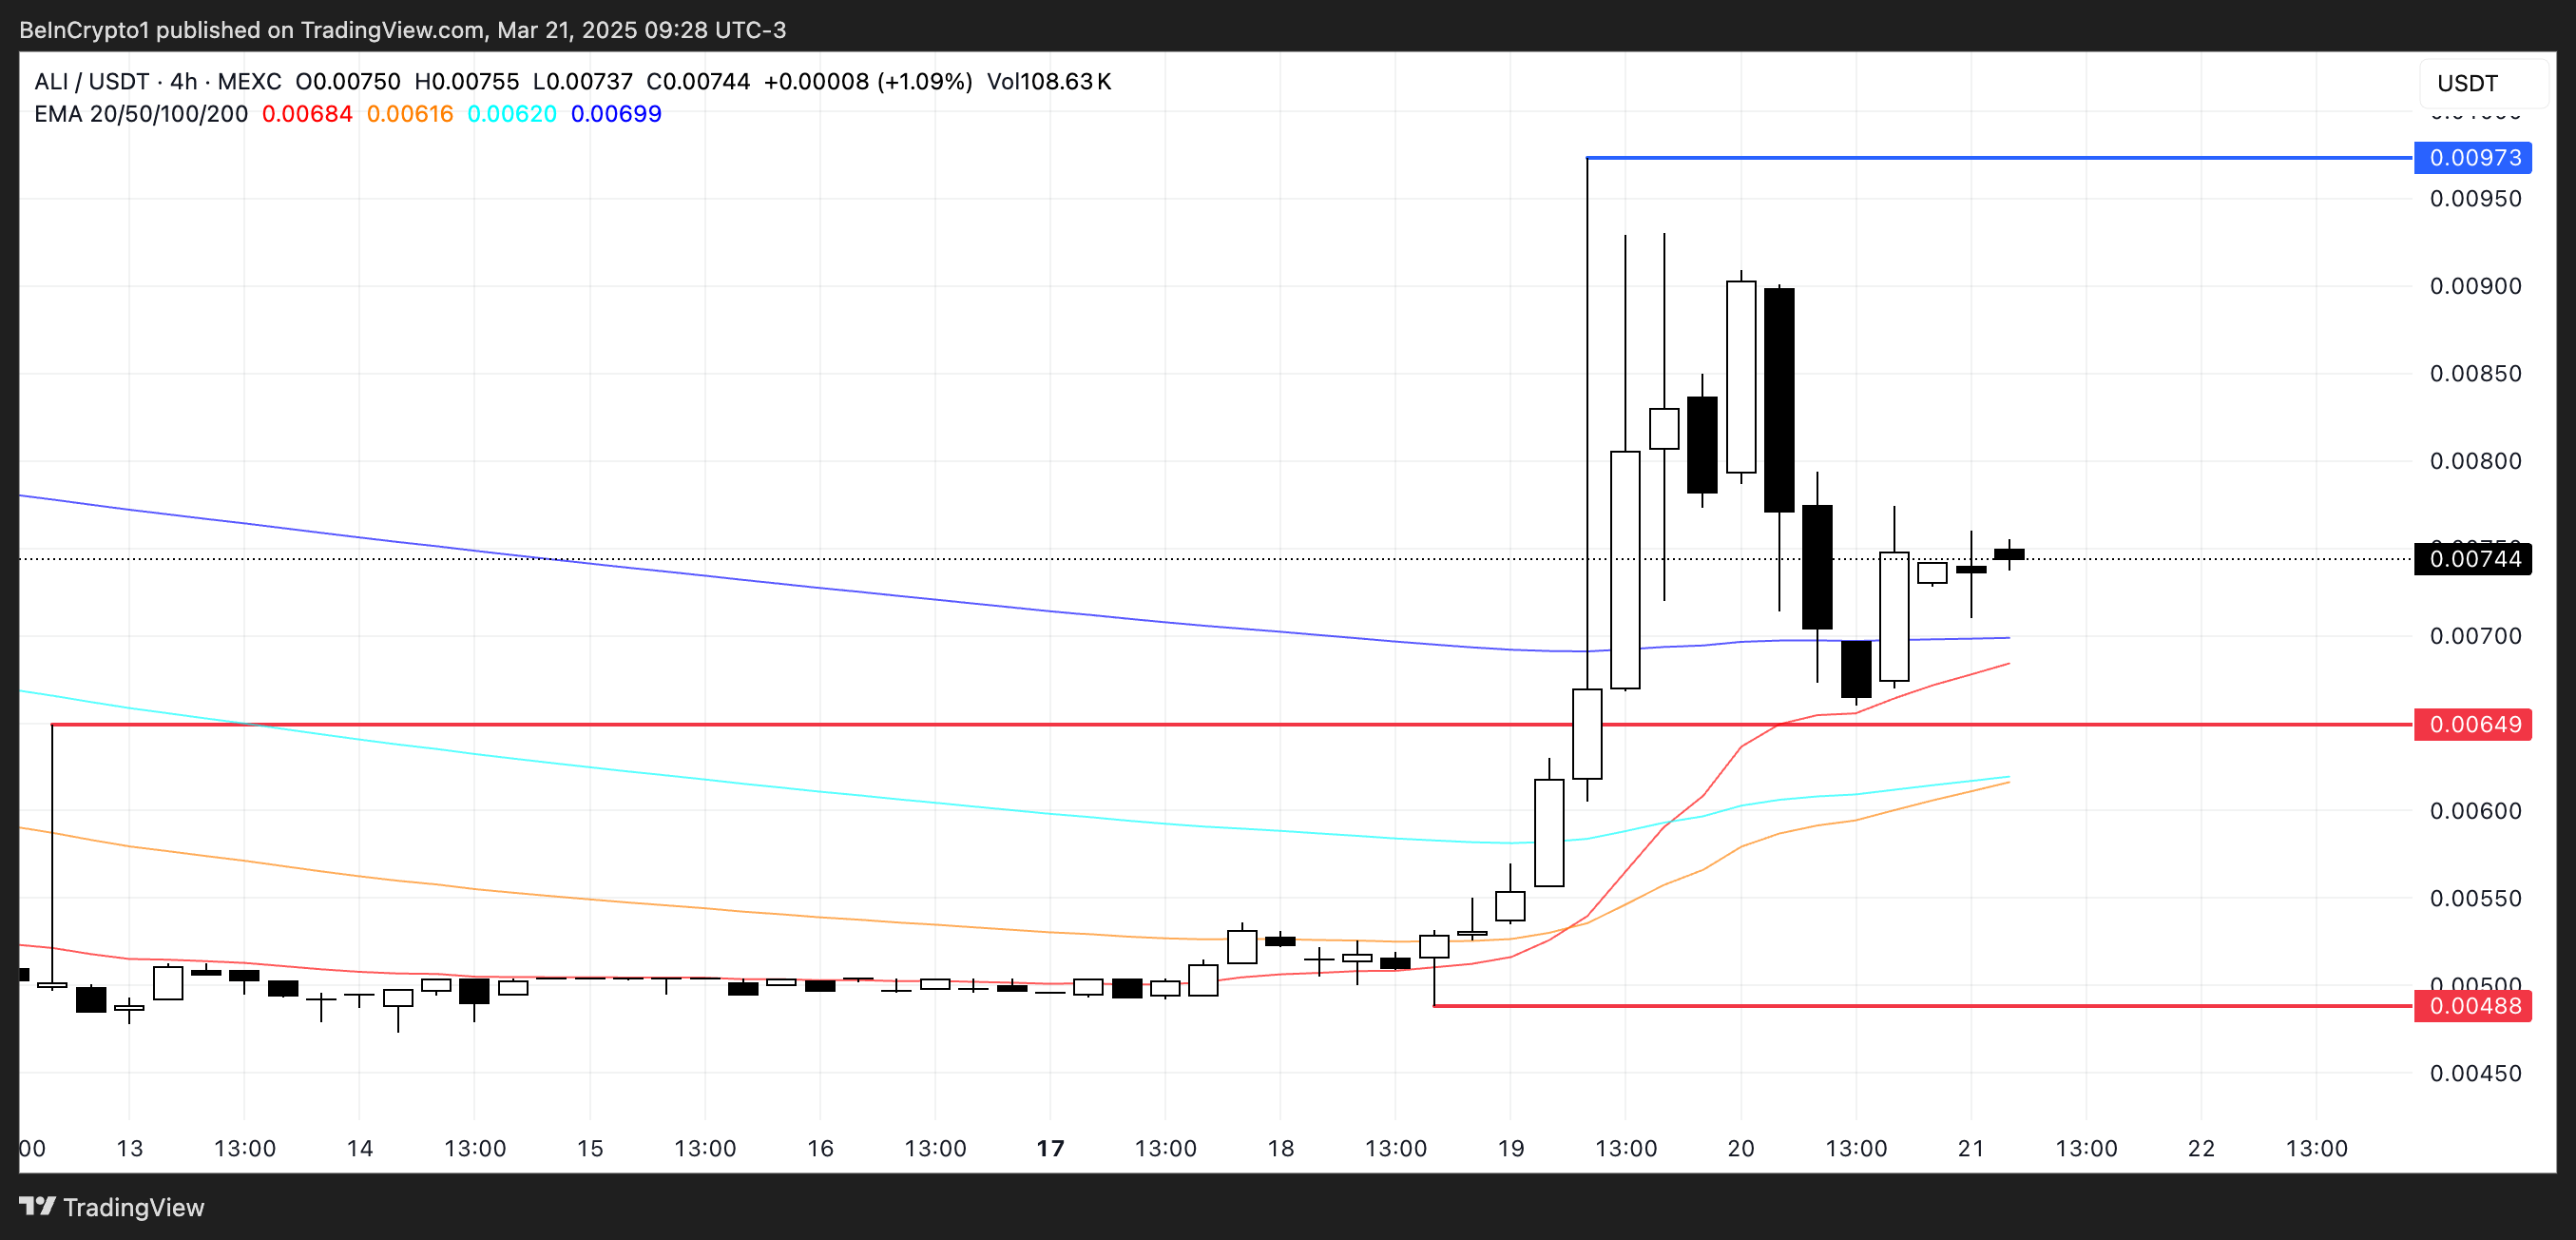
ALI has gained over 48% in the past week, making it one of the best-performing crypto AI agents coins.
If momentum continues, ALI could push toward $0.0097, with a chance to break above $0.010. However, if a pullback occurs, support levels sit at $0.0064 and $0.0048.
Disclaimer
In line with the Trust Project guidelines, this price analysis article is for informational purposes only and should not be considered financial or investment advice. BeInCrypto is committed to accurate, unbiased reporting, but market conditions are subject to change without notice. Always conduct your own research and consult with a professional before making any financial decisions. Please note that our Terms and Conditions, Privacy Policy, and Disclaimers have been updated.

Reason to trust
![]()
Strict editorial policy that focuses on accuracy, relevance, and impartiality
Created by industry experts and meticulously reviewed
The highest standards in reporting and publishing
Strict editorial policy that focuses on accuracy, relevance, and impartiality
Morbi pretium leo et nisl aliquam mollis. Quisque arcu lorem, ultricies quis pellentesque nec, ullamcorper eu odio.
A crypto analyst has predicted that the XRP price could hit $27 soon. He describes the cryptocurrency’s current price action as a “ Bermuda Triangle or boredom phase” — a period where the market moves slowly or sideways, fuelling doubt and uncertainty among traders and investors before a price rally.
XRP Price Boredom Phase To Trigger $27 Surge
Crypto analyst Egrag Crypto has warned that the XRP price is in a Bermuda Triangle, a boredom phase characterized by price stagnation and market uncertainty designed to shake out weak hands before a significant price move. According to his prediction, while traders and investors are growing impatient and questioning why XRP has not experienced any notable price increases, this phase is merely a set-up for a strong rally toward $27.
Related Reading
Following a predicted downturn in mid-March, XRP has struggled to recover its bullish momentum. The cryptocurrency was one of the top-performing altcoins in this bull cycle, jumping from a $0.5 low to over $3 for the first time in seven years.
Due to the current market decline, Egrag Crypto revealed that many traders are now wondering why “XRP hasn’t mooned.” The analyst explained that this price decline was intentional, forcing investors to second-guess themselves and make emotional trading decisions.
He also disclosed that the XRP market is now filled with ‘What ifs’, as Fear, Uncertainty, and Doubt (FUD) cloud traders’ minds. Moreover, concerns over potential dips to $1.60 or $1.30 could push investors to panic-sell or attempt risky trades.
The analyst also revealed that the XRP market is currently controlled by sharks and larger players, also called Whales. These large holders tend to influence price movements, triggering stop-losses and shaking out weak hands before a major rally.
Egrag Crypto warns that new investors and traders are especially vulnerable, as frustration and boredom can lead to making financial mistakes. He disclosed that the best strategy to implement during this current market phase is to do nothing. He suggested investors stay disciplined and patient, recognizing that boredom phases are normal in crypto market cycles.
The analyst also urged investors to remain vigilant and hold their positions while accumulating at ideal prices rather than react impulsively to rapid changes in the market.
XRP Breakout Point Hints At New ATH
In other analyses, market expert ‘Steph Is Crypto’ has announced that XRP is currently retesting breakout levels to trigger a surge to a fresh ATH. The analyst’s price chart shows a Falling Wedge pattern which has been broken above the resistance at the upper trend line.
Related Reading
After breaking out, XRP now retests this level to confirm a larger upward move. The large green arrow on the chart points to the cryptocurrency’s projected price target, suggesting a bullish continuation if the Falling Wedge breakout holds.

XRP’s upside potential is predicted to be $4 or higher if its bullish momentum is maintained. As of writing, the cryptocurrency is trading at $2.4, reflecting a 3.5% decline in the last 24 hours, according to CoinMarketCap. If its price rises to $4, it would represent a significant 66.7% increase from current levels.
Featured image from Unsplash, chart from Tradingview.com

Pi Network (PI) dropped by another 9% on Friday, adding to its recent bearish momentum. The decline comes after Justin Bons called the project a potential “scam,” fueling negative sentiment.
Technical indicators like BBTrend and RSI are also pointing to sustained downside pressure. As the price struggles below $1, traders are watching to see if PI can stabilize or if further losses are ahead.
Pi Network BBTrend Reached Its Lowest Levels Ever
Pi Network’s BBTrend is currently at -40.69, marking its lowest reading on record and staying negative for the past five days. T
The BBTrend, or Bollinger Band Trend, is an indicator that measures trend direction and strength based on price movement relative to Bollinger Bands.
Positive values typically indicate bullish momentum, while negative values suggest bearish momentum, with extreme values often signaling strong trends.
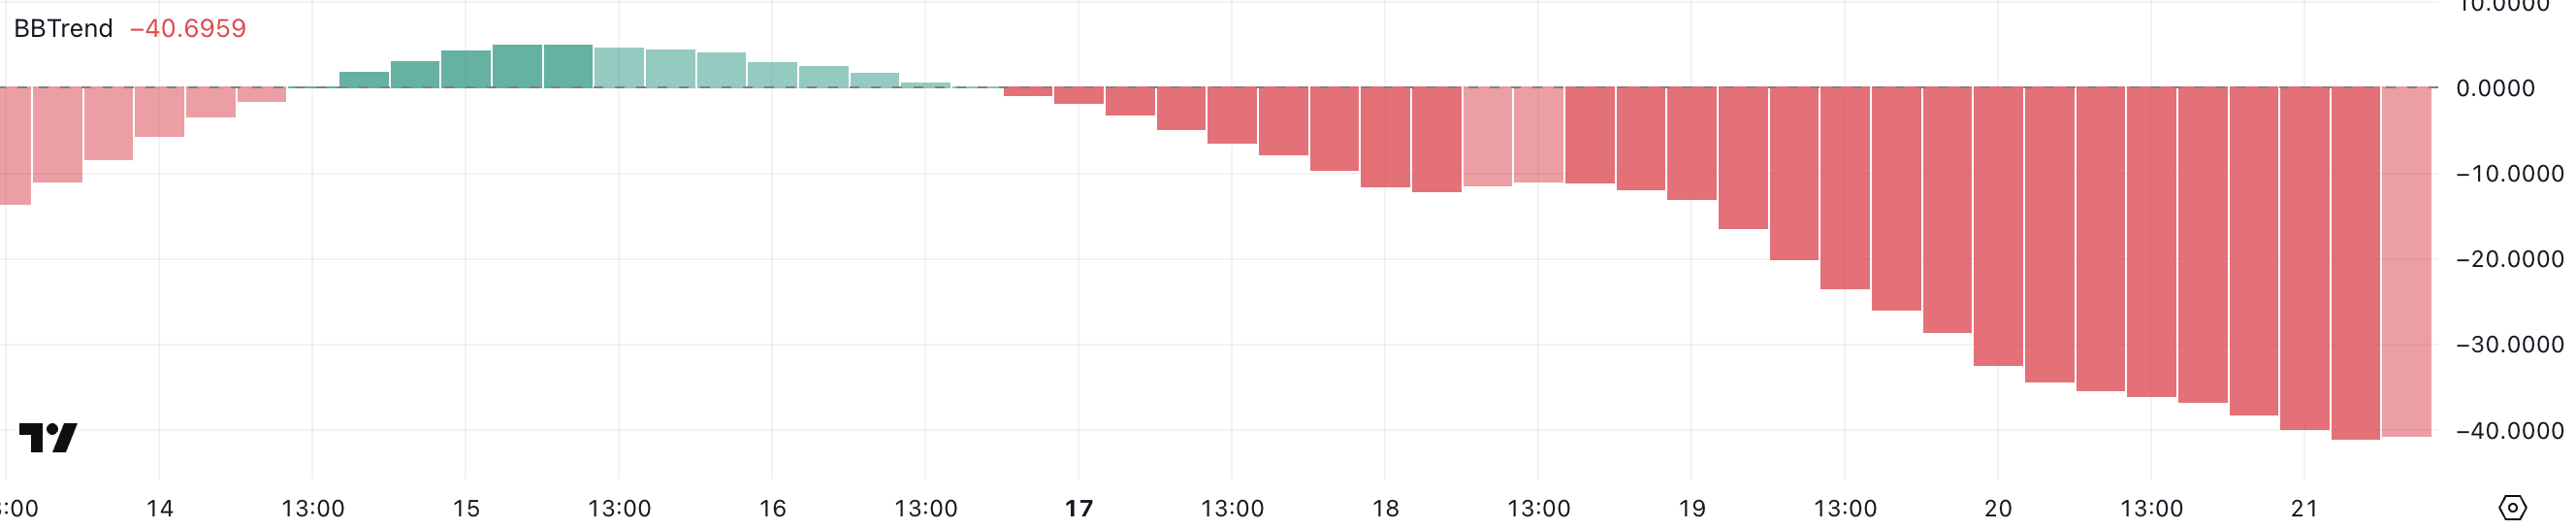
With Pi Network’s BBTrend sitting deeply in negative territory, it points to sustained bearish momentum.
This could suggest that sellers are firmly in control, and the asset may continue to face downward pressure unless a sharp reversal occurs.
A prolonged negative BBTrend like this often signals that the market is in a strong downtrend, and traders may remain cautious until signs of stabilization or a positive shift appear.
Pi Network RSI Is Recovering After Touching Oversold Levels
Pi Network’s RSI has rebounded to 36.15 after dropping as low as 17.5 just a few hours ago, showing a slight recovery in momentum.
The Relative Strength Index (RSI) is a momentum indicator that measures the speed and change of price movements. Values above 70 indicate overbought conditions, and values below 30 suggest an asset is oversold.
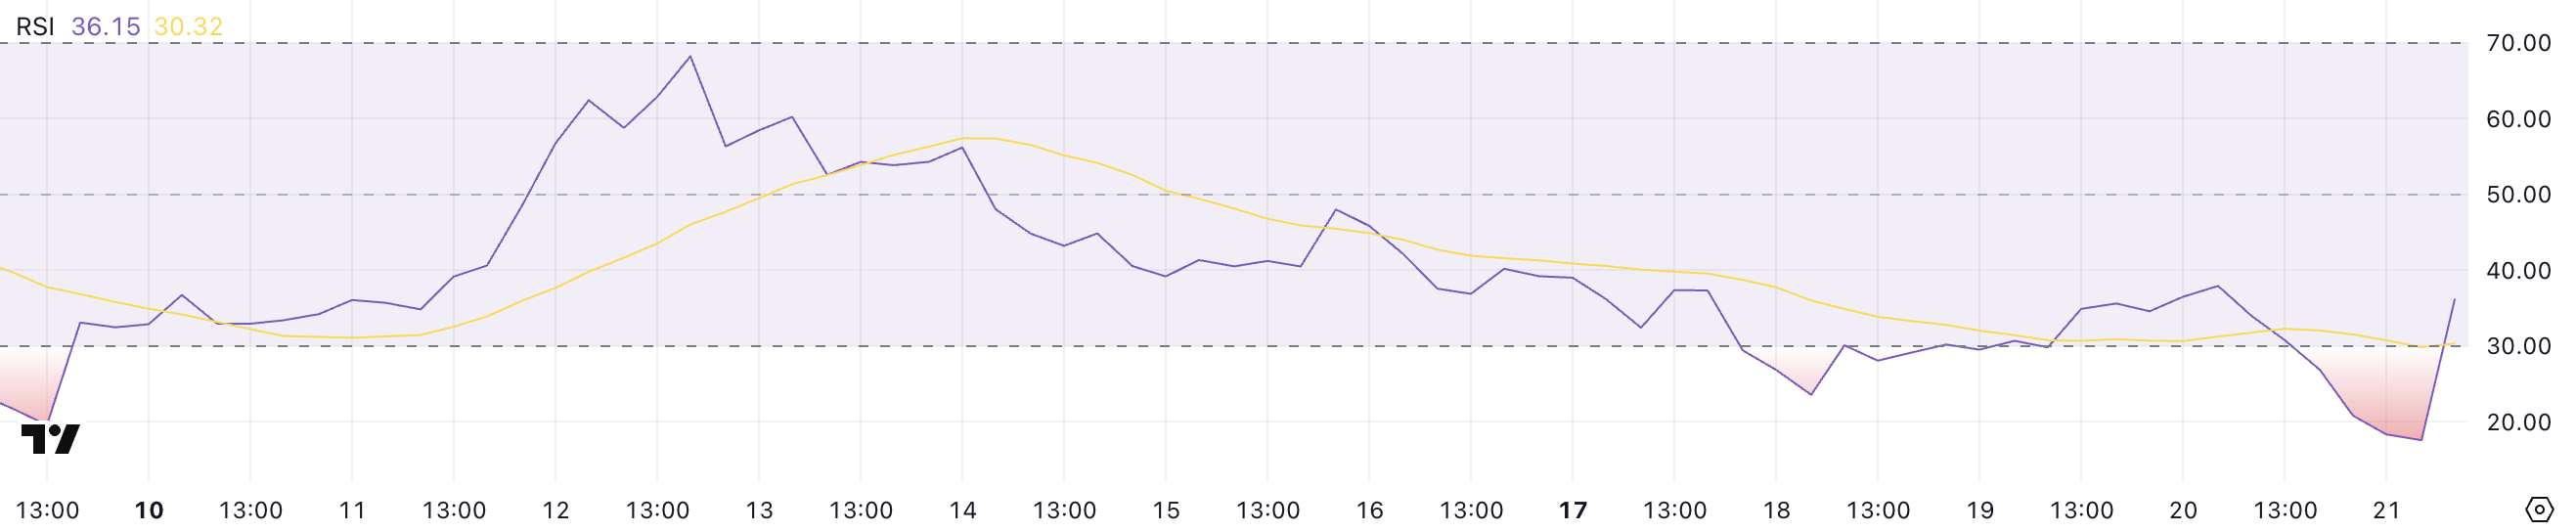
Pi Network’s RSI is now just above 36, moving out of the oversold zone but remaining in bearish territory.
This could imply that while some buying pressure has returned, the overall trend is still weak. Further upside will depend on whether the RSI continues to climb.
If the RSI fails to move higher, Pi Network may remain vulnerable to additional corrections.
Will PI Fall Below $0.90?
Pi Network has recently dropped below the $1 level for the first time since February 22 as bearish momentum builds. This decline comes as Justin Bons recently exposed Pi Network’s flaws, raising concerns and calling the project a potential “scam.”
If the correction deepens, PI price could test key support zones around $0.81 and possibly $0.62.
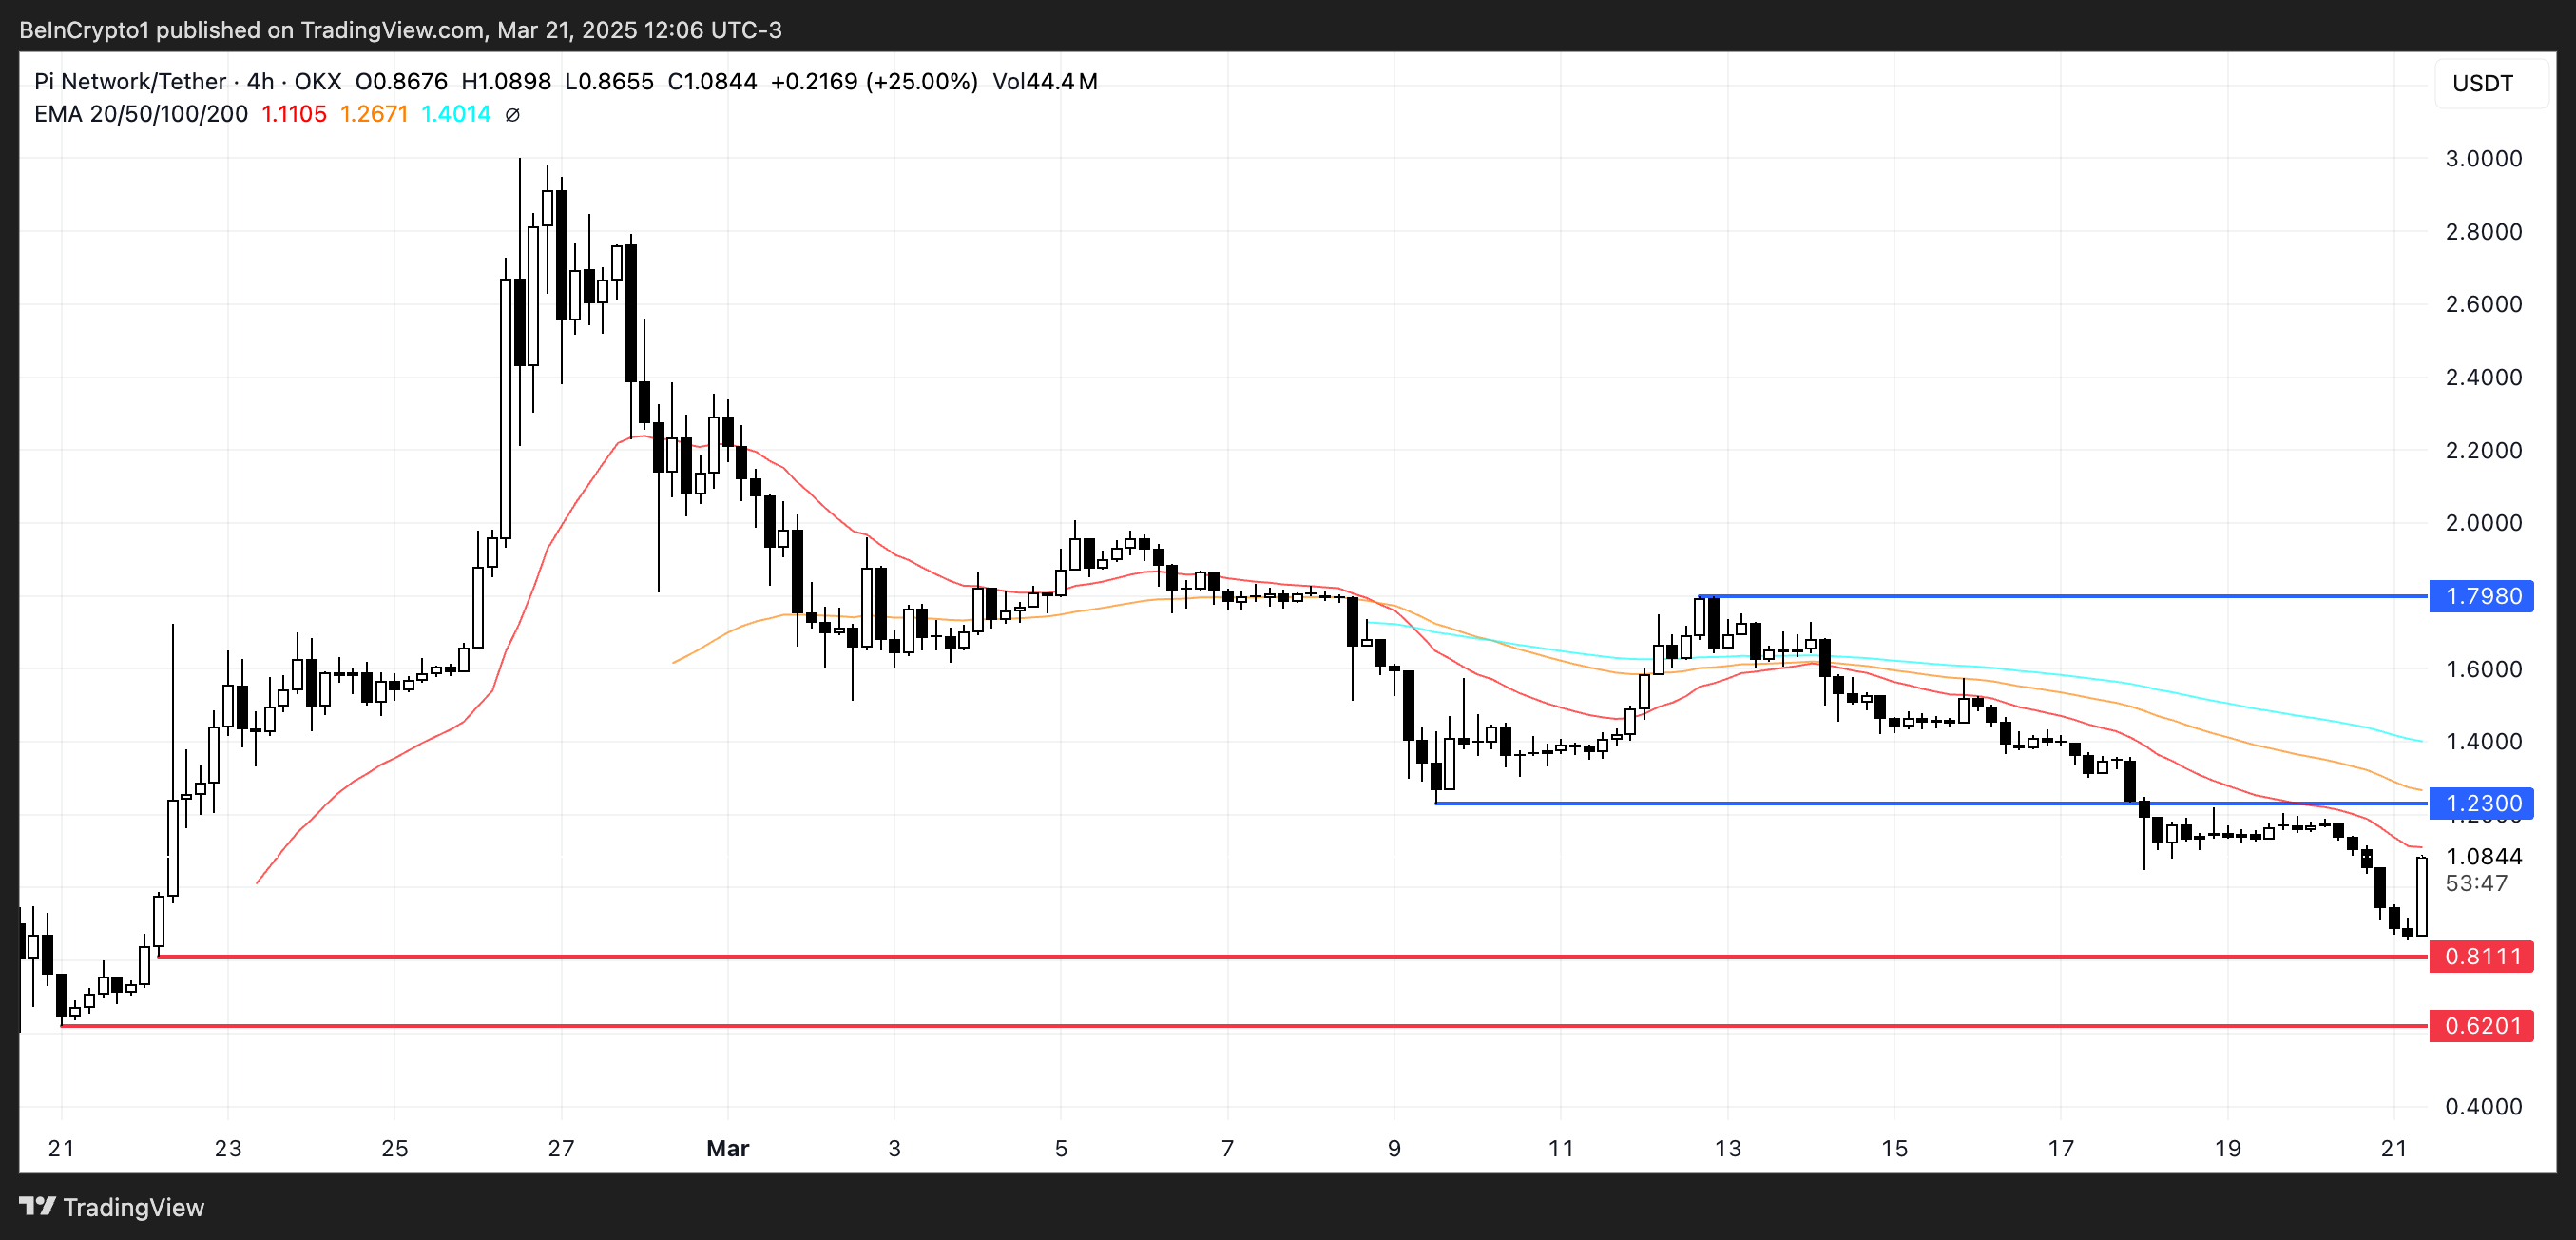
However, if Pi Network manages to regain strength despite the criticism, it could push toward resistance at $1.23.
A strong rebound could open the door for a move toward $1.79, but sentiment remains fragile following Bons’ claims and the recent price breakdown.
Disclaimer
In line with the Trust Project guidelines, this price analysis article is for informational purposes only and should not be considered financial or investment advice. BeInCrypto is committed to accurate, unbiased reporting, but market conditions are subject to change without notice. Always conduct your own research and consult with a professional before making any financial decisions. Please note that our Terms and Conditions, Privacy Policy, and Disclaimers have been updated.

Top 3 Bullish AI Coins From This Week

Digital Euro Needed to Protect Europe’s Financial Sovereignty, Says ECB Expert

Why Current ‘Boredom Phase’ Could Trigger Epic Rally

Pi Network Might Fall Below $1 As Bearish Sentiment Rise
Ethereum Price Eyes Reversal as ETH/BTC Hits Key Support

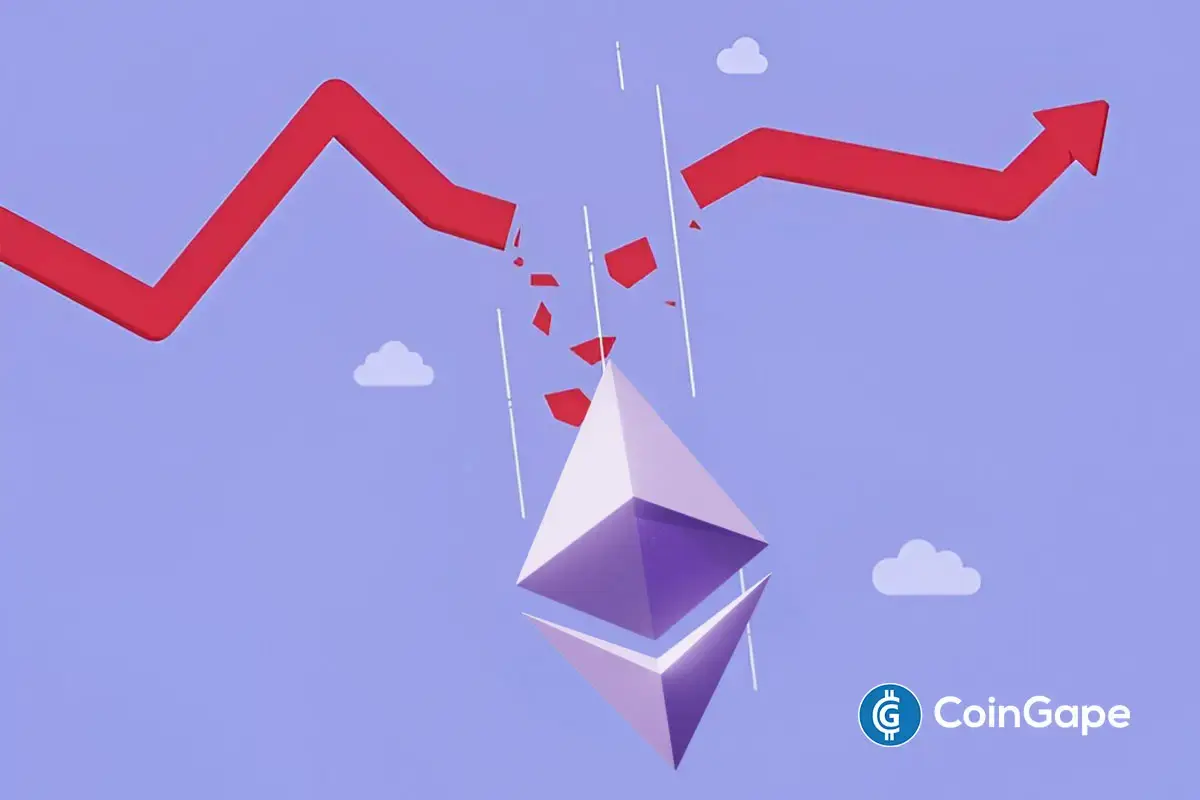
Ethereum (ETH) Can’t Breach $2,000 As Sellers Take Control

2.52 Million Altcoins Are Ruining Crypto’s Future

Animoca Brands Valuation Tanks 75% In Two Years, Here’s Why

Crypto exchange BingX hacked for $43 million

Are The Big Players Losing Interest?

Hong Kong’s Securities Association Tips Authorities On Crypto Self-Regulation

Coinbase cbBTC Set to go Live on Solana
2.52 Million Altcoins Are Ruining Crypto’s Future
Animoca Brands Valuation Tanks 75% In Two Years, Here’s Why
Crypto exchange BingX hacked for $43 million
Are The Big Players Losing Interest?
Hong Kong’s Securities Association Tips Authorities On Crypto Self-Regulation
Coinbase cbBTC Set to go Live on Solana
-

 Ethereum21 hours ago
Ethereum Needs to Break This Key Level For A ‘Bullish Flip’, Analyst Predicts
-
 Altcoin21 hours ago
Ethereum Price Eyes 50% Drop Amid Heavy ETH Whale Profit Booking
-
 Market21 hours ago
Tether Buys $33 Billion US Bonds Amid Forthcoming Regulation
-
 Altcoin17 hours ago
Why Is Solana DEX ORCA Price Skyrocketing 170% Today?
-
 Altcoin16 hours ago
Can Shiba Inu Price Hit $0.01 As SHIB Burn Rate Rockets 500%?
-

 Market15 hours ago
Is Binance Favoring BNB Chain in Token Listings and Delistings?
-

 Market23 hours ago
Analysts Predict Choppy Price Action
-

 Market16 hours ago
HBAR Traders Bet On Recovery, But Price Continues Falling