
Ethereum
Ethereum Trades At A Critical Level – Major Reclaim Or Steep Drop Ahead?

Reason to trust
![]()
Strict editorial policy that focuses on accuracy, relevance, and impartiality
Created by industry experts and meticulously reviewed
The highest standards in reporting and publishing
Strict editorial policy that focuses on accuracy, relevance, and impartiality
Morbi pretium leo et nisl aliquam mollis. Quisque arcu lorem, ultricies quis pellentesque nec, ullamcorper eu odio.
Ethereum has experienced a crucial surge above the $2,000 mark, a key level that bulls have struggled to reclaim since March 10. This breakout brings renewed optimism, as analysts believe a stronghold above this level could trigger a rally toward higher prices. However, if ETH fails to maintain support above $2,000, a significant drop could follow, leading to further market instability.
Related Reading
Macroeconomic uncertainty and trade war fears have continued to shake the crypto market, with Ethereum being one of the most affected assets. The recent price action reflects investor caution, as global financial conditions remain unpredictable.
Top analyst Jelle shared a technical analysis on X, revealing that ETH is trading at a critical level that will determine its long-term direction in the coming weeks. Bulls must sustain momentum to solidify a bullish structure, while bears are watching for signs of weakness to drive prices lower. With ETH at a pivotal juncture, the next few trading sessions could be decisive for its trajectory.
Ethereum at a Crossroads: Breakout or Breakdown?
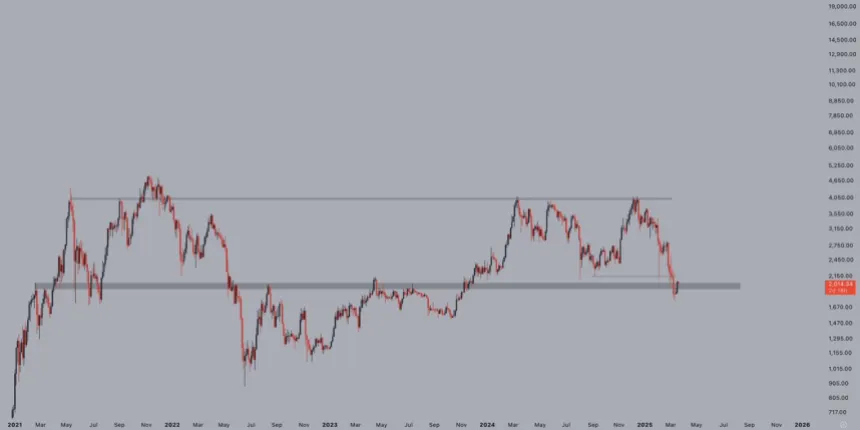
Ethereum has lost over 57% of its value since mid-December, with bulls struggling to reclaim higher prices as selling pressure dominates the market. Despite occasional relief rallies, ETH has remained under key resistance levels, leaving investors uncertain about its next move. Speculation about a potential recovery and a continuation of the downtrend are colliding, as price action shows no clear direction.
The $2,000 level has become the ultimate test for Ethereum. Bulls must defend this price with conviction to sustain any meaningful recovery. Losing this support could lead to a sharp decline, pushing ETH into deeper bearish territory.
Jelle stated in his analysis that either ETH is about to put in a massive reclaim or it’s about to jump off a cliff. The $2,000 level is the key limit that will determine Ethereum’s next move. If bulls can maintain strength above this mark, a push toward $2,300 and beyond could follow. However, failure to hold $2,000 would signal further downside, with the next major support sitting around $1,750.
Ethereum’s fate hangs in the balance, and the coming days will be crucial in deciding whether it regains bullish momentum or continues its descent.
Related Reading
Ethereum Battles to Hold $2,000: Key Levels to Watch
Ethereum is currently trading at $1,980 after days of struggling below the crucial $2,000 mark. Bulls managed to briefly push the price above this level, but sustaining it is now the real challenge. Holding above $2,000 is critical for Ethereum’s recovery, as it would signal strength and open the door for a rally toward the $2,200 mark.
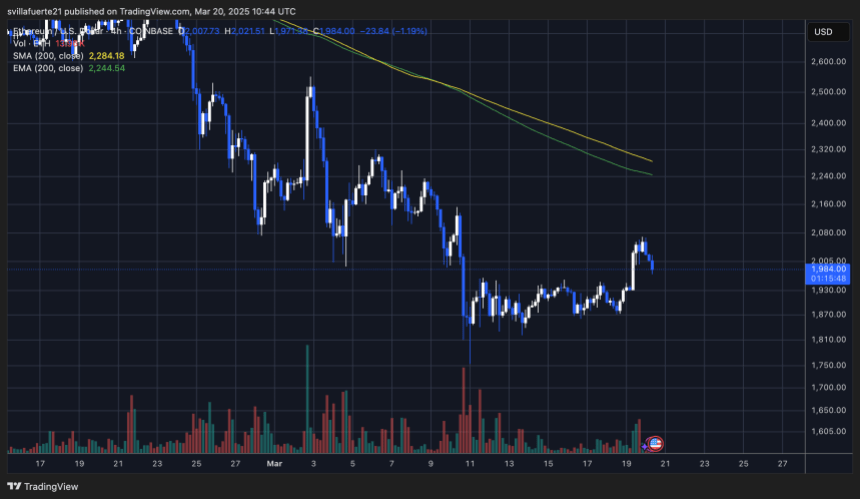
The $2,200 level is the most important resistance for ETH to reclaim in order to confirm a bullish reversal. A successful break and consolidation above this point would indicate that bulls are regaining control, potentially leading to a move toward higher targets.
However, if Ethereum fails to hold above $2,000, selling pressure could increase, leading to a deeper correction. A drop below this level could trigger a sharp decline, pushing ETH toward the $1,800 support zone. If this support fails, the next major liquidity level would be around $1,750, where buyers might step in to prevent further downside.
Related Reading
Ethereum is at a critical turning point, and the coming sessions will determine whether bulls can establish a strong foothold above $2,000 or if another wave of selling pressure will drive prices lower.
Featured image from Dall-E, chart from TradingView


Reason to trust
![]()
Strict editorial policy that focuses on accuracy, relevance, and impartiality
Created by industry experts and meticulously reviewed
The highest standards in reporting and publishing
Strict editorial policy that focuses on accuracy, relevance, and impartiality
Morbi pretium leo et nisl aliquam mollis. Quisque arcu lorem, ultricies quis pellentesque nec, ullamcorper eu odio.
A crypto analyst has predicted that the Ethereum price could be gearing up for an additional 13% crash to new lows. Currently, the cryptocurrency is hovering near the crucial $2,200 resistance, where a rejection could fuel further volatility and trigger a significant decline.
Ethereum Price Set For $1,700 Crash
In a recent technical analysis published by MadWhale, a TradingView crypto expert, the Ethereum price is projected to experience a severe price breakdown, declining by 13% to reach $1,700. The analyst attributes this bearish outlook to the cryptocurrency’s recent price action and chart patterns.
Related Reading
MadWhale shared an Ethereum price chart showing that the cryptocurrency is moving within a Descending Channel. This channel is generally a bearish chart pattern formed when two downward-sloping trend lines connect at lower highs and lower lows. It usually indicates a major downtrend, in which sellers dominate the market rather than buyers.
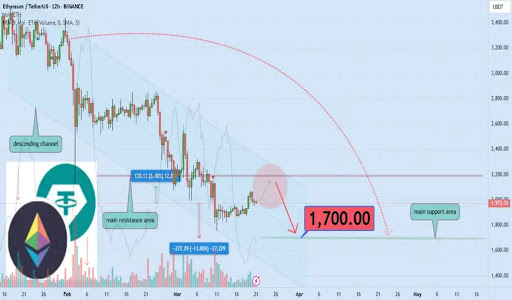
Presently, the Ethereum price is fast approaching a main resistance area at $2,200, situated around the upper boundary of the Descending Channel pattern and marked by the red shaded area on the chart. Historically, when its price reaches this area, it often encounters significant selling pressure that leads to a sharp downward price reversal.
MadWhale’s analysis suggests that the cryptocurrency may fail to break this critical resistance area, triggering his predicted decline to $1,700. This target aligns with a strong support area where the cryptocurrency has previously found buying interest.
Notably, Ethereum’s volume analysis also indicates fluctuating market participation, with no strong signs of bullish drivers or strong momentum. If volume remains low and selling pressure increases, Ethereum is likely to experience further price declines.
Analyst Predicts Three Key Targets For Ethereum
Despite the ongoing selling pressure and decline in the Ethereum price, crypto analyst Patron on X (formerly Twitter) remains optimistic about the cryptocurrency’s future outlook. The market expert has predicted three bullish targets for the Ethereum price, believing that it is only a matter of time before its present downtrend dissipates.
Related Reading
The analyst noted that Ethereum had reached a key support level, where a bounce from this threshold could trigger a surge to his projected targets marked by yellow lines on his price chart. With the Ethereum price trading at $1,989 as of writing, the analyst forecasts that it could reach a first target of $2,296, representing a 15.44% increase.
After this surge, Patron predicted that Ethereum would reclaim previous highs and rally to $2,913, marking a 46.46% gain. For his final target, he projects a surge to $4,000, reflecting a 101% jump to a new ATH. Notably, the analyst claims that if Ethereum can reach these bullish targets, it could yield a significant 100% profit for investors.
Featured image from Unsplash, chart from Tradingview.com


On-chain data shows the Ethereum Supply on Exchanges has seen a sharp decline recently, something that could be bullish for ETH’s price.
A Large Amount Of Ethereum Has Left Exchanges Recently
According to data from the on-chain analytics firm Santiment, the ETH Supply on Exchanges has fallen to its lowest point in almost 10 years. The “Supply on Exchanges” refers to an indicator that measures the total amount of Ethereum that’s currently sitting in the wallets of all centralized exchanges.
When the value of this metric observes an increase, it means the investors are depositing a net number of tokens of the asset into these platforms. One of the main reasons why traders transfer to exchanges is for selling-related purposes, and this kind of trend can have a bearish impact on the ETH price.
On the other hand, the indicator going down suggests a net amount of the asset’s supply is leaving the exchanges. Such a trend may be a sign that the investors are accumulating, which can naturally prove to be bullish for the coin.
Now, here is the chart shared by the analytics firm that shows the trend in the Ethereum Supply on Exchanges over the past year:

Looks like the value of the metric has witnessed a plunge in recent days | Source: Santiment on X
As displayed in the above graph, the Ethereum Supply on Exchanges has seen a massive drawdown recently, implying the investors have made a large amount of net withdrawals.
Compared to seven weeks ago, there is now 16.4% less ETH on exchanges. This sharp change has taken the indicator’s value to the lowest level since 2015, nearly a decade ago.
From the chart, it’s apparent that the timing of this latest withdrawal spree has coincided with a plunge in the cryptocurrency’s price. The same graph also shows the data related to the Bitcoin Supply on Exchanges and it would seem that, even though the number one digital asset has seen a decline of its own, the metric has still only continued to move sideways.
It’s possible that this is a sign the whales are making a stronger push to buy the dip for Ethereum, as compared to Bitcoin. However, the more likely explanation may lie in the rich ecosystem of DeFi and staking services that ETH hosts, which may be where this supply is heading off to in this period of market cooldown.
While Ethereum appears positive from an on-chain perspective, the same isn’t true for technical analysis. As analyst Ali Martinez has explained in an X post, the zoomed-out ETH chart may contain a grim picture for the asset.

The TA pattern that ETH has been trading inside for the last couple of years | Source: @ali_charts on X
As is visible in the chart, Ethereum has seemingly been consolidating inside a parallel channel for a while now. Recently, the asset has been on the way down and as the analyst has marked in the chart, a move to the lower level of the channel may be brewing for the coin.
ETH Price
At the time of writing, Ethereum is trading at around $1,960, down more than 3% over the last seven days.
The price of the coin seems to have been moving sideways recently | Source: ETHUSDT on TradingView
Featured image from Dall-E, Santiment.net, charts from TradingView.com
Editorial Process for bitcoinist is centered on delivering thoroughly researched, accurate, and unbiased content. We uphold strict sourcing standards, and each page undergoes diligent review by our team of top technology experts and seasoned editors. This process ensures the integrity, relevance, and value of our content for our readers.

Reason to trust
![]()
Strict editorial policy that focuses on accuracy, relevance, and impartiality
Created by industry experts and meticulously reviewed
The highest standards in reporting and publishing
Strict editorial policy that focuses on accuracy, relevance, and impartiality
Morbi pretium leo et nisl aliquam mollis. Quisque arcu lorem, ultricies quis pellentesque nec, ullamcorper eu odio.
Crypto analyst TradingShot has revealed that the Ethereum price has formed a megaphone bottom which has not been seen since 2020. The analyst revealed what happened the last time ETH formed this bottom, which provides a bullish outlook for the altcoin.
Ethereum Price Forms Megaphone Bottom
In a TradingView post, TradingShot stated that the Ethereum price has formed a megaphone bottom like in March 2020. He noted that ETH is currently on the first week of a rebound after recording three consecutive red weeks when it could not break above the 1-week MA50. The analyst further remarked that ETH is taking on a lower lows trendline, which is technically the bottom of a 1-year megaphone since the March 11, 2024 high.
Related Reading
TradingShot claimed that the market is no stranger to long-term megaphone consolidation periods like that. He stated that the Ethereum price eventually broke upward the last time it formed this megaphone between June 2019 and March 2020, which happened after the brutal COVID crash bearish leg that touched bottom.
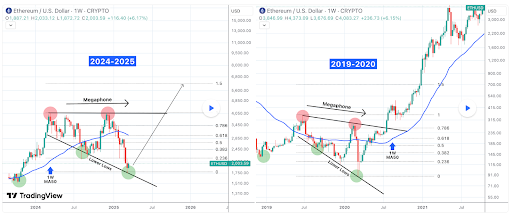
He noted that the March 2020 period is quite similar to the current bearish Ethereum price action since late December. The analyst then highlighted how perfectly aligned the Fibonacci retracement levels are. Based on this development, he predicted that the Ethereum price could at least test the 1.5 Fibonacci extension at $6,000 before this cycle tops at the end of the year.
Crypto analyst Crypto Patel also raised the possibility of the Ethereum price rallying to as high as $8,000. He suggested that this parabolic move could happen in phase E of ETH’s bull run. He indicated that ETH could face significant resistance at around $4,050 to this price level.
Bullish Fundamentals For ETH
Despite its underperformance, the Ethereum price has bullish fundamentals, which could spark a reversal to the upside and cause it to reach new highs. Crypto analyst Alternative Bull revealed that the exchange reserves of ETH are significantly declining. He remarked that this would lead to a limited supply which makes it only a matter of time before ETH goes parabolic. In line with this, the analyst affirmed that the altcoin is still in the early phases of its bull run.
Related Reading
Crypto analyst Ali Martinez has also revealed that whales are actively accumulating ETH, which is bullish for the Ethereum price. In an X post, he stated that 360,000 ETH were withdrawn from crypto exchanges in the last 48 hours, a development that could spark a supply shock.
It is also worth mentioning that the Ethereum price could soon witness a supply shock through the ETH ETFs. Asset managers like Bitwise have filed with the US SEC to include staking in their funds. If approved, this could take more ETH out of circulation as some institutional investors opt to stake their ETH to receive yields.
At the time of writing, the Ethereum price is trading at around $1,969, down almost 2% in the last 24 hours, according to data from CoinMarketCap.
Featured image from Unsplash, chart from Tradingview.com

Analyst Predict XRP Price Could Hit $77 in This Bull Cycle

Dogecoin Whales Accumulate Over 120M DOGE As Price Eyes Rally To $4.5

Expert Gives Reason Why Binance & Bybit Have Not Listed Pi Network

Ethereum Price Eyes Key Resistance as Analysts Warn of Drop to $1,700

Bitcoin STH Realized Losses Far From 2021 Levels — Is The Bull Run Still On?

Analyst Reveals Why Cardano Price Rally To $10 Isn’t ‘Crazy’

2.52 Million Altcoins Are Ruining Crypto’s Future

Animoca Brands Valuation Tanks 75% In Two Years, Here’s Why

Crypto exchange BingX hacked for $43 million

Are The Big Players Losing Interest?

Hong Kong’s Securities Association Tips Authorities On Crypto Self-Regulation

Coinbase cbBTC Set to go Live on Solana
2.52 Million Altcoins Are Ruining Crypto’s Future
Animoca Brands Valuation Tanks 75% In Two Years, Here’s Why
Crypto exchange BingX hacked for $43 million
Are The Big Players Losing Interest?
Hong Kong’s Securities Association Tips Authorities On Crypto Self-Regulation
Coinbase cbBTC Set to go Live on Solana
-

 Market23 hours ago
Why Current ‘Boredom Phase’ Could Trigger Epic Rally
-

 Altcoin23 hours ago
Digital Euro Needed to Protect Europe’s Financial Sovereignty, Says ECB Expert
-

 Market22 hours ago
Top 3 Bullish AI Coins From This Week
-

 Market21 hours ago
Solana (SOL) Risks Falling to $120 as Bearish Signals Grow
-

 Ethereum21 hours ago
Exchange Supply Sees Massive 16.4% Drop
-
 Altcoin20 hours ago
Is Ethena Price At Risk? Market Maker Offloads $10M ENA Raising Concerns
-
 Altcoin19 hours ago
Shiba Inu Price Eyes 81% Upside With SHIB Burn Rate Rising
-
 Market17 hours ago
Binance Reveals the Dark Side of Crypto Airdrops