
Market
Solana Faces Overvaluation: Price Stagnation Ahead?

Solana has struggled to maintain its recovery momentum, with the crypto token’s price failing to break past $150 despite multiple attempts. The altcoin’s price action reflects a lack of sustained bullishness, making further gains difficult.
However, strong investor support is keeping SOL from experiencing a sudden or sharp decline. This balance has left the cryptocurrency in a neutral position.
Solana Is Overvalued
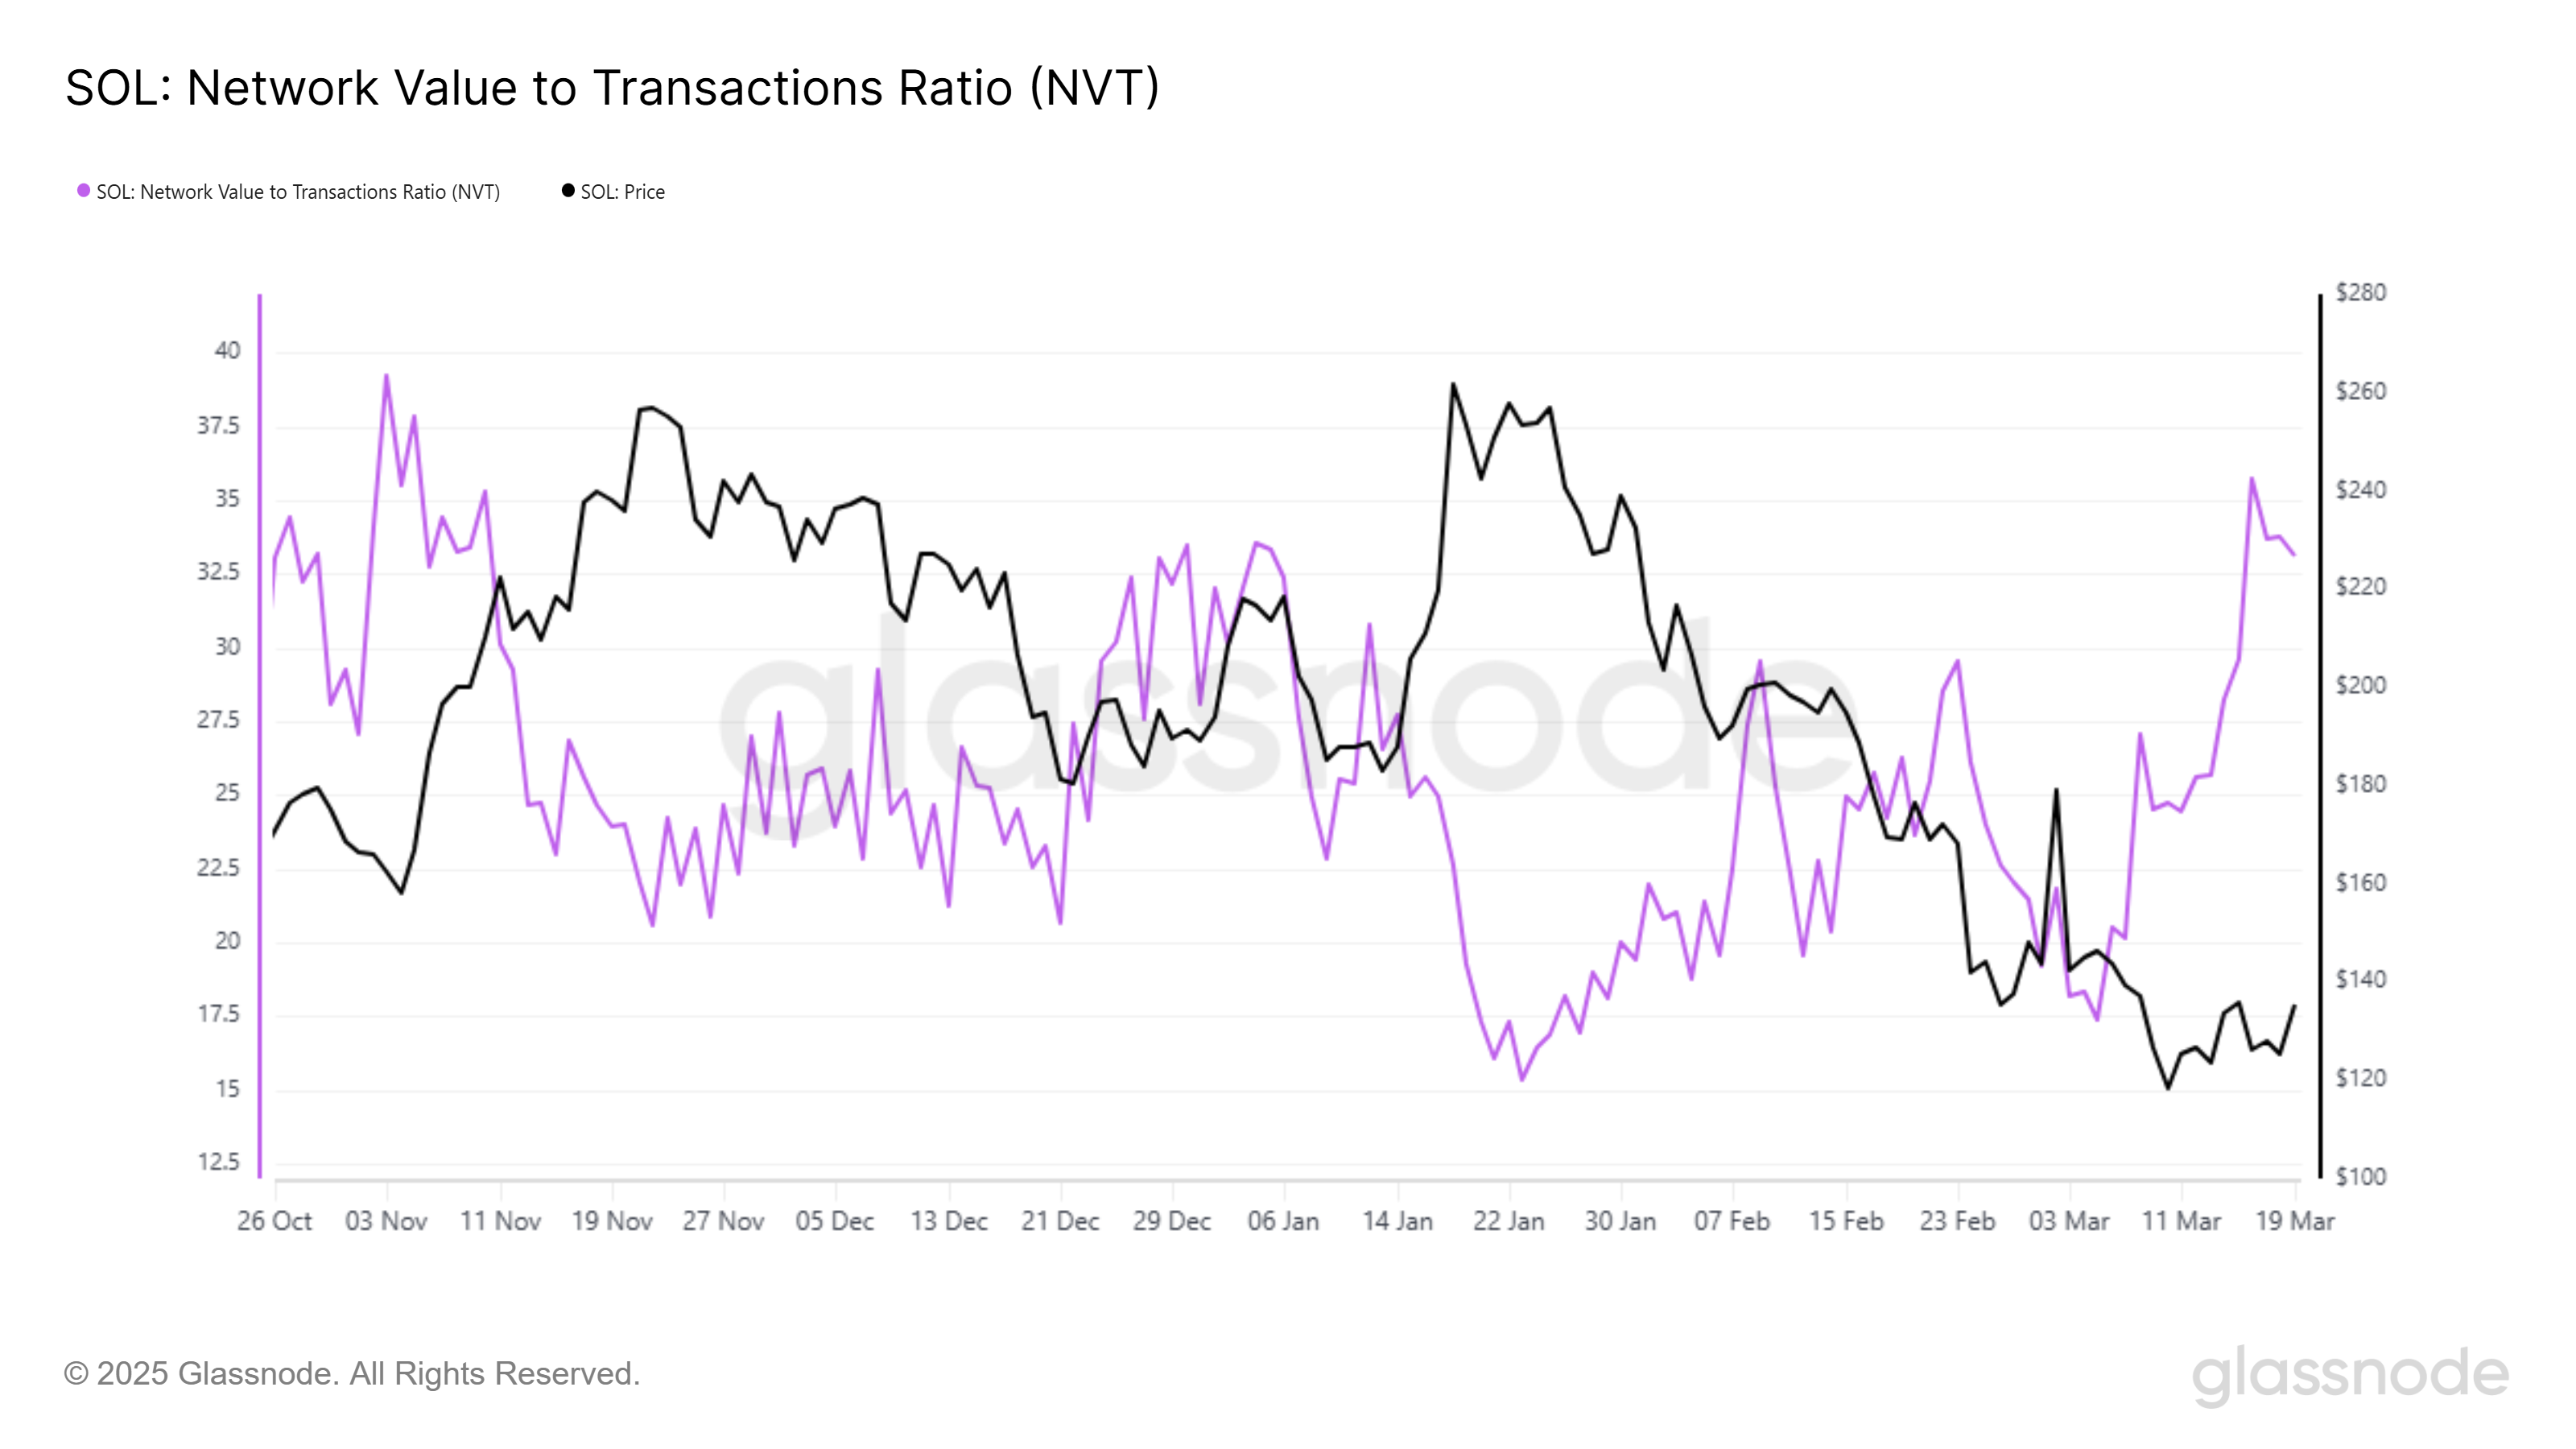
The NVT Ratio, a key metric that measures Solana’s valuation relative to transaction activity, is at a four-month high. This suggests that while the network’s value is rising, transaction activity has not kept pace.
Historically, such discrepancies indicate an overvaluation, which often leads to price corrections. If transaction volumes fail to catch up, SOL could struggle to maintain its current price. Unless transaction activity increases, the overvaluation could result in a period of stagnation or mild corrections.
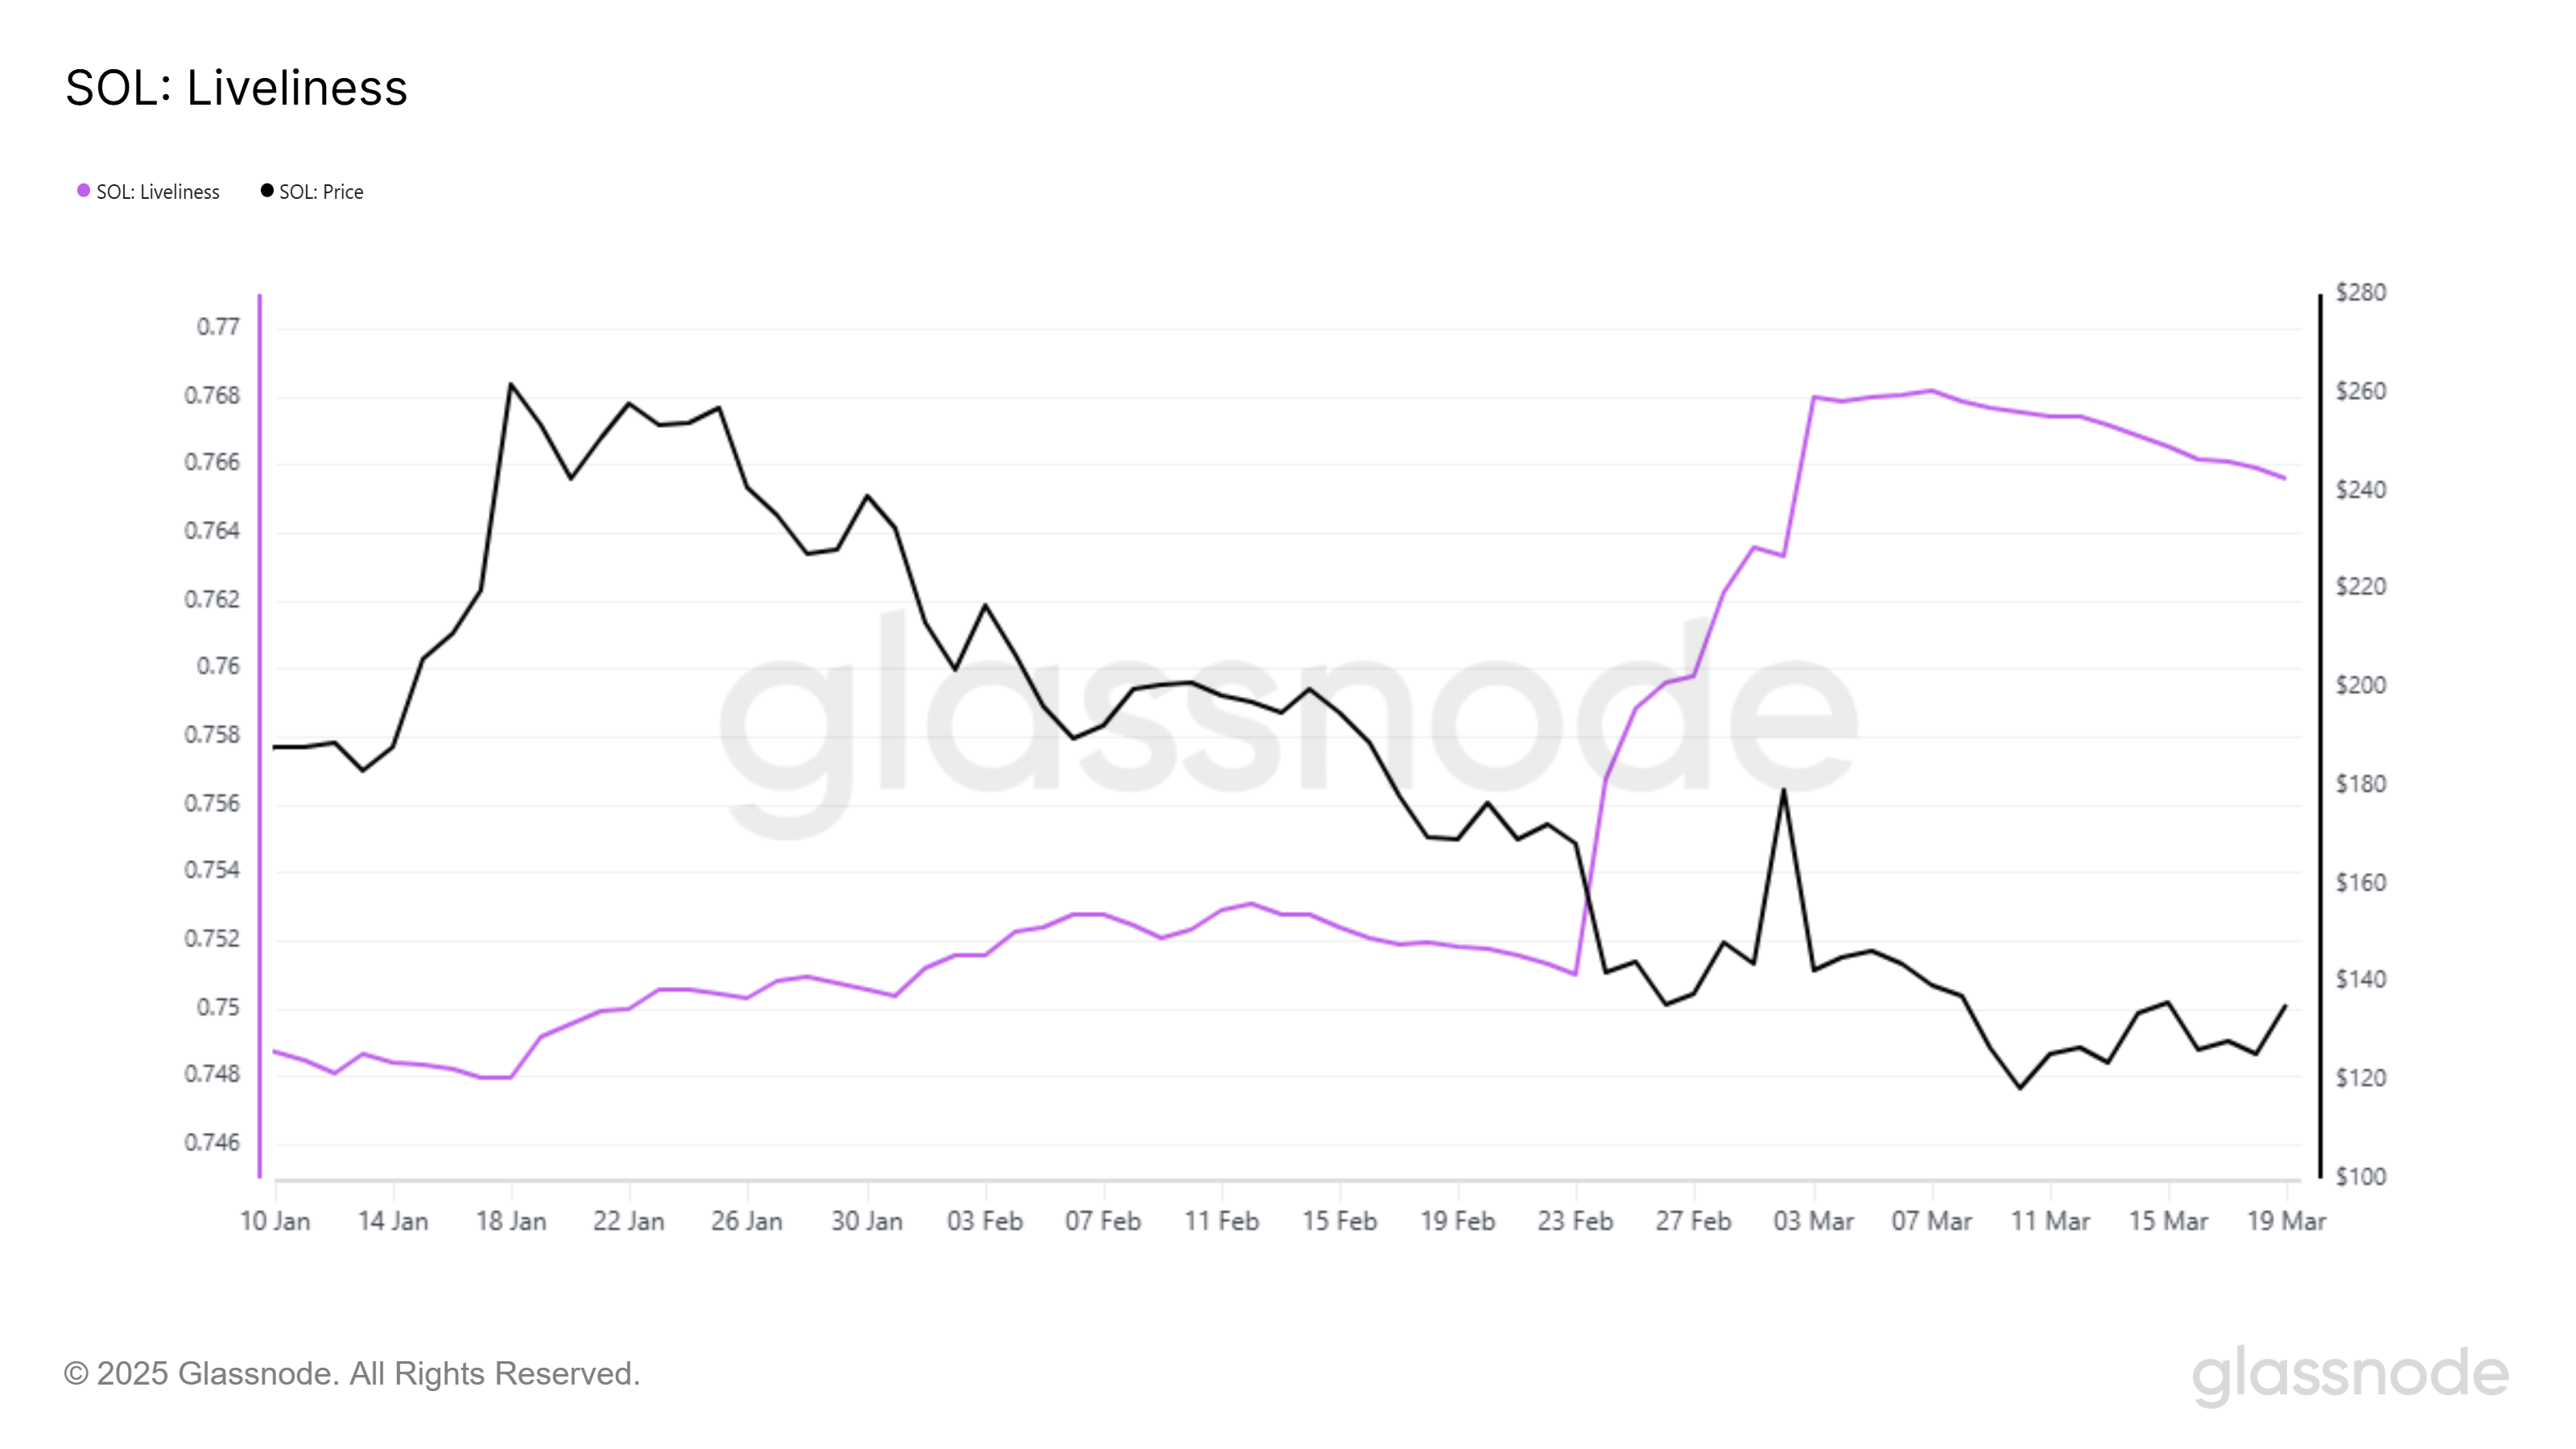
Liveliness, an indicator measuring long-term holders’ behavior, is showing a notable decline. This means that investors who previously sold their holdings are now shifting toward accumulation. When long-term holders accumulate, it signals confidence in the asset, reducing the likelihood of large sell-offs that could trigger price drops.
Earlier this month, Solana saw a sharp spike in liveliness, indicating significant liquidations. However, the current downtrend in this metric suggests a shift back to accumulation. This could act as a buffer against major price corrections.
SOL Price Fall Prevented
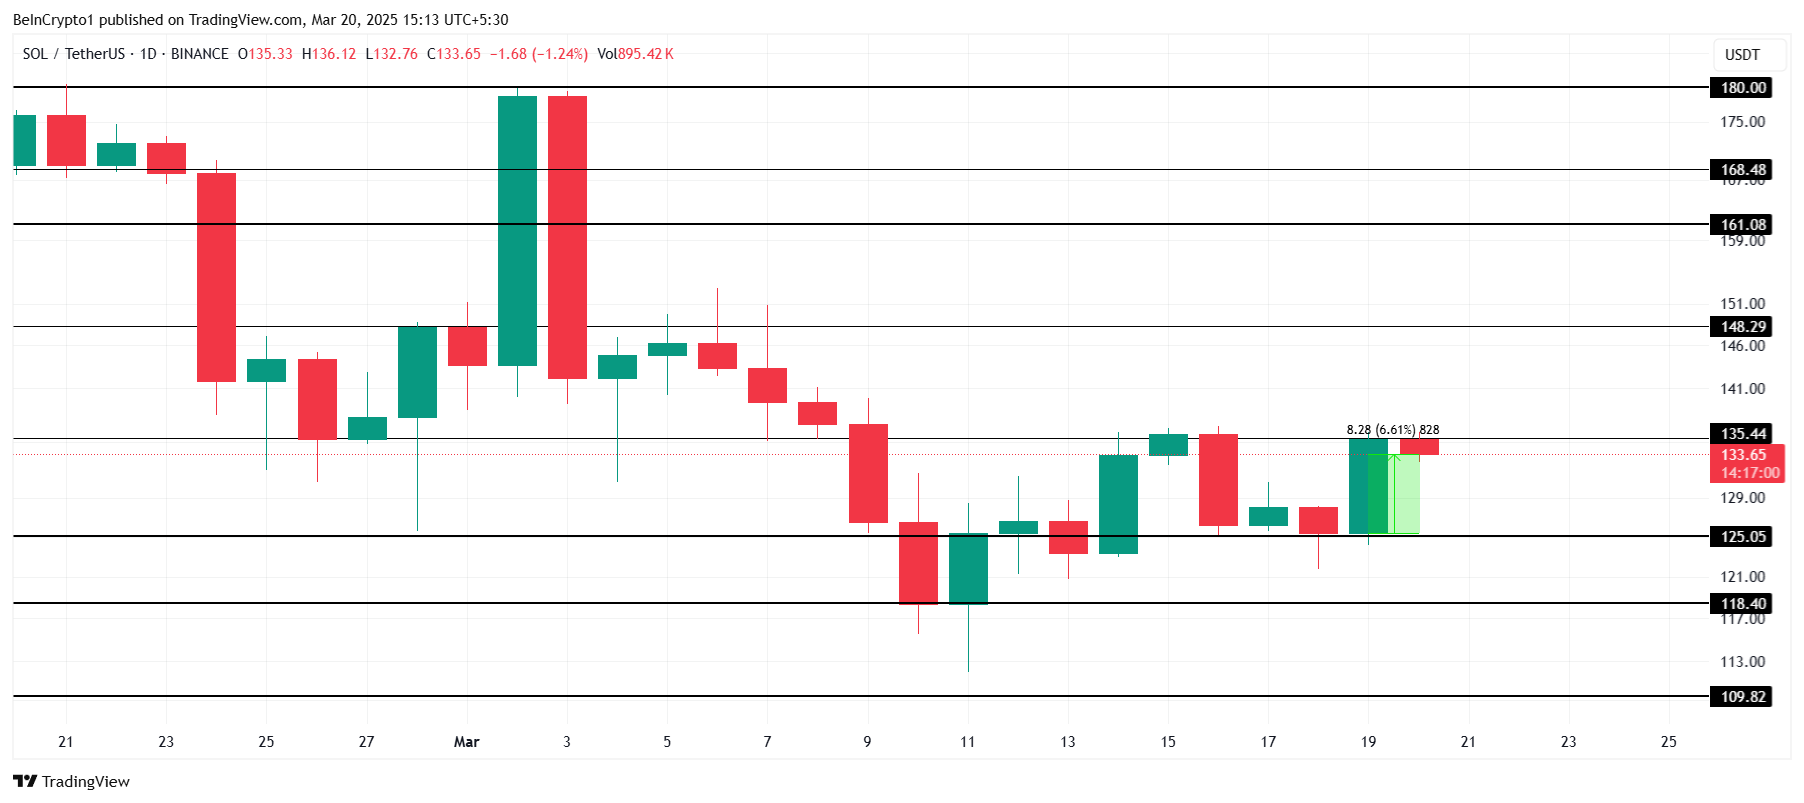
Solana’s price is up 6% in the last 24 hours, trading at $133 at the time of writing. The altcoin has remained stuck below $135 for several days, struggling to flip $148 into a support level for over a month. The lack of momentum has prevented SOL from making a decisive move upward.
The current market conditions present mixed signals. While overvaluation raises the risk of correction, the accumulation by long-term holders provides support.
As a result, Solana is likely to remain under $150, failing to breach $148. However, it is also unlikely to drop below the key supports of $125 and $118, even in a bearish scenario.
If Solana either successfully tests $148 as support or drops to $109, the neutral outlook would be invalidated. In that case, depending on broader market conditions and investor sentiment, the cryptocurrency could continue in the respective direction.
Disclaimer
In line with the Trust Project guidelines, this price analysis article is for informational purposes only and should not be considered financial or investment advice. BeInCrypto is committed to accurate, unbiased reporting, but market conditions are subject to change without notice. Always conduct your own research and consult with a professional before making any financial decisions. Please note that our Terms and Conditions, Privacy Policy, and Disclaimers have been updated.


Binance announced the results of its first community listing vote. The exchange will list four meme coins tomorrow. It was expected to launch only two, and the value of BROCCOLI, Tutorial, and BANANAS31 rallied.
However, Bananas for Scale only had a small gain, and Mubarak actually experienced a sharp decline. This may reveal fatigue in the meme coin space or a saturation of CZ-related assets.
Binance, the world’s largest crypto exchange, is trying out a new solution to determine token listings. After the vote to list Pi Network, the firm introduced a vote-based system for listings and delistings.
Binance’s first listing vote began last week, and today, the company announced the winners:
“Following the Vote to List results and completion of due diligence, Binance will list Mubarak (MUBARAK), CZ’S Dog (BROCCOLI714), Tutorial (TUT), and Banana For Scale (BANANAS31) and open trading for the following spot trading pairs at 2025-03-27 21:00 (UTC),” Binance claimed via press release.
At first, Binance claimed that only two of nine candidates in the first vote would get listings, but four of them are receiving this treatment. Typically, tokens spike when they are listed on Binance, and today, that trend largely continued.
Three of the four meme coins did well, including Broccoli, which was named after CZ’s dog.
BROCCOLI rose 65%, and Banana for Scale went up by 11%. Tutorial was the best performer, gaining over 200% in value.
However, Mubarak, an up-and-coming meme coin, actually dropped after Binance announced that it won the vote. It’s still posting net gains from the last 24 hours, but this immediate drop suggests that the news was already priced in.
Despite prominent social media buzz, Mubarak’s price has mostly stagnated in the last ten days, and it was launched 11 days ago. The meme coin market is showing signs of fatigue, and Binance’s vote may not be enough to change it.
Some users on social media have pointed out a simpler explanation. Of the four vote winners, three are either related to or connected to CZ, the former CEO of Binance. This might limit the assets’ broader market appeal.
It’s important not to overstate the case here. Mubarak dropped after the announcement, but it was largely expected to be listed. Indeed, most of the winners were fine, although BANANAS31’s 11% gains are not particularly encouraging.
If Binance keeps holding listing votes as planned, fewer winners and more unique offerings might help stave off investor fatigue.
Disclaimer
In adherence to the Trust Project guidelines, BeInCrypto is committed to unbiased, transparent reporting. This news article aims to provide accurate, timely information. However, readers are advised to verify facts independently and consult with a professional before making any decisions based on this content. Please note that our Terms and Conditions, Privacy Policy, and Disclaimers have been updated.

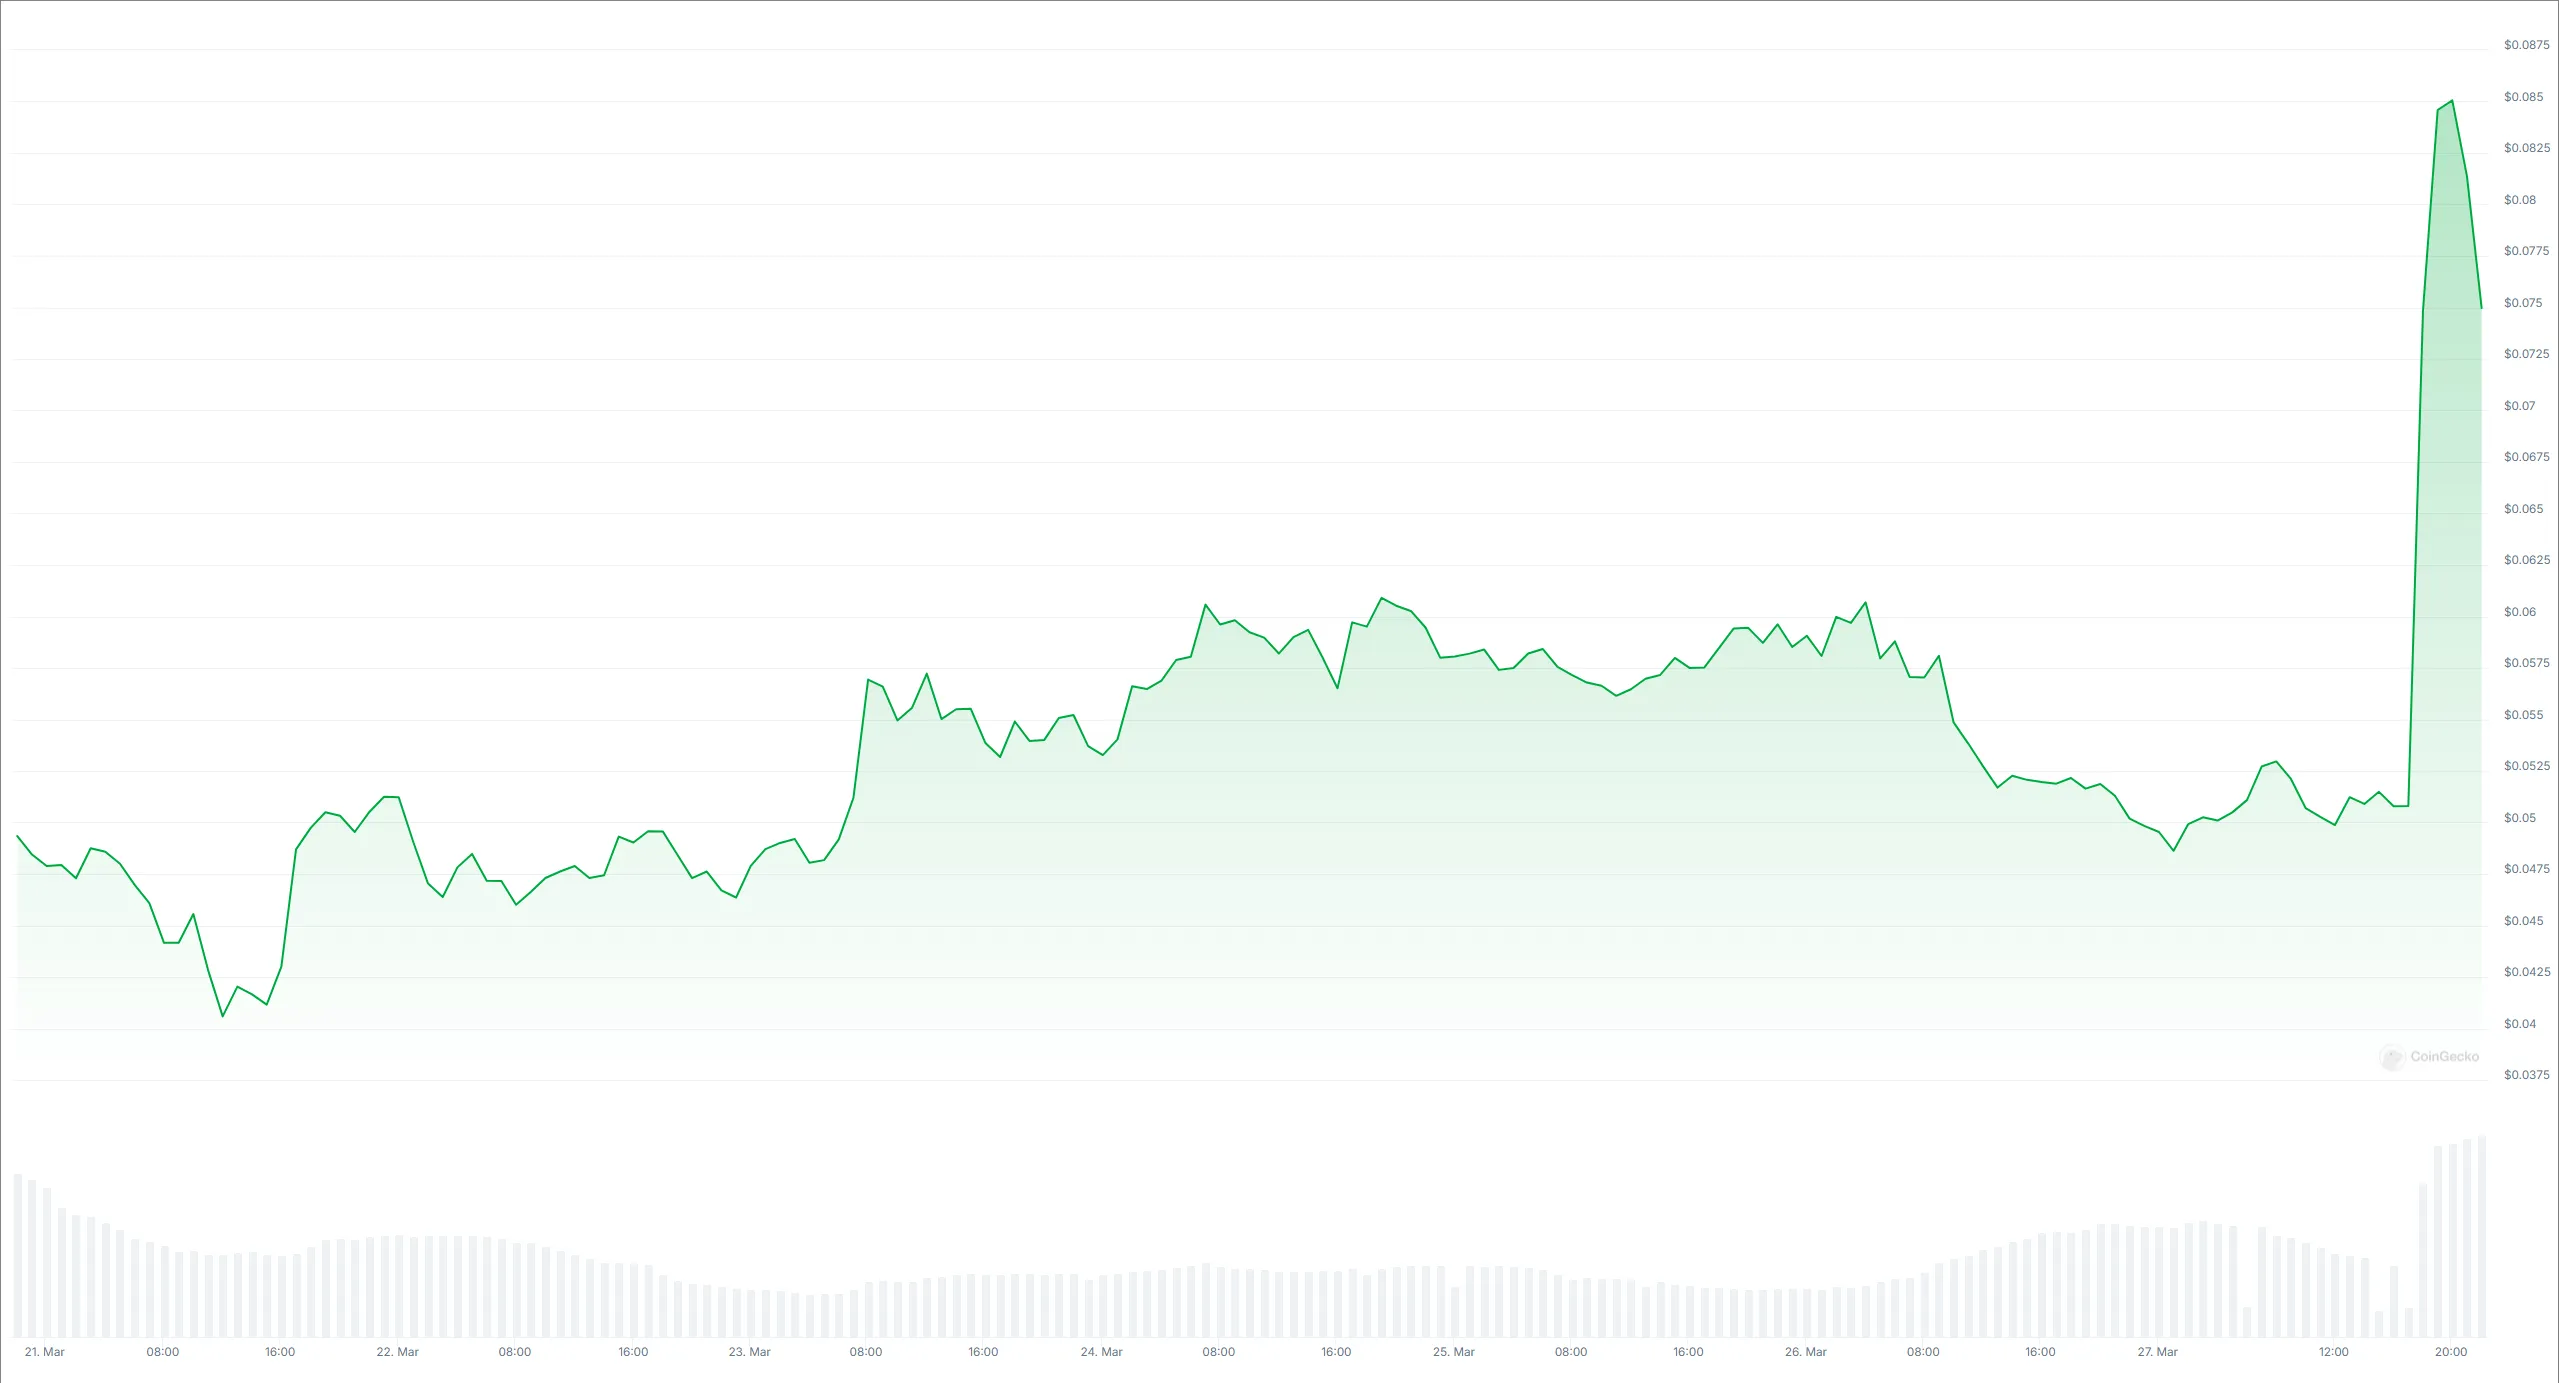
Movement Network (MOVE) has been gaining attention after announcing a $38 million buyback in response to improper activity by a Binance market maker. Despite the corrective phase that followed its sharp price spike, MOVE is still up over 13% in the last seven days.
Key indicators like RSI and DMI suggest that bullish momentum is cooling off. However, depending on market sentiment, a new trend could still develop.
Is MOVE Overbought in the Market?
MOVE’s Relative Strength Index (RSI) is currently at 56, down significantly from 83 just two days ago when its price experienced a sharp spike. That happened after the company behind it announced a $38 million buyback after discovering improper activity by a Binance market maker.
The RSI is a momentum oscillator that measures the speed and magnitude of price movements on a scale from 0 to 100.
Readings above 70 indicate overbought conditions that could lead to a pullback. Readings below 30 suggest oversold conditions that may precede a bounce. Values between 30 and 70 are considered neutral, with 50 acting as the midpoint.
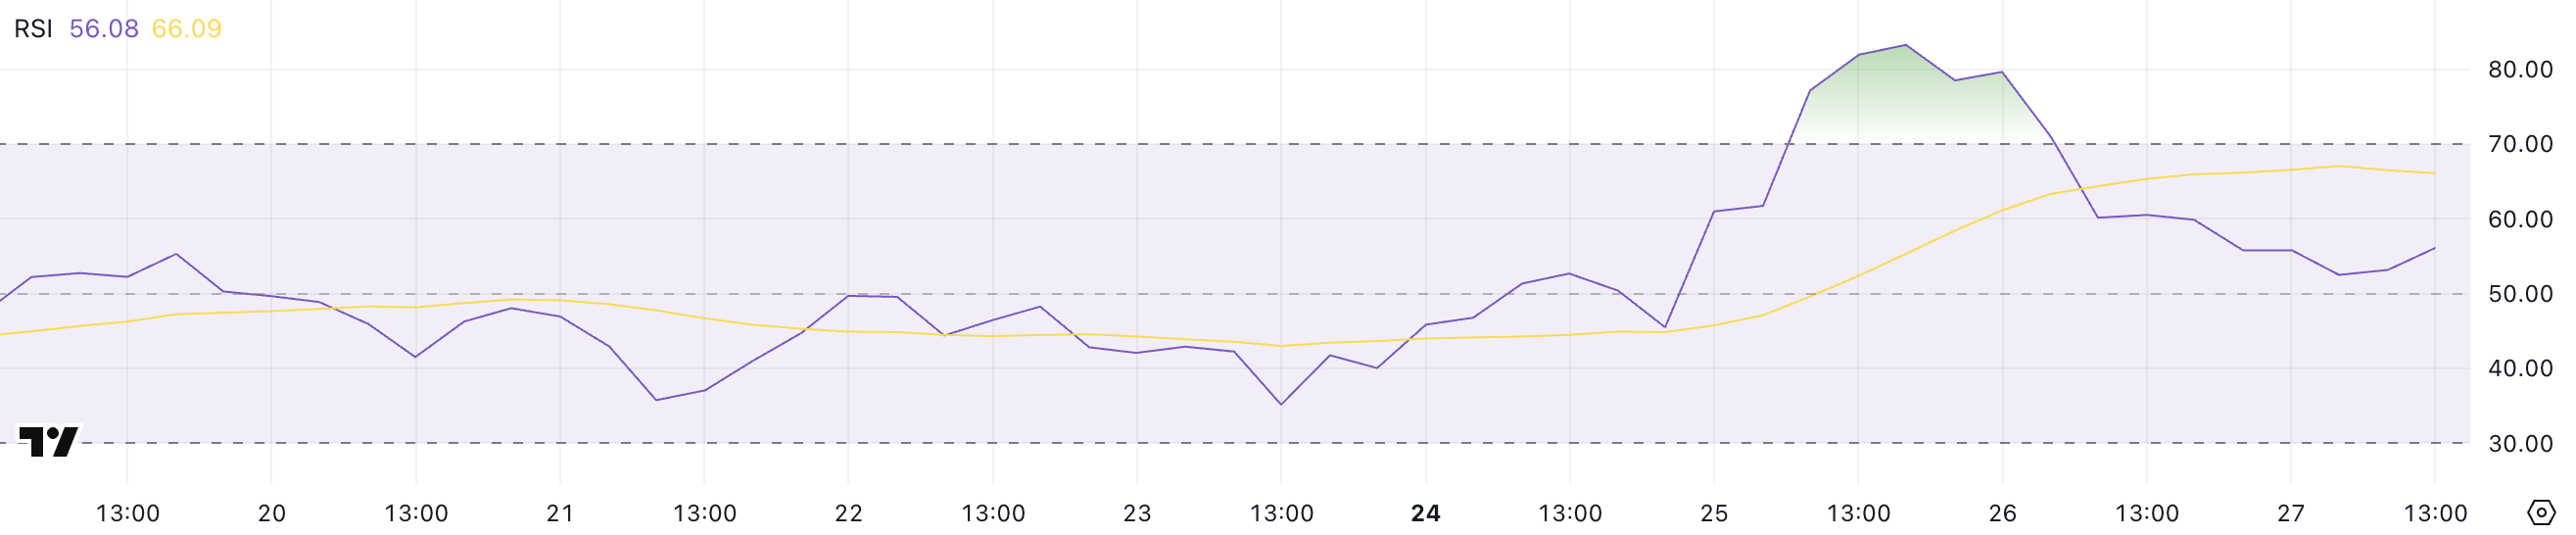
Prior to its recent surge, MOVE’s RSI hovered in the neutral zone for 23 consecutive days. That reflects a period of low momentum and price stability.
The sudden spike that pushed RSI into overbought territory was followed by this pullback to 56. That signals that the extreme bullish momentum is cooling off.
While 56 remains in neutral territory, it still leans slightly bullish and suggests that the altcoin may be consolidating before its next move. If buying interest returns, the current RSI level gives it room to push higher without being technically overbought.
Movement DMI Shows Buyers Could Lose Control In The Next Days
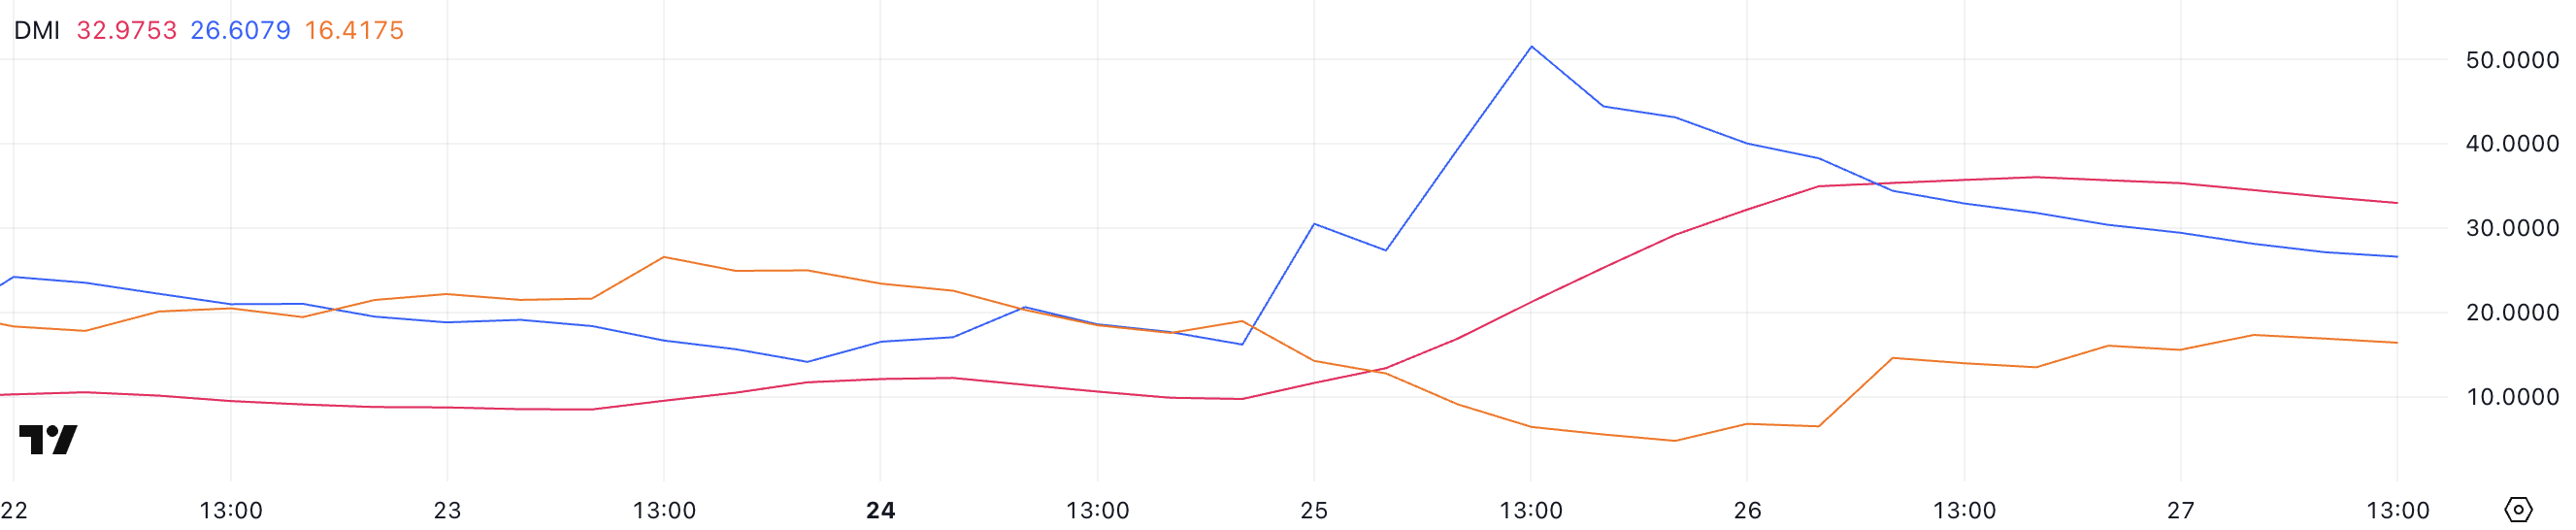
MOVE’s DMI chart shows that its Average Directional Index (ADX) is currently at 32.97, holding steady since yesterday after surging from just 9.74 two days ago.
The ADX is a key indicator used to measure the strength of a trend on a scale from 0 to 100. Readings below 20 suggest a weak or nonexistent trend. Values between 20 and 25 hint at a trend starting to form, and anything above 25 confirms a strong trend.
With MOVE’s ADX now firmly above 30, it signals that the recent price movement has established a solid trend.
Alongside the ADX, the +DI (Positive Directional Indicator) and -DI (Negative Directional Indicator) offer insight into the direction of that trend.
Currently, +DI is at 26.6, falling from 51 two days ago. On the other hand, -DI has climbed to 16.41 from 6.43 in the same period.
This indicates that bullish momentum has cooled off after the recent surge, while bearish pressure is gradually increasing. Despite the strong trend strength indicated by the ADX, the shrinking gap between +DI and -DI suggests that the bullish momentum is fading. That means the trend may be weakening or transitioning.
Based on these indicators, MOVE could now enter a period of consolidation or face a pullback unless new buying pressure emerges.
Will MOVE Drop Below $0.40 In April?
Following its sharp 30% price surge on March 25, which made it one of the best-performing altcoins of that day, MOVE has entered a corrective phase. The altcoin is now trading 11% below its recent peak.
This kind of pullback is not uncommon after such an aggressive move, as traders take profits and momentum cools off. The ongoing correction focuses on several key support levels—$0.479 is the first.
If that level fails to hold, MOVE could decline further toward $0.433 and $0.409. Also, a deeper drop toward $0.37 is possible if bearish momentum extends into April.
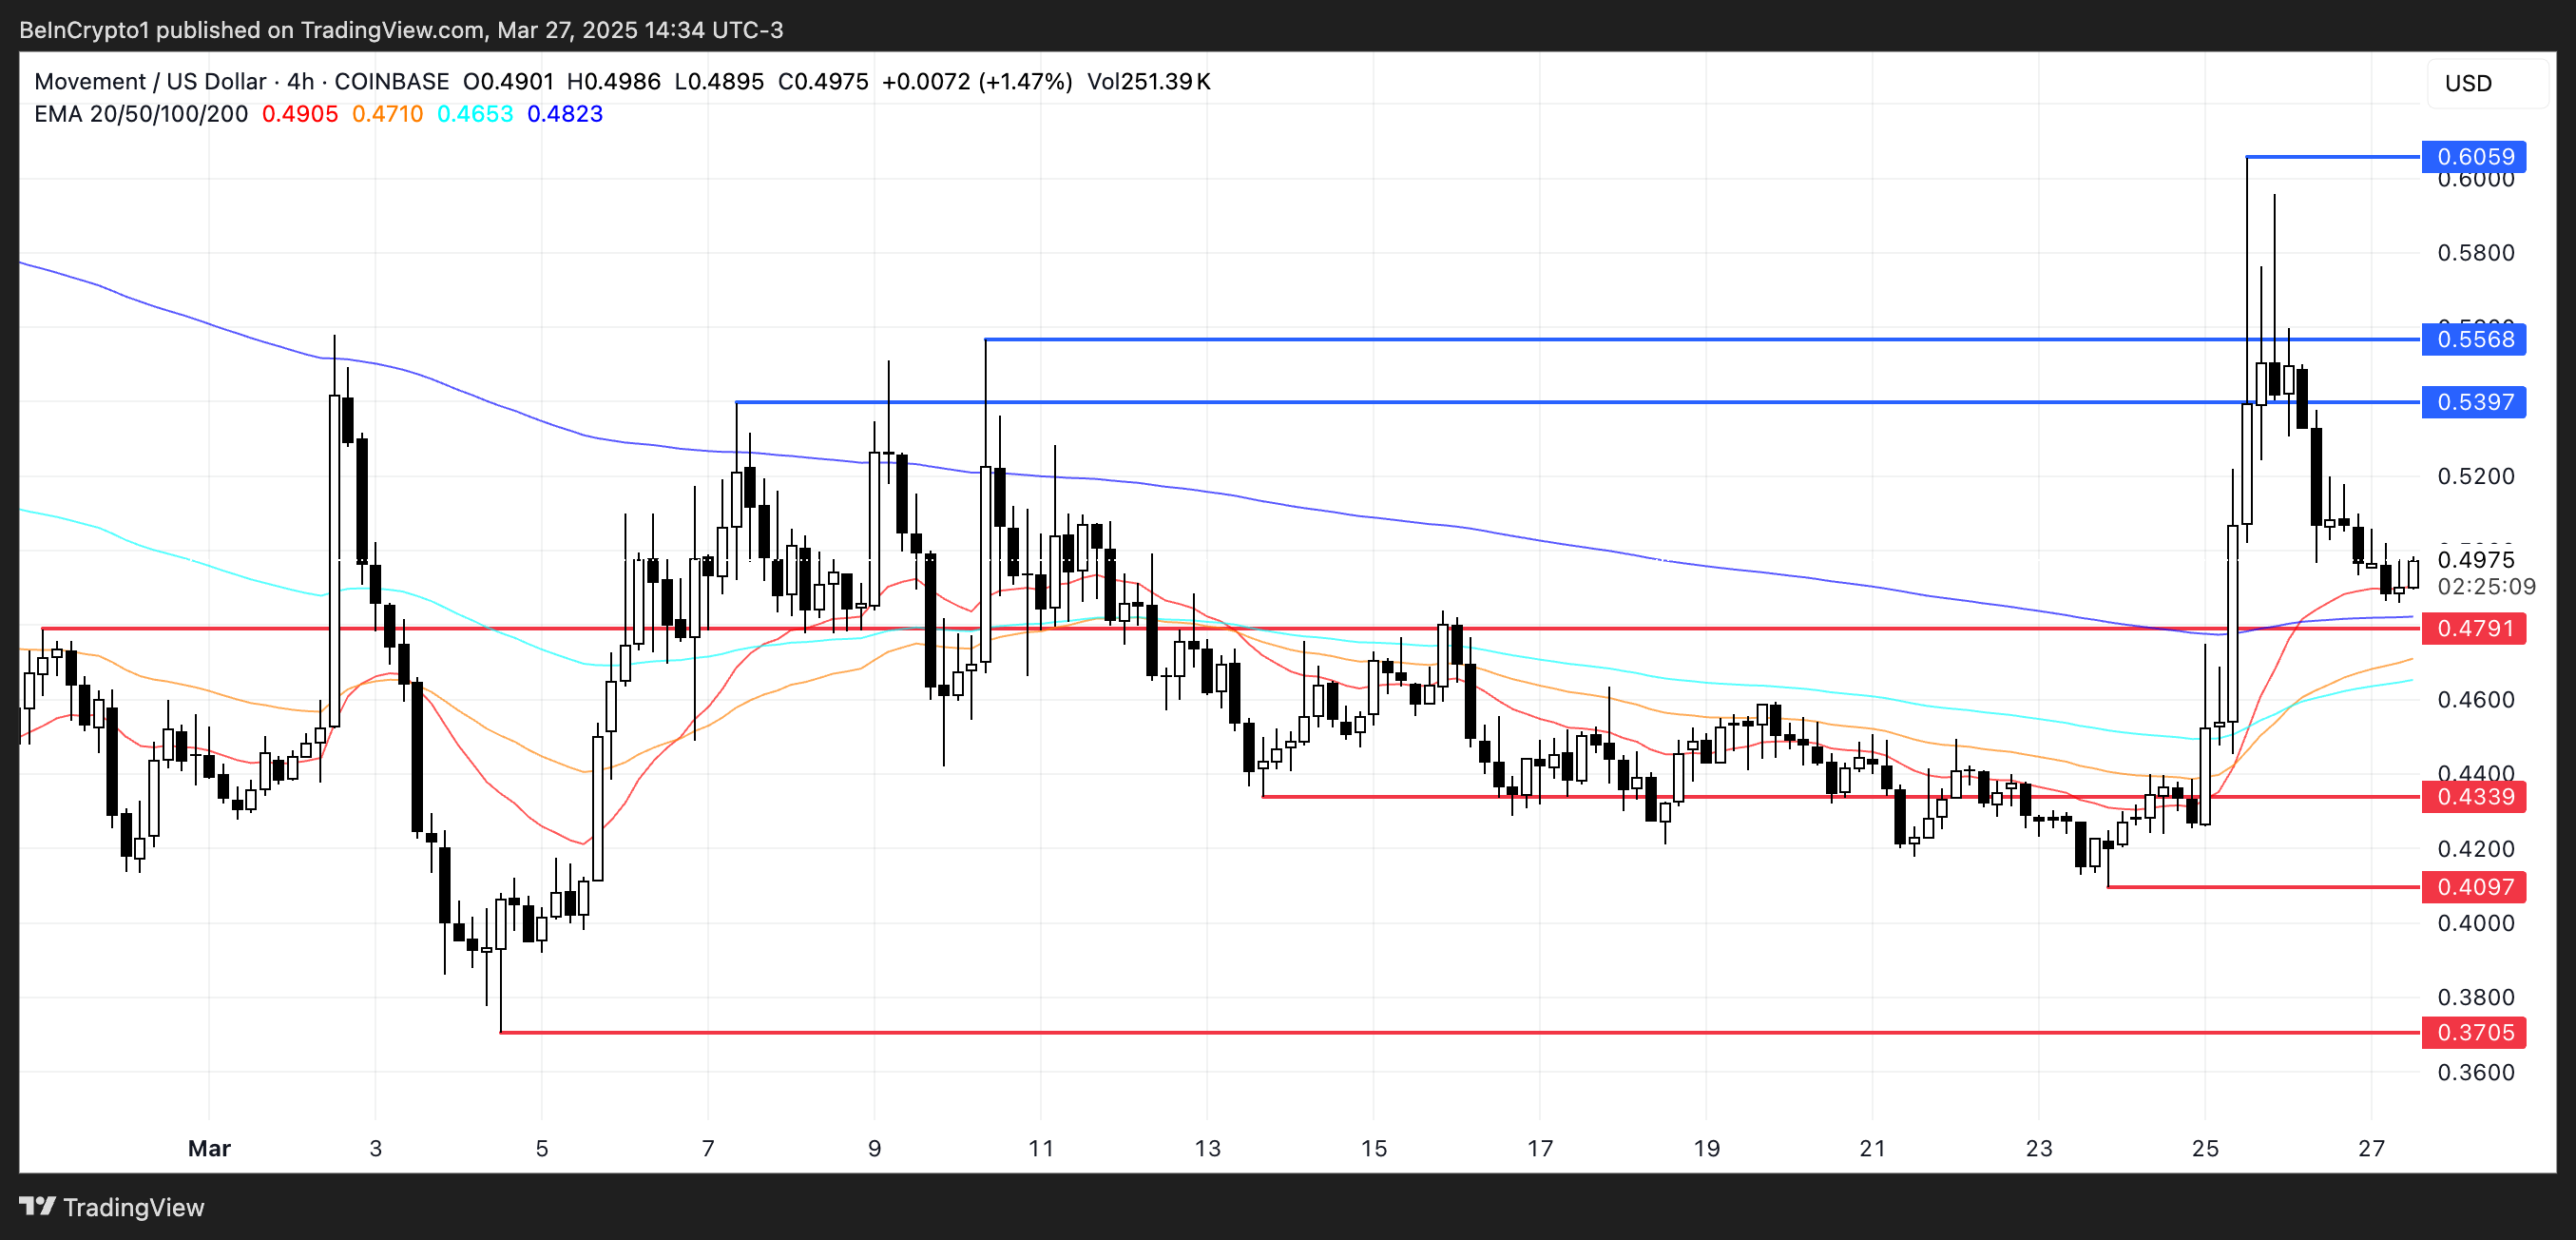
However, if sentiment around the MOVE ecosystem improves and confidence returns, the current pullback could be short-lived.
A rebound could see MOVE retest the resistance at $0.539. A successful breakout above that could open the path to $0.55, which wasn’t broken yesterday, and even $0.60.
Disclaimer
In line with the Trust Project guidelines, this price analysis article is for informational purposes only and should not be considered financial or investment advice. BeInCrypto is committed to accurate, unbiased reporting, but market conditions are subject to change without notice. Always conduct your own research and consult with a professional before making any financial decisions. Please note that our Terms and Conditions, Privacy Policy, and Disclaimers have been updated.

Cardano (ADA) is facing renewed pressure, dropping nearly 5% on Wednesday. ADA trading volume has also slipped 19% to $751 million. Despite this pullback, some indicators are beginning to flash early signs of potential trend shifts.
The BBTrend has turned positive for the first time in over a week, hinting at a possible change in momentum, while the DMI shows that ADA may be consolidating after a sharp move.
Cardano BBTrend Is Now Positive, But Still At Low Levels
Cardano’s BBTrend indicator is currently at 2.25, marking its highest reading since March 8. For the past nine days, since March 18, the BBTrend remained negative or hovered near zero, even reaching a low of -2.14 on March 19.
This recent uptick suggests a shift in market behavior, as the indicator moves out of neutral-to-bearish territory and into a more positive trend structure.
While 2.25 isn’t an extreme reading, it does signal that momentum is beginning to tilt in favor of buyers after a prolonged period of indecision or weakness.
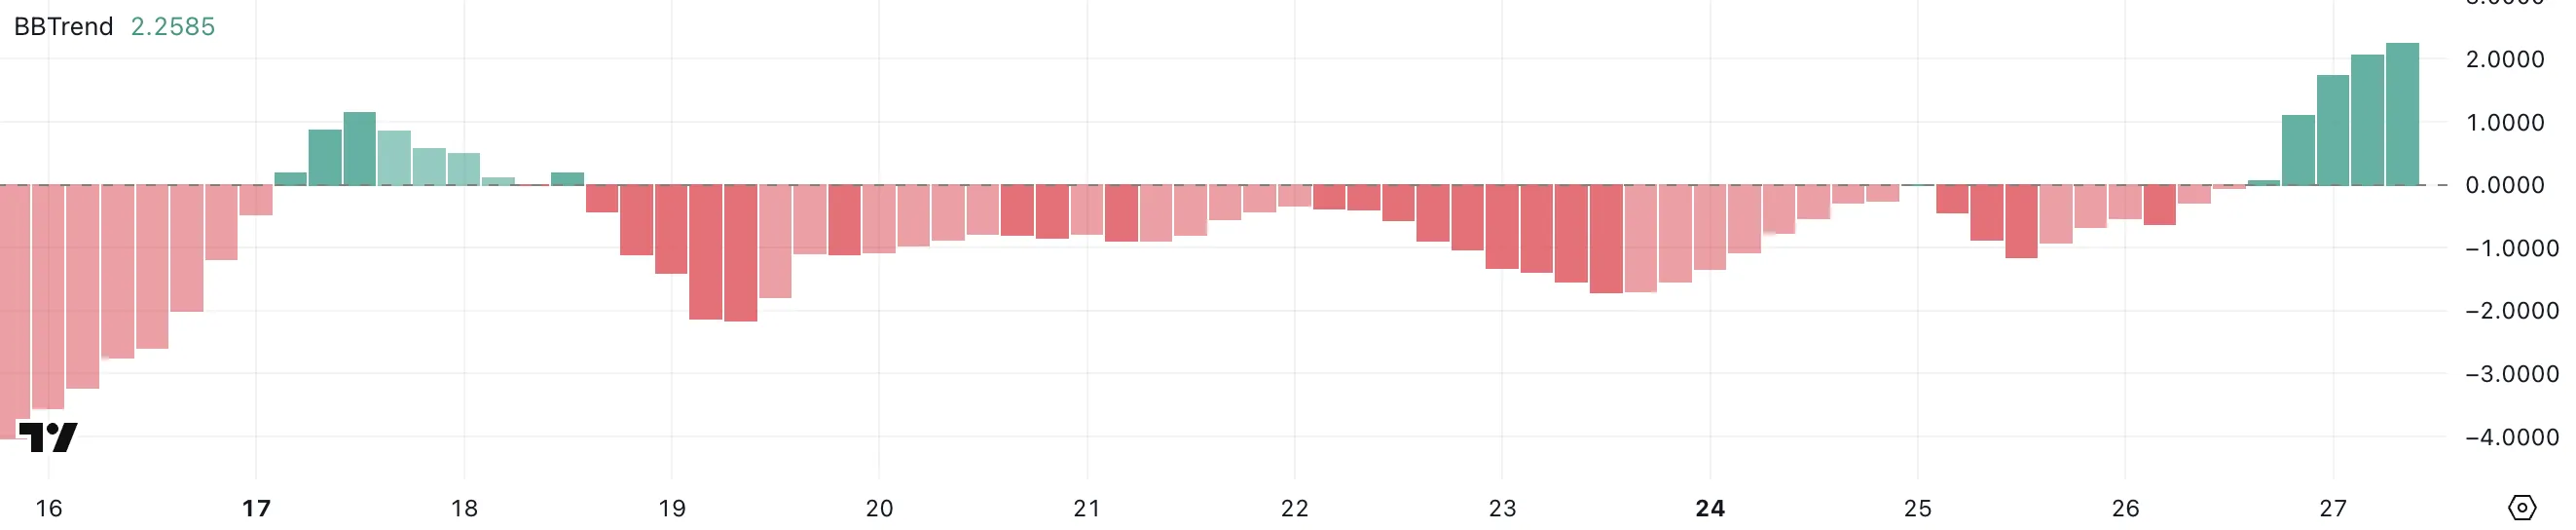
The BBTrend, or Bollinger Band Trend indicator, measures the strength and direction of a trend based on price behavior relative to the Bollinger Bands.
Values above zero generally point to bullish conditions, while values below zero suggest bearish sentiment. A reading of 2.25 indicates that price is starting to trend upward with growing volatility expansion—though not yet at strong trend levels, it marks a notable improvement.
If the BBTrend continues to rise, it could support the development of a more sustained uptrend for ADA, especially if accompanied by increased volume and a break above key resistance levels.
ADA DMI Shows The Consolidation Could End Soon
Cardano’s DMI chart shows that the Average Directional Index (ADX) has dropped to 17, a sharp decline from 25.79 just a day earlier. This suggests a significant weakening in trend strength following yesterday’s rapid price surge and subsequent drop.
The ADX is a key component of the DMI system and is used to gauge the strength of a trend—regardless of direction.
Typically, an ADX below 20 signals a lack of strong trend or consolidation, while readings above 25 indicate a more established trend gaining traction.
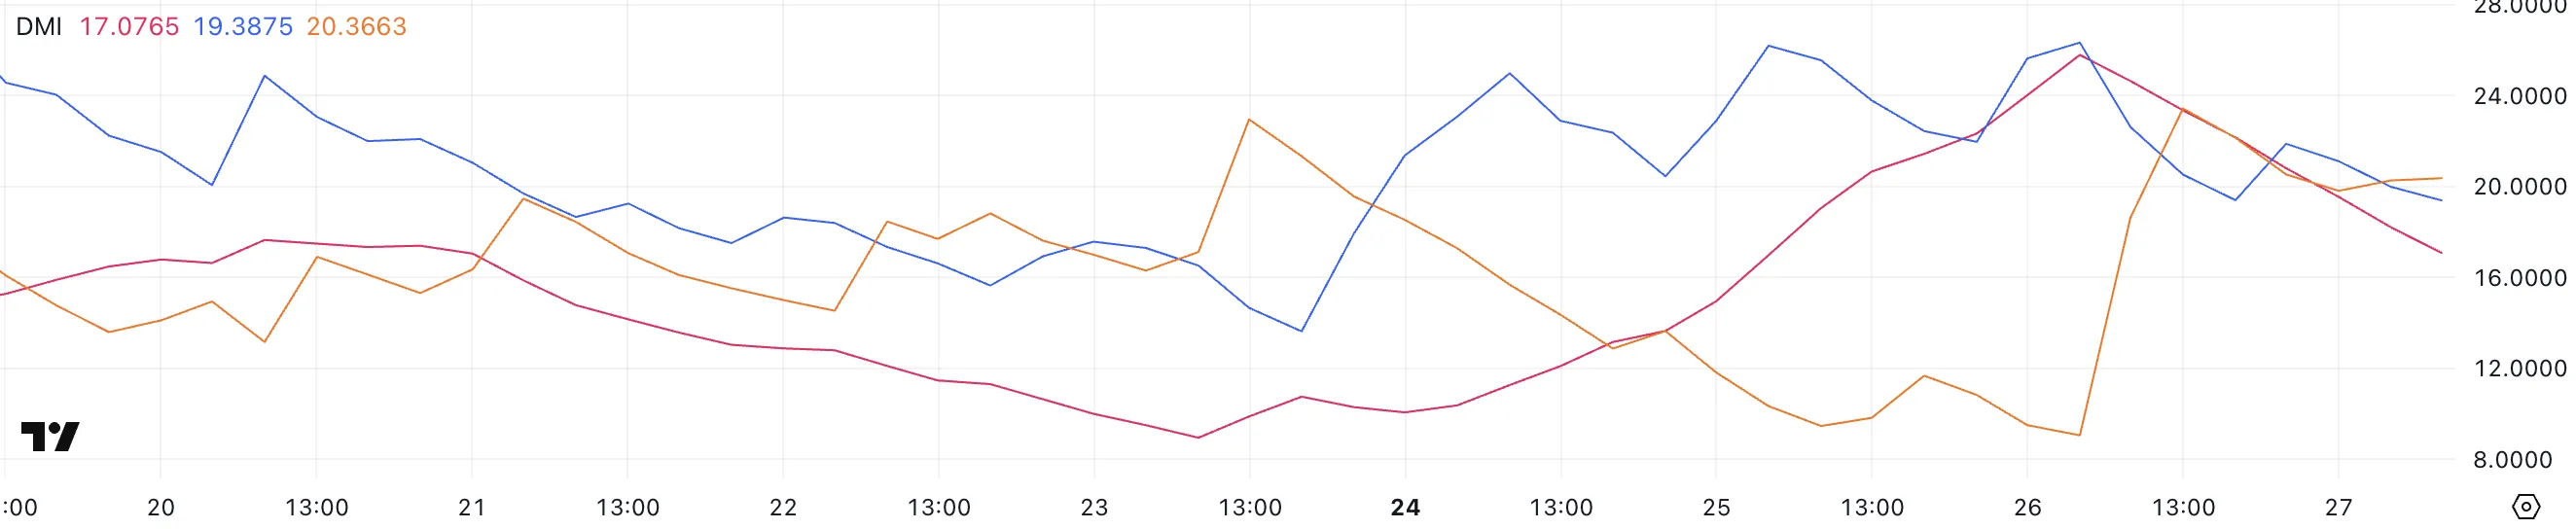
Alongside the ADX, the +DI (Positive Directional Indicator) and -DI (Negative Directional Indicator) provide insight into the direction of momentum. Currently, +DI has fallen to 19.38 from 26.33, while -DI has surged to 20.36 from 9.
This crossover suggests that sellers are beginning to take control, even as the overall trend weakens.
With both the ADX trending downward and the DI lines crossing in favor of the bears, this suggests a market in consolidation but with increasing downside pressure. Unless momentum shifts again, ADA may struggle to regain upward traction in the short term.
Can Cardano Return To $1 Before April?
Cardano’s DMI lines suggest the asset is undergoing a correction following a failed attempt to break above the key resistance level at $0.77.
This rejection has shifted momentum, and if Cardano’s price continues to drop, the next area to watch is the support around $0.69. Should that level fail to hold, it could trigger further downside movement, potentially pushing ADA down to the $0.64 range.
The DMI’s directional shift supports this short-term bearish view, with sellers gradually gaining strength as buyers lose momentum.
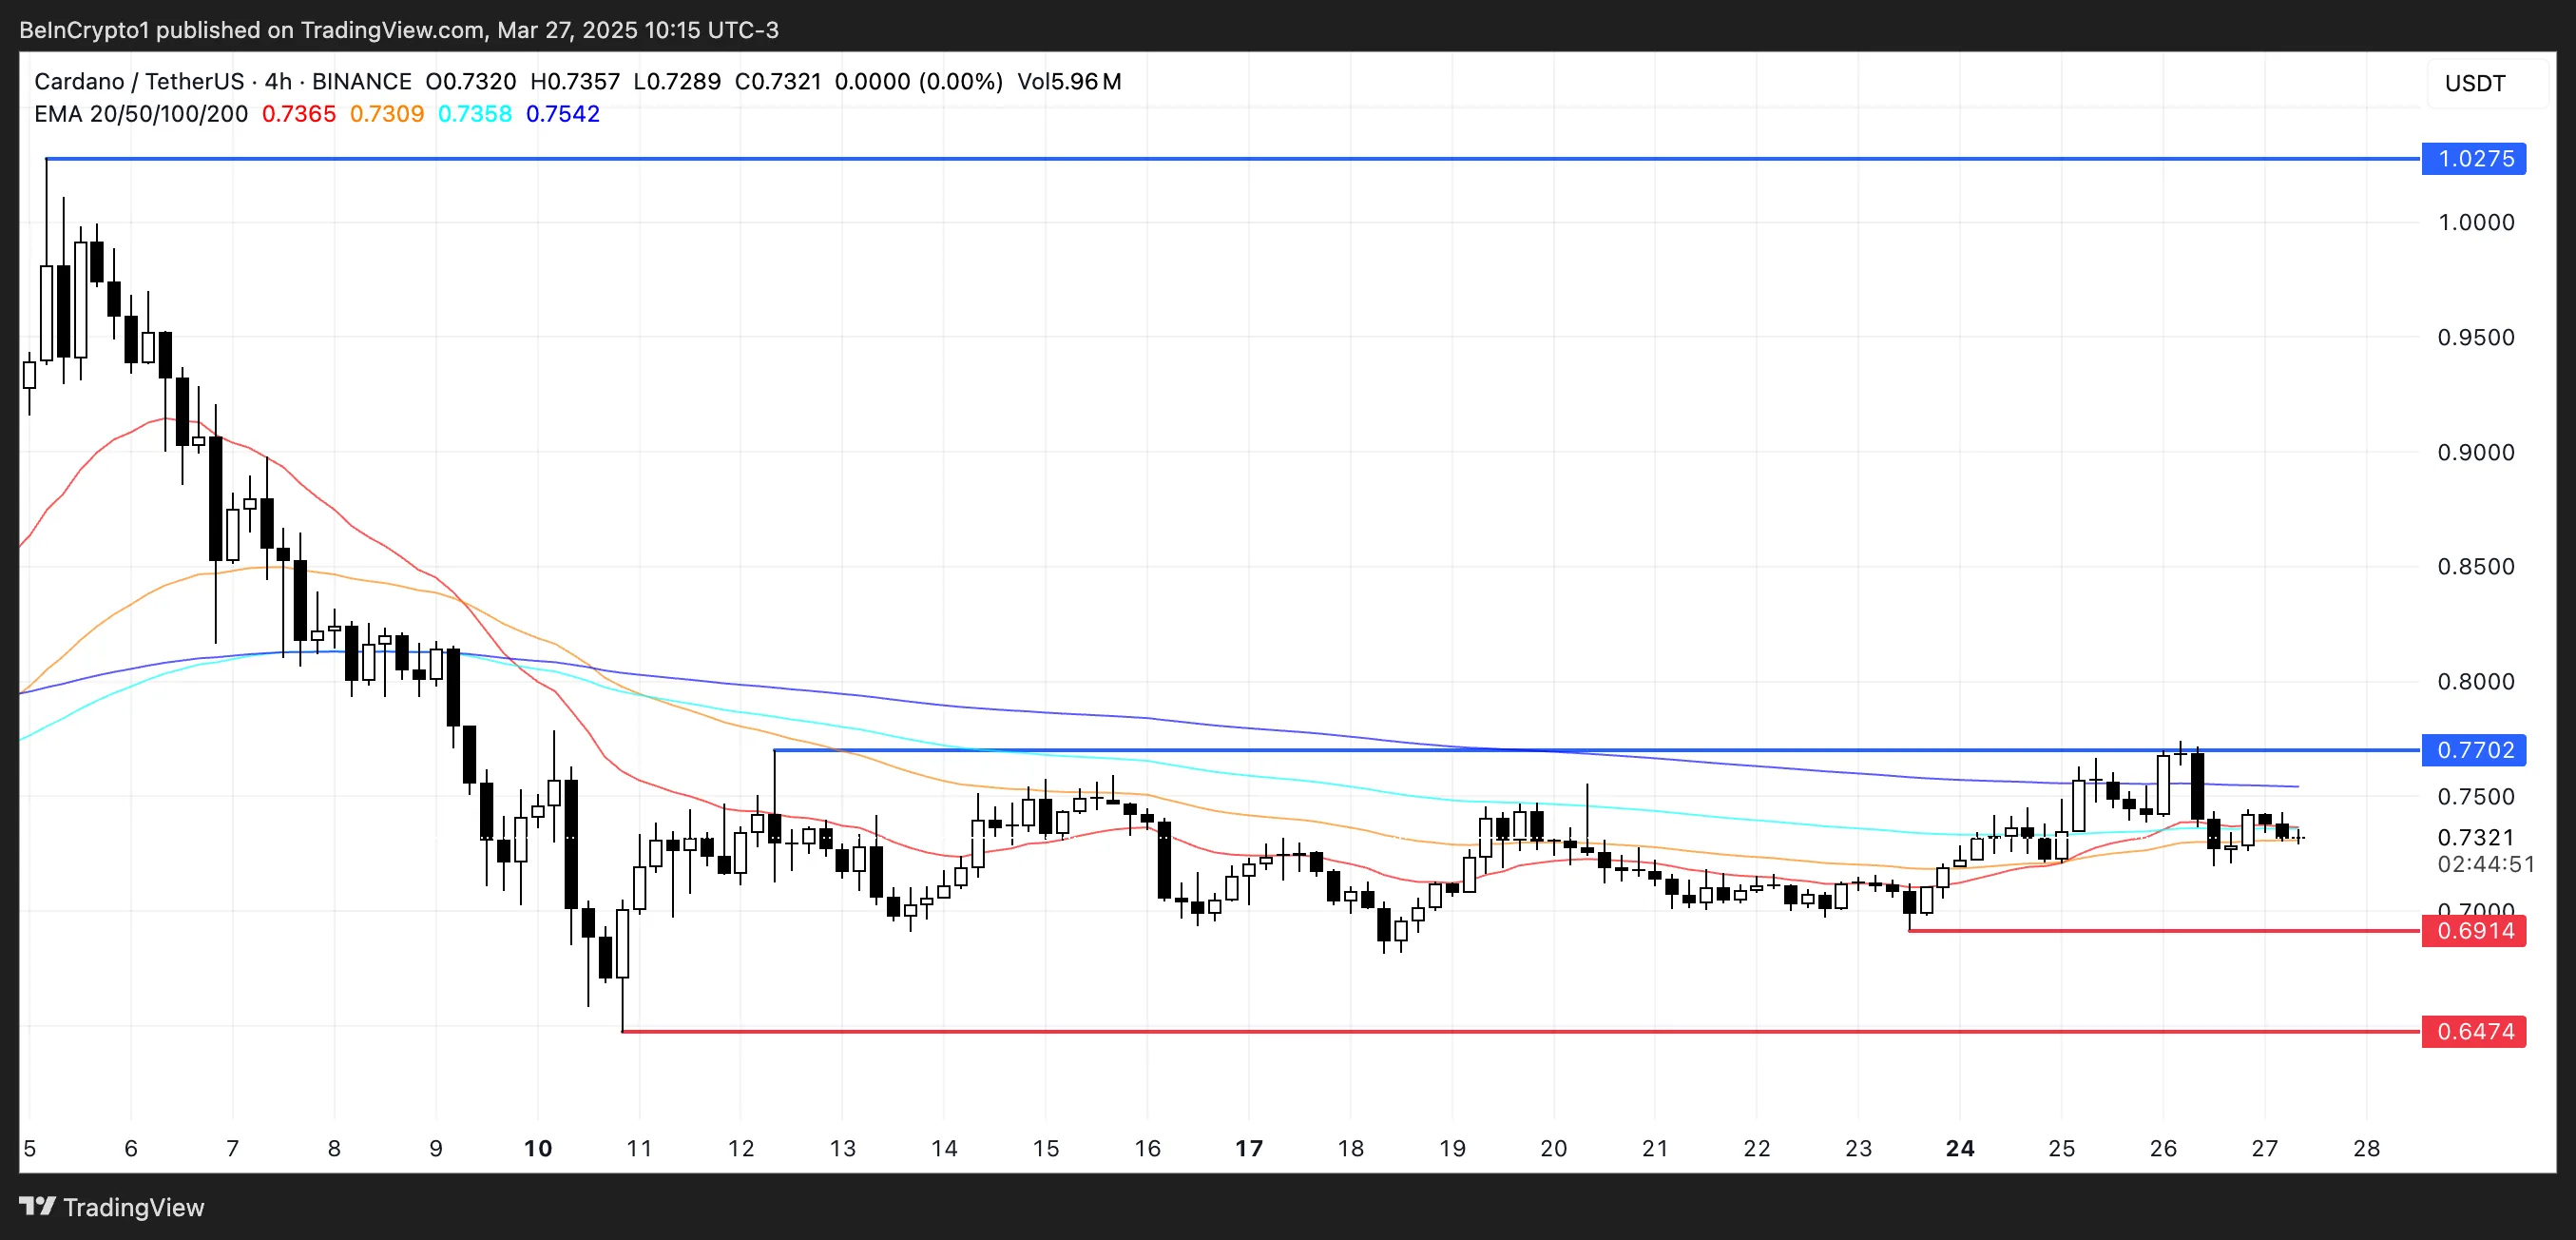
However, if ADA can reclaim its upward momentum, there’s still room for a bullish reversal. A renewed push toward the $0.77 resistance level could bring a breakout scenario back into play.
If that level is breached with strong volume, it could open the door for a rally toward the $1.02 region—taking Cardano above the $1 mark for the first time since early March.
Such a breakout would likely be supported by a bullish crossover in the DMI lines and a strengthening ADX, confirming a new upward trend.
Disclaimer
In line with the Trust Project guidelines, this price analysis article is for informational purposes only and should not be considered financial or investment advice. BeInCrypto is committed to accurate, unbiased reporting, but market conditions are subject to change without notice. Always conduct your own research and consult with a professional before making any financial decisions. Please note that our Terms and Conditions, Privacy Policy, and Disclaimers have been updated.

Binance Announces Vote To List Results, Set To List MUBARAK, BROCCOLI, TUT, BANANA
Binance To List MUBARAK, BROCCOLI, BANANAS31, and Tutorial

Dogecoin Price Prediction: Here’s What Needs To Happen For DOGE To Recover Above $0.3

Should You Buy Movement (MOVE) For April 2025?
Can Cardano (ADA) Reach Back to $1 in April?
3 Altcoins Poised for a Move on Trump’s Liberation Day

2.52 Million Altcoins Are Ruining Crypto’s Future

Animoca Brands Valuation Tanks 75% In Two Years, Here’s Why

Crypto exchange BingX hacked for $43 million

Are The Big Players Losing Interest?

Hong Kong’s Securities Association Tips Authorities On Crypto Self-Regulation

Coinbase cbBTC Set to go Live on Solana
2.52 Million Altcoins Are Ruining Crypto’s Future
Animoca Brands Valuation Tanks 75% In Two Years, Here’s Why
Crypto exchange BingX hacked for $43 million
Are The Big Players Losing Interest?
Hong Kong’s Securities Association Tips Authorities On Crypto Self-Regulation
Coinbase cbBTC Set to go Live on Solana
-

 Market21 hours ago
Mantra (OM) Price Risks Further Drop as Death Cross Nears
-
 Altcoin21 hours ago
Crypto Price Today: BTC, ETH, SOL, XRP, SHIB, DOGE, LINK, PEPE, ADA
-
 Market20 hours ago
Top 3 Base Altcoins to Watch Closely This Week
-

 Market19 hours ago
Bitcoin Price Finds Support—But Can It Power Through $90K?
-

 Ethereum24 hours ago
Ethereum Reclaims Realized Price – Bulls Face Strong Resistance At $2,300
-

 Bitcoin23 hours ago
GameStop Will Invest $1.3 Billion in Its First Bitcoin Purchase
-

 Market23 hours ago
US State Wyoming to Launch WYST Stablecoin With LayerZero
-
 Altcoin23 hours ago
Why Is Bitcoin, Ethereum, Solana & Dogecoin Price Falling Today?