
Market
32% Loss in a Week Amid Heavy Sell-Offs

PI has been in a persistent downtrend since the start of March. With bearish pressure intensifying over the past week, the token has shed 32% of its value in seven days.
Further losses appear likely as selling pressure strengthens among PI market holders.
PI Bulls Struggle as Trading Activity Plummets
PI currently trades at $1.17, noting a 1% price rise over the past day. Despite this modest uptick, PI’s declining trading volume suggests that the slight rebound is not backed by strong demand for the altcoin. It merely mirrors the broader market growth recorded over the past 24 hours.
During the review period, PI’s trading volume totals $366 million, down 37%. When an asset’s price rises while trading volume declines, it suggests that the upward movement lacks strong buyer participation, making the rally weak or unsustainable.
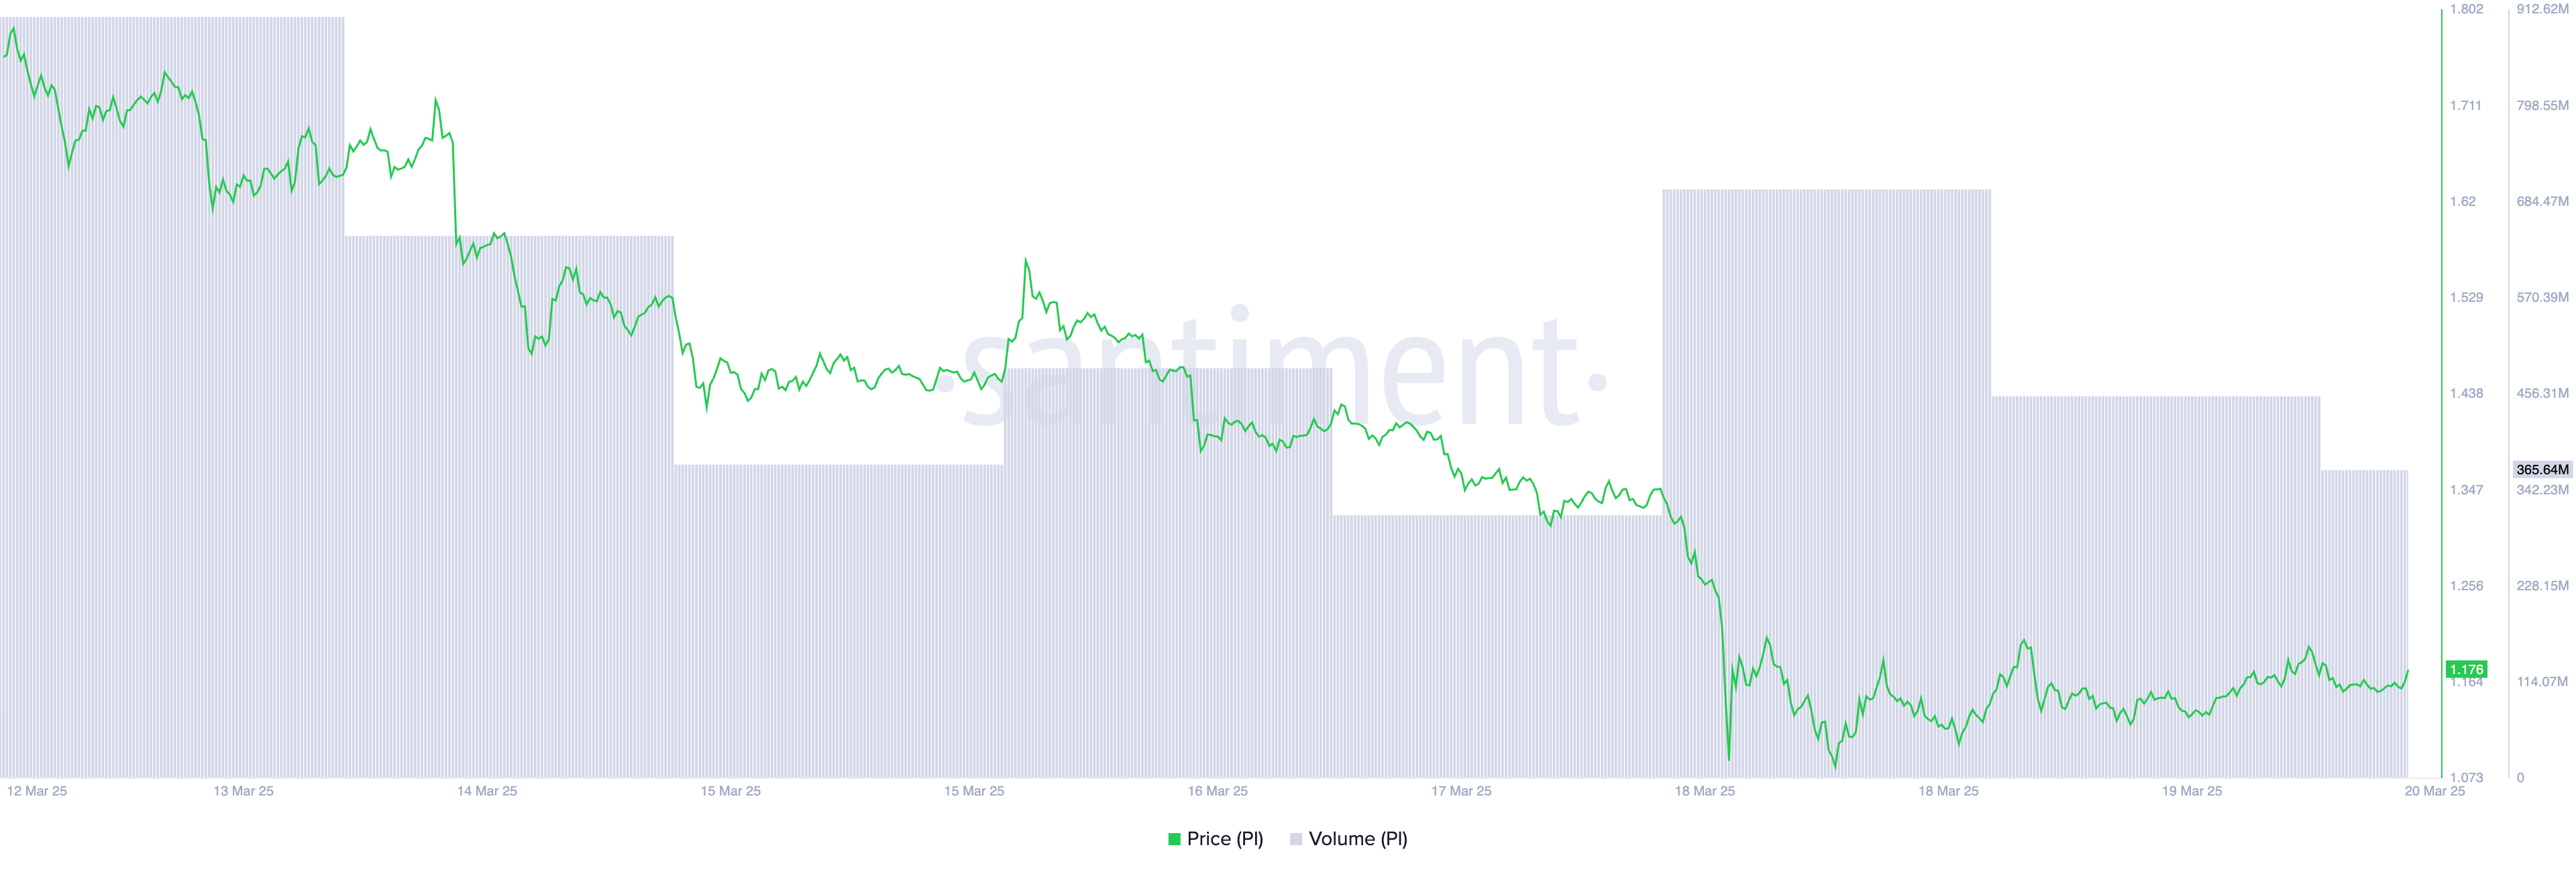
This indicates reduced market interest, as fewer PI traders are supporting the increase. If volume does not pick up, the token’s price may struggle to maintain its gains and could resume its decline.
Further reinforcing the negative outlook, PI’s BBTrend remains in the red, confirming that bearish forces are firmly in control. Observed on a four-hour chart, the momentum indicator is at -32.45, the lowest it has ever been since PI launched.
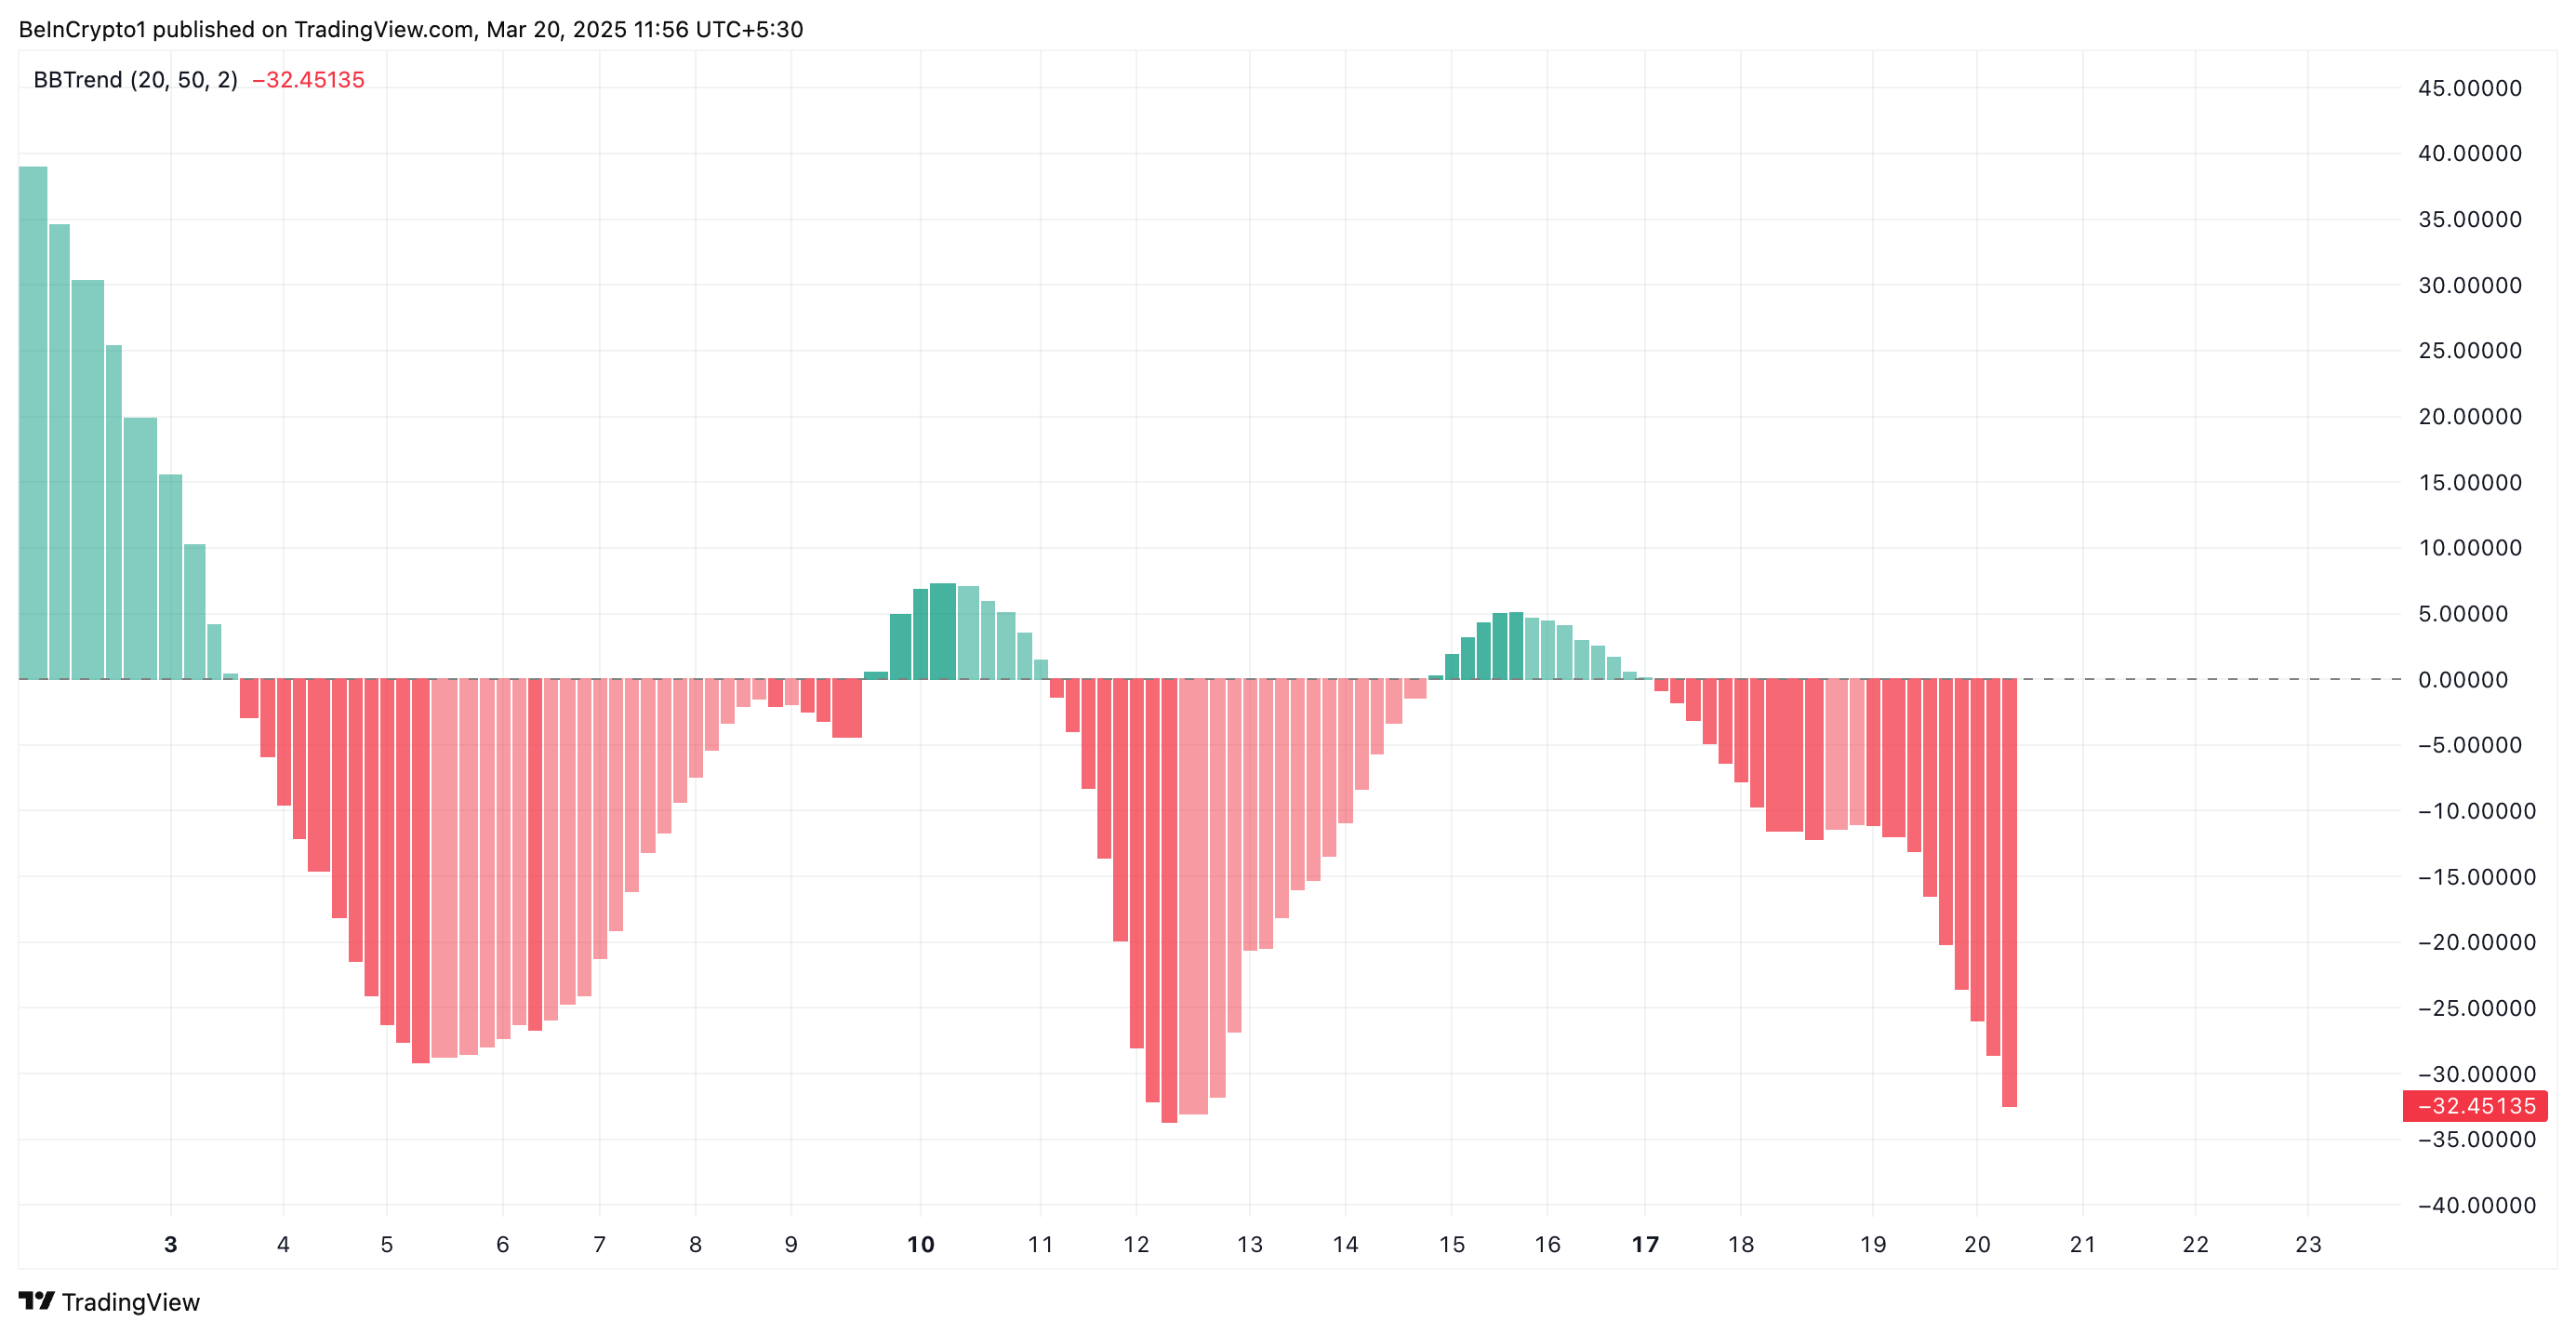
The BBTrend indicator measures the strength and direction of an asset’s price movement in relation to the Bollinger Bands. A positive BBTrend value signals an uptrend, indicating that prices are pushing toward the upper band with strong momentum.
Conversely, a negative BBTrend value indicates a downtrend, suggesting that the asset is trading closer to the lower band, with bearish pressure prevailing.
When an asset’s BBTrend is deep in negative territory like PI’s, it indicates a strong and persistent downtrend, with sellers firmly in control. This suggests that PI’s price declines are not just short-term corrections but part of a broader bearish trend accompanied by significant volatility.
PI Holds Critical $1.11 Support—Will Bulls Prevent a Drop to $0.87?
PI currently holds above the support formed at $1.11. If selloffs intensify, the bulls might be unable to defend this support floor, causing the token’s price to plummet to $0.87.
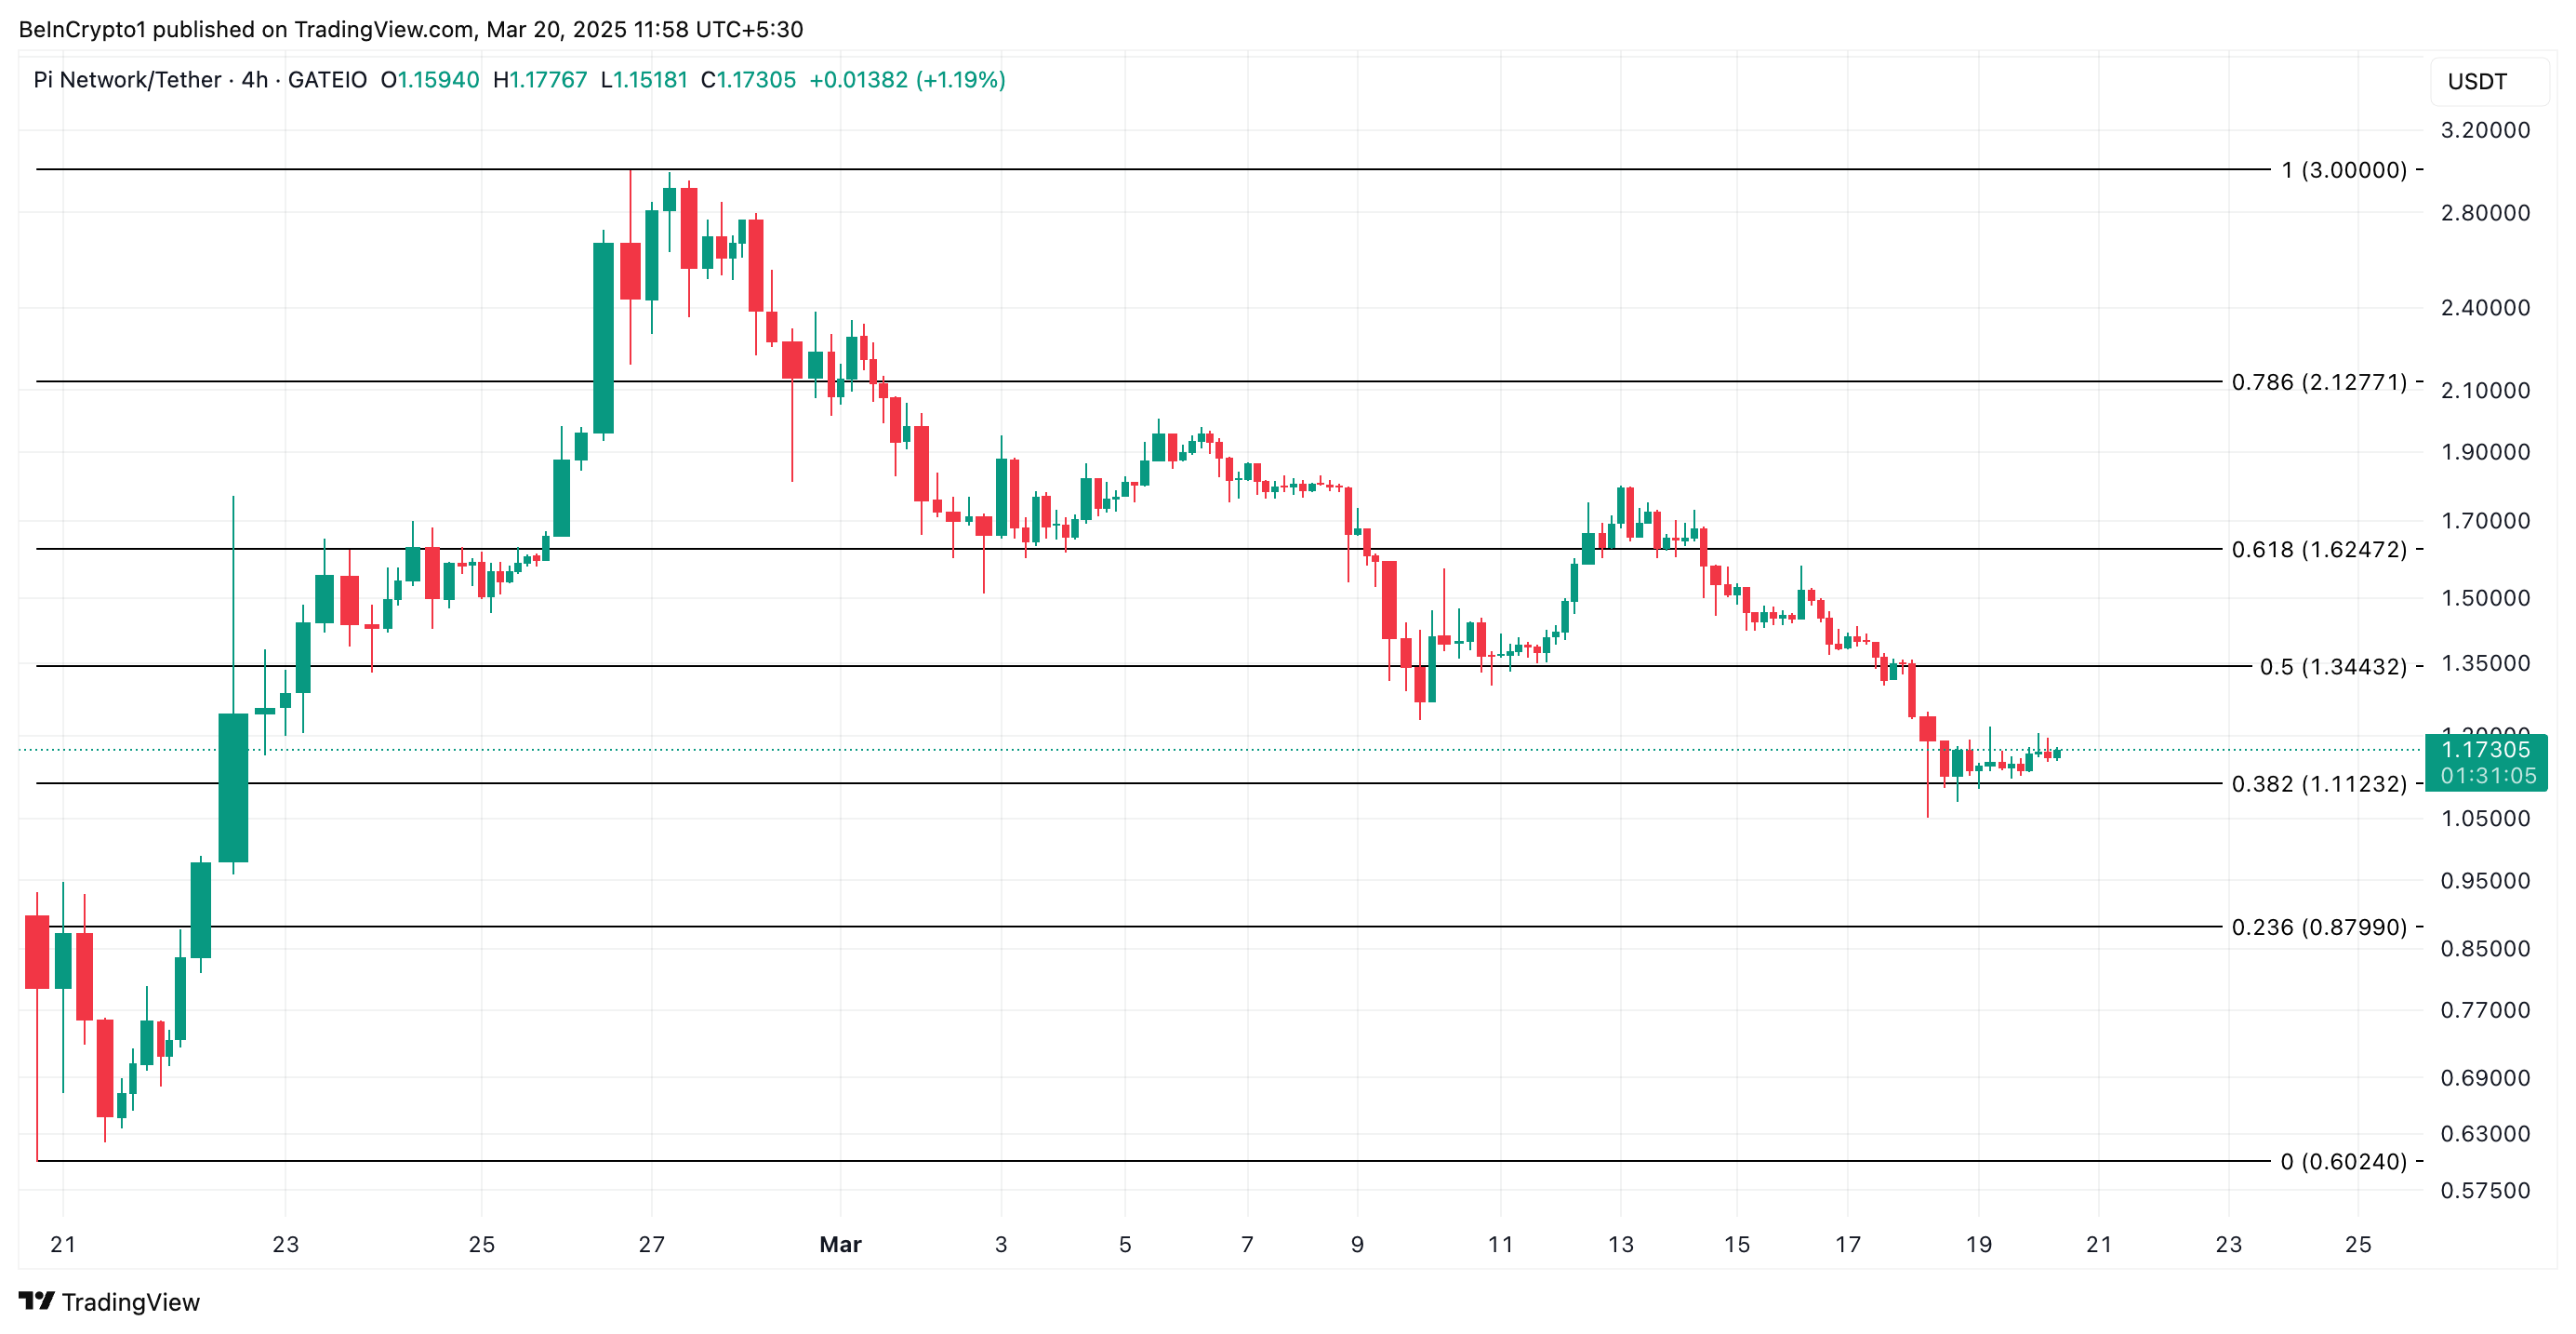
On the other hand, a positive shift in market sentiment and a resurgence in new demand for PI would invalidate this bullish projection. In that scenario, the token’s price could resume its rally and climb toward $1.34.
Disclaimer
In line with the Trust Project guidelines, this price analysis article is for informational purposes only and should not be considered financial or investment advice. BeInCrypto is committed to accurate, unbiased reporting, but market conditions are subject to change without notice. Always conduct your own research and consult with a professional before making any financial decisions. Please note that our Terms and Conditions, Privacy Policy, and Disclaimers have been updated.


XRP’s price reaction has remained muted following the US Securities and Exchange Commission’s (SEC) decision to drop its lawsuit against Ripple.
The bearish sentiment against the altcoin continues to strengthen, signaling an extended period of potential price consolidation or a downturn.
Ripple’s Legal Win Fails to Ignite XRP Rally—What’s Holding It Back?
On March 19, the SEC dropped its appeal and lawsuit against Ripple Labs, ending the five-year-long legal battle. While many anticipated this significant development would trigger a bullish rebound for XRP, its performance has remained lackluster.
Market participants remain overwhelmingly bearish on the altcoin, keeping its price under persistent pressure. The decline in XRP whale accumulation highlights this bearish bias.
According to Santiment, large whales holding between 100 million and 1 billion XRP have offloaded a cumulative 20 million XRP, worth approximately $50 million, since March 19.
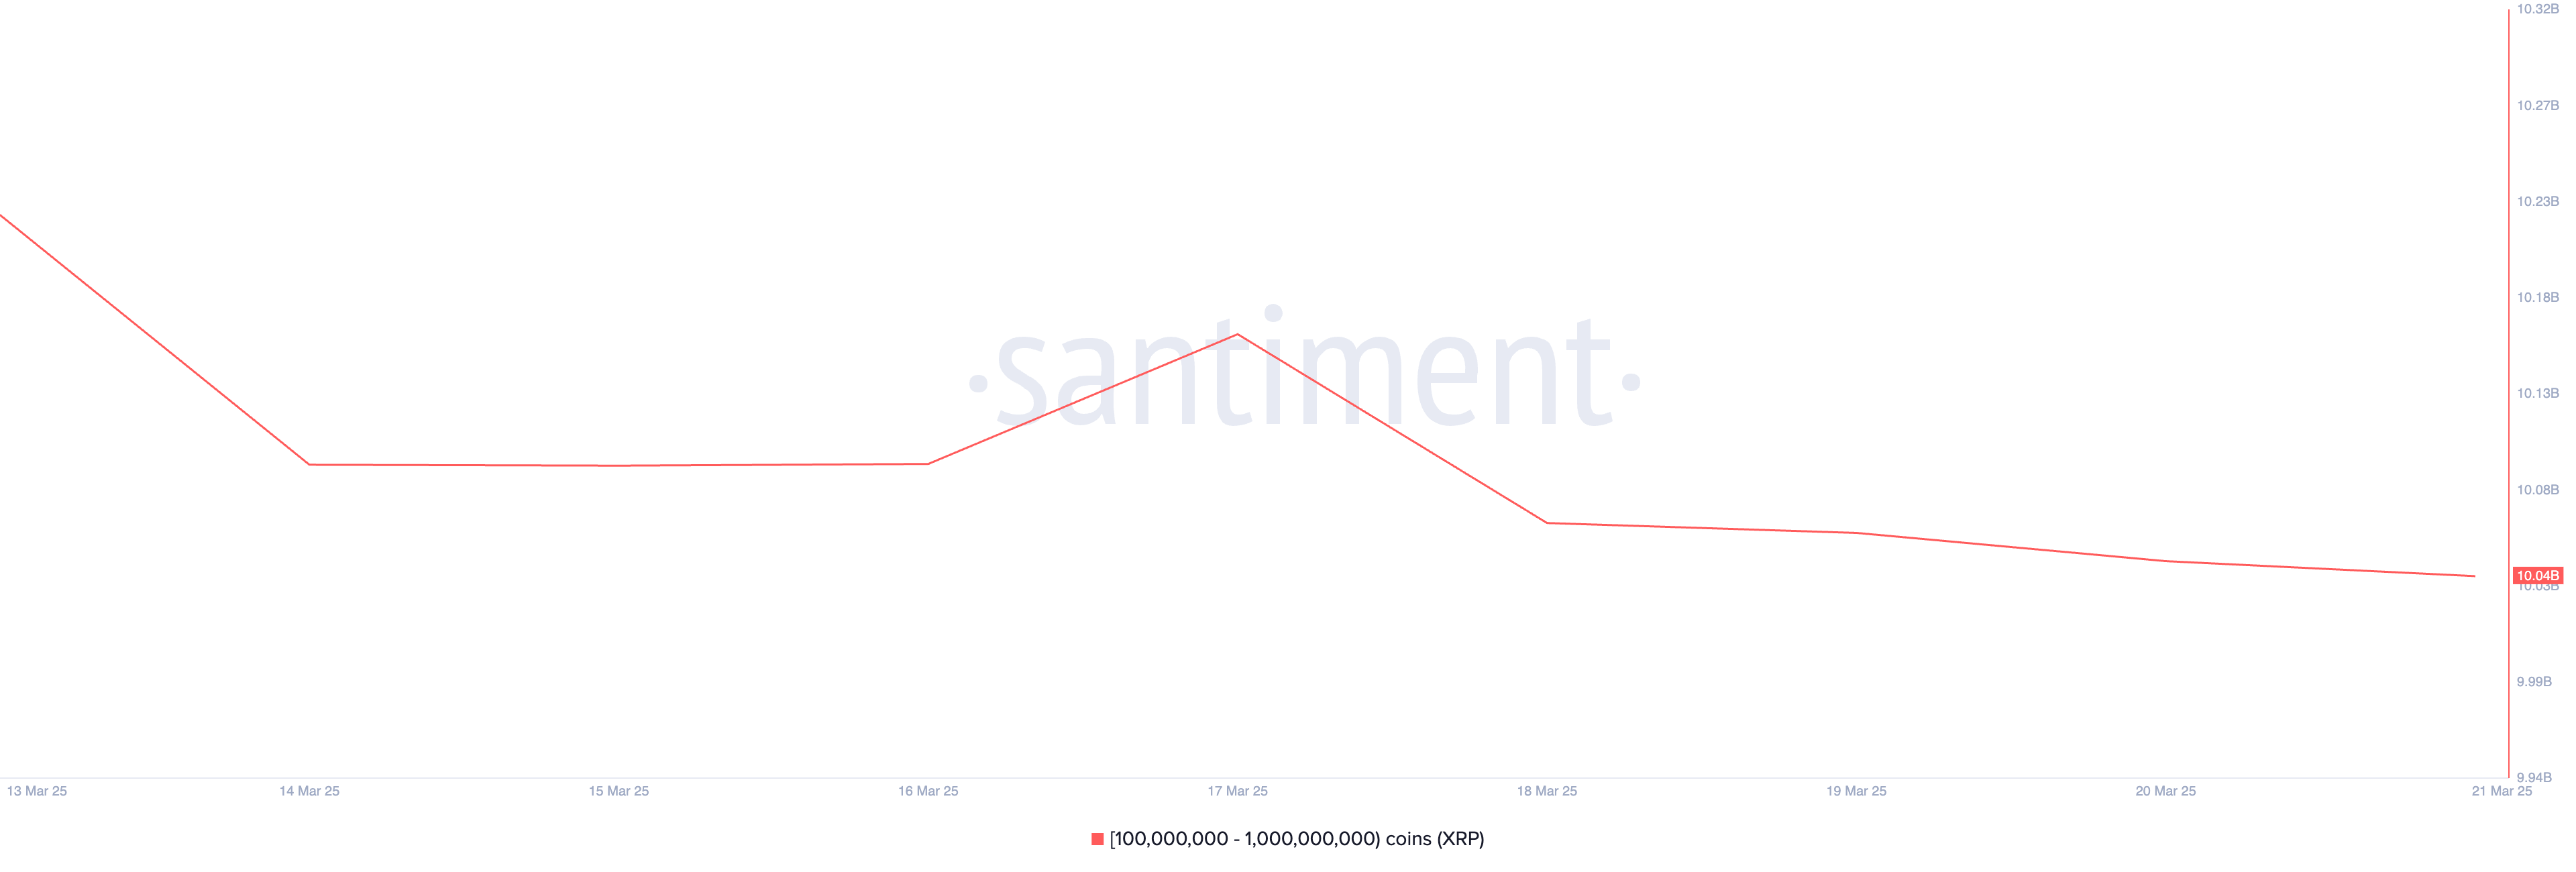
This sell-off is part of an ongoing distribution trend that began earlier this month and shows no signs of reversal even after the SEC’s decision. Despite Ripple’s legal victory, these major XRP holders have yet to regain confidence and resume accumulation.
Moreover, the token’s falling weighted sentiment reflects the bearish pressure in the XRP market. At press time, it is poised to break below the center line at 0.052.
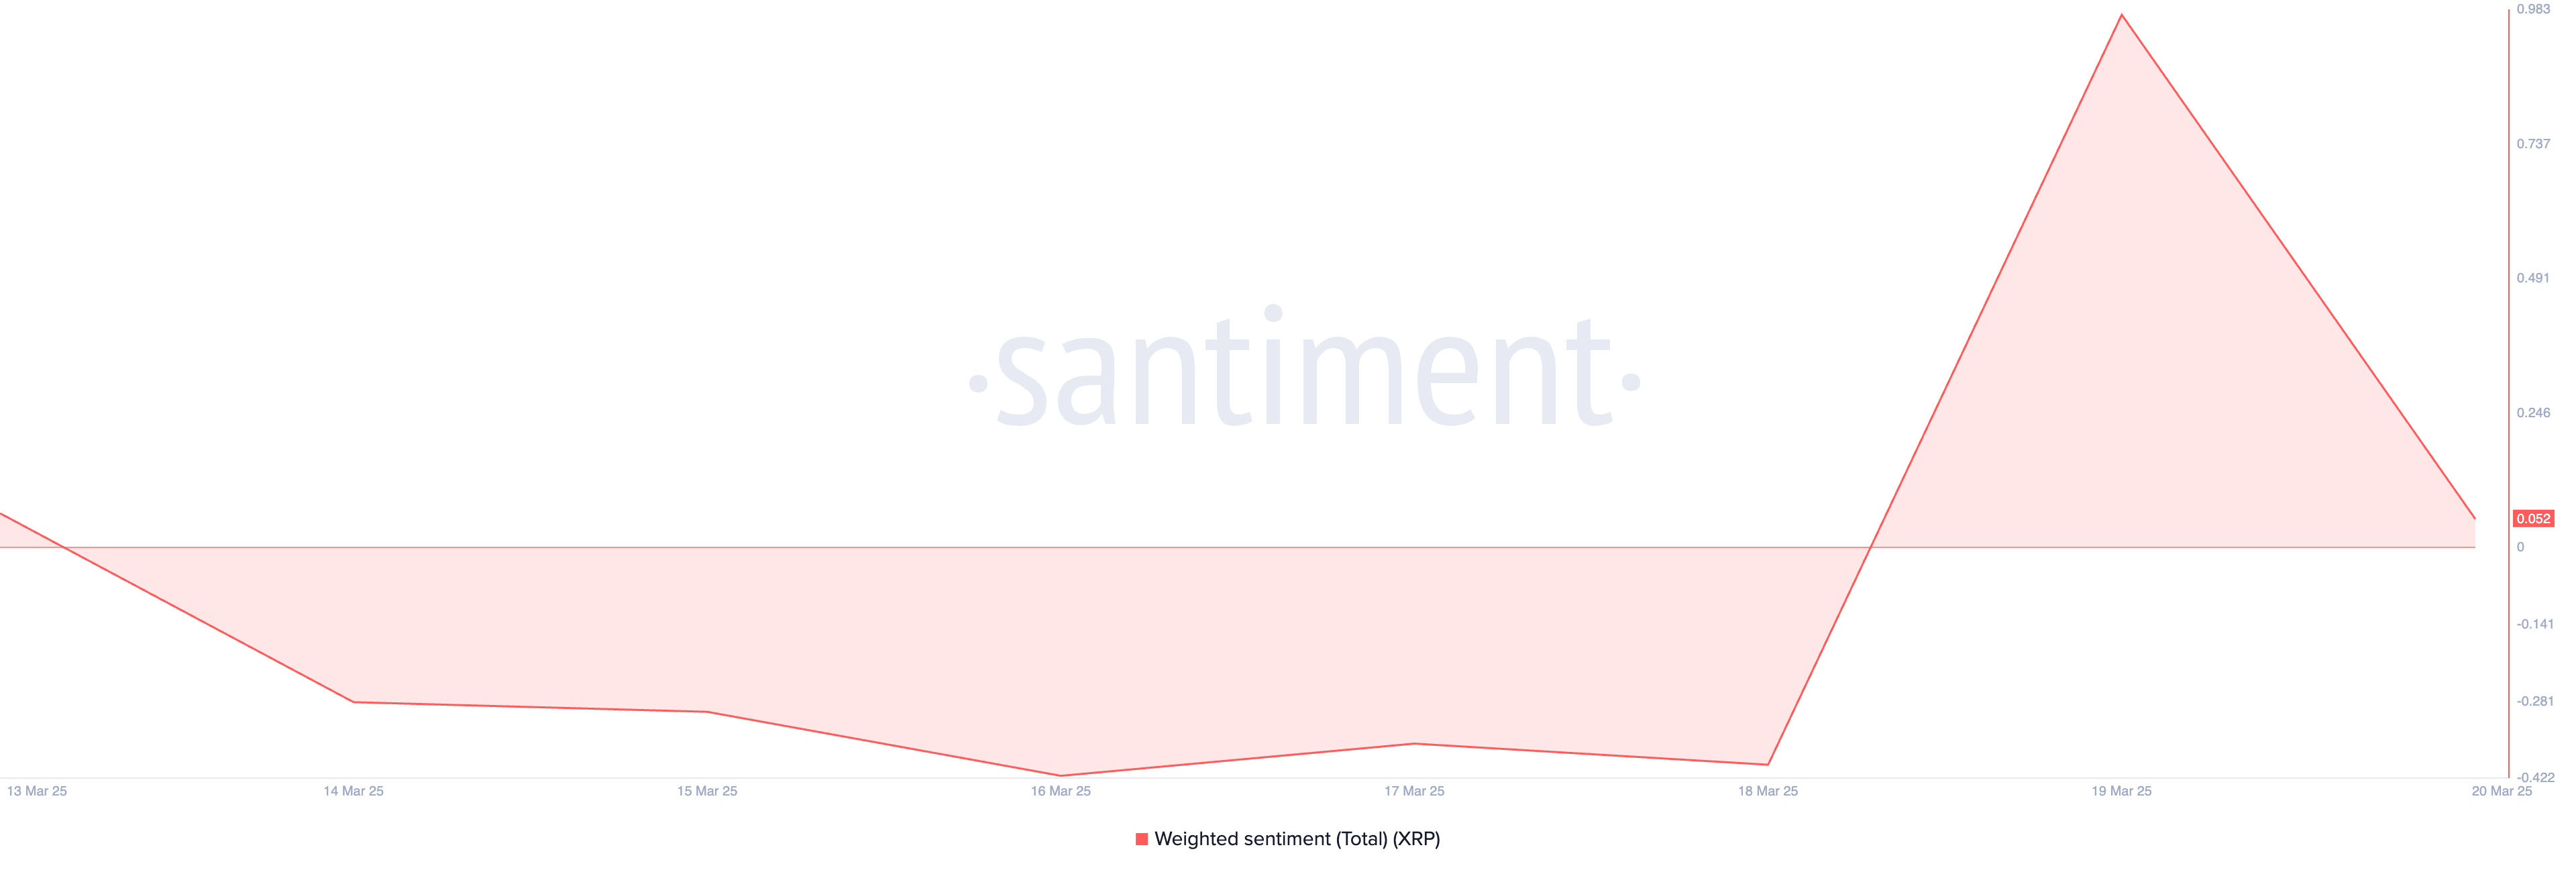
An asset’s weighted sentiment measures its overall positive or negative bias, considering both the volume of social media mentions and the sentiment expressed in those mentions. It is a bearish signal when it attempts to fall into the negative territory.
It means that XRP investors are increasingly skeptical about the token’s near-term outlook. This prompts them to trade less, worsening the token’s decline.
XRP at a Crossroads: Rally to $2.61 or Drop to $1.47?
XRP exchanges hands at $2.39, trading above the support floor at $2.13. If bearish sentiment lingers, the token could experience a pull toward this low. Should the bulls fail to defend this support, XRP’s price could fall further to $1.47.
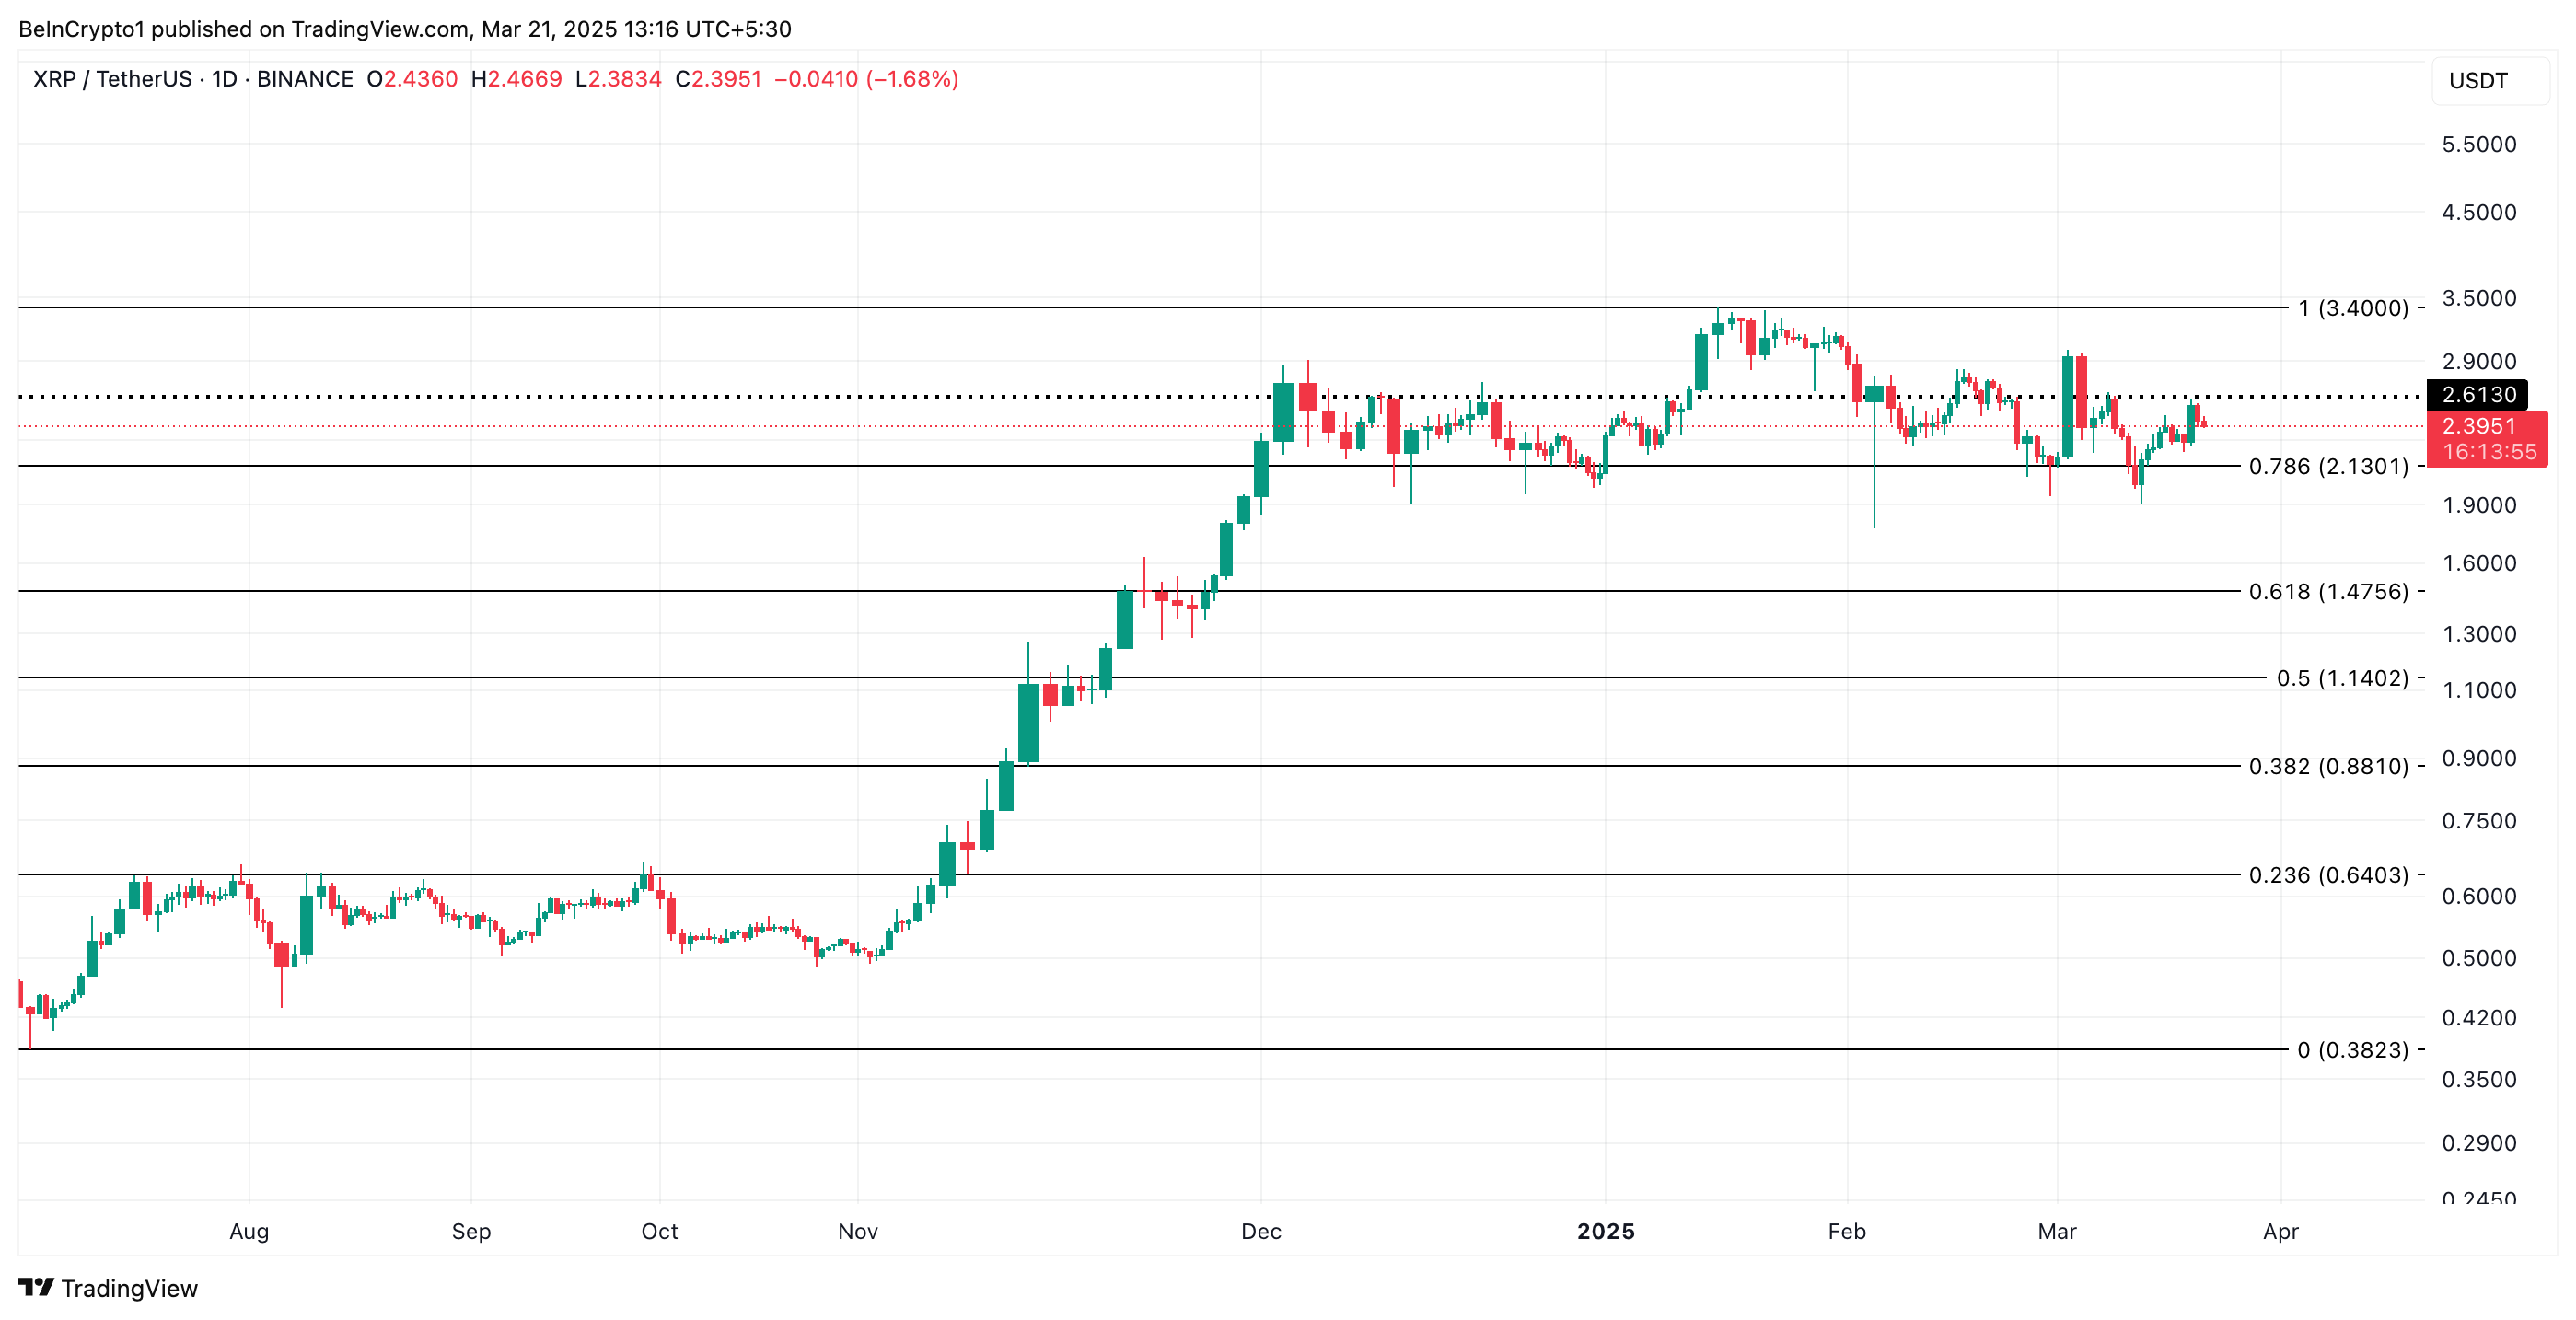
Conversely, a resurgence in bullish bias would invalidate this bearish projection. If XRP demand spikes and profit-taking stalls, its price could climb to $2.61.
Disclaimer
In line with the Trust Project guidelines, this price analysis article is for informational purposes only and should not be considered financial or investment advice. BeInCrypto is committed to accurate, unbiased reporting, but market conditions are subject to change without notice. Always conduct your own research and consult with a professional before making any financial decisions. Please note that our Terms and Conditions, Privacy Policy, and Disclaimers have been updated.
Despite the strong performance last year, the market’s volatility has shifted the outlook for Bitcoin exchange-traded funds (ETFs) in 2025. A series of major sell-offs have wiped out nearly all the inflows the ETFs received earlier in 2025.
This downturn coincides with Bitcoin’s continued price decline, leaving the ETFs struggling to maintain their momentum as investor sentiment shifts.
Bitcoin ETFs Face Major Setback in 2025
According to a recent post by Bread & Butter on X (formerly Twitter), Bitcoin ETFs had a promising start to the year. Between January 1 and February 7, they saw cumulative inflows of $5.7 billion.
However, a substantial sell-off quickly followed, erasing $5.3 billion of those gains. As a result, net inflows for the year plunged to a low of $106 million.
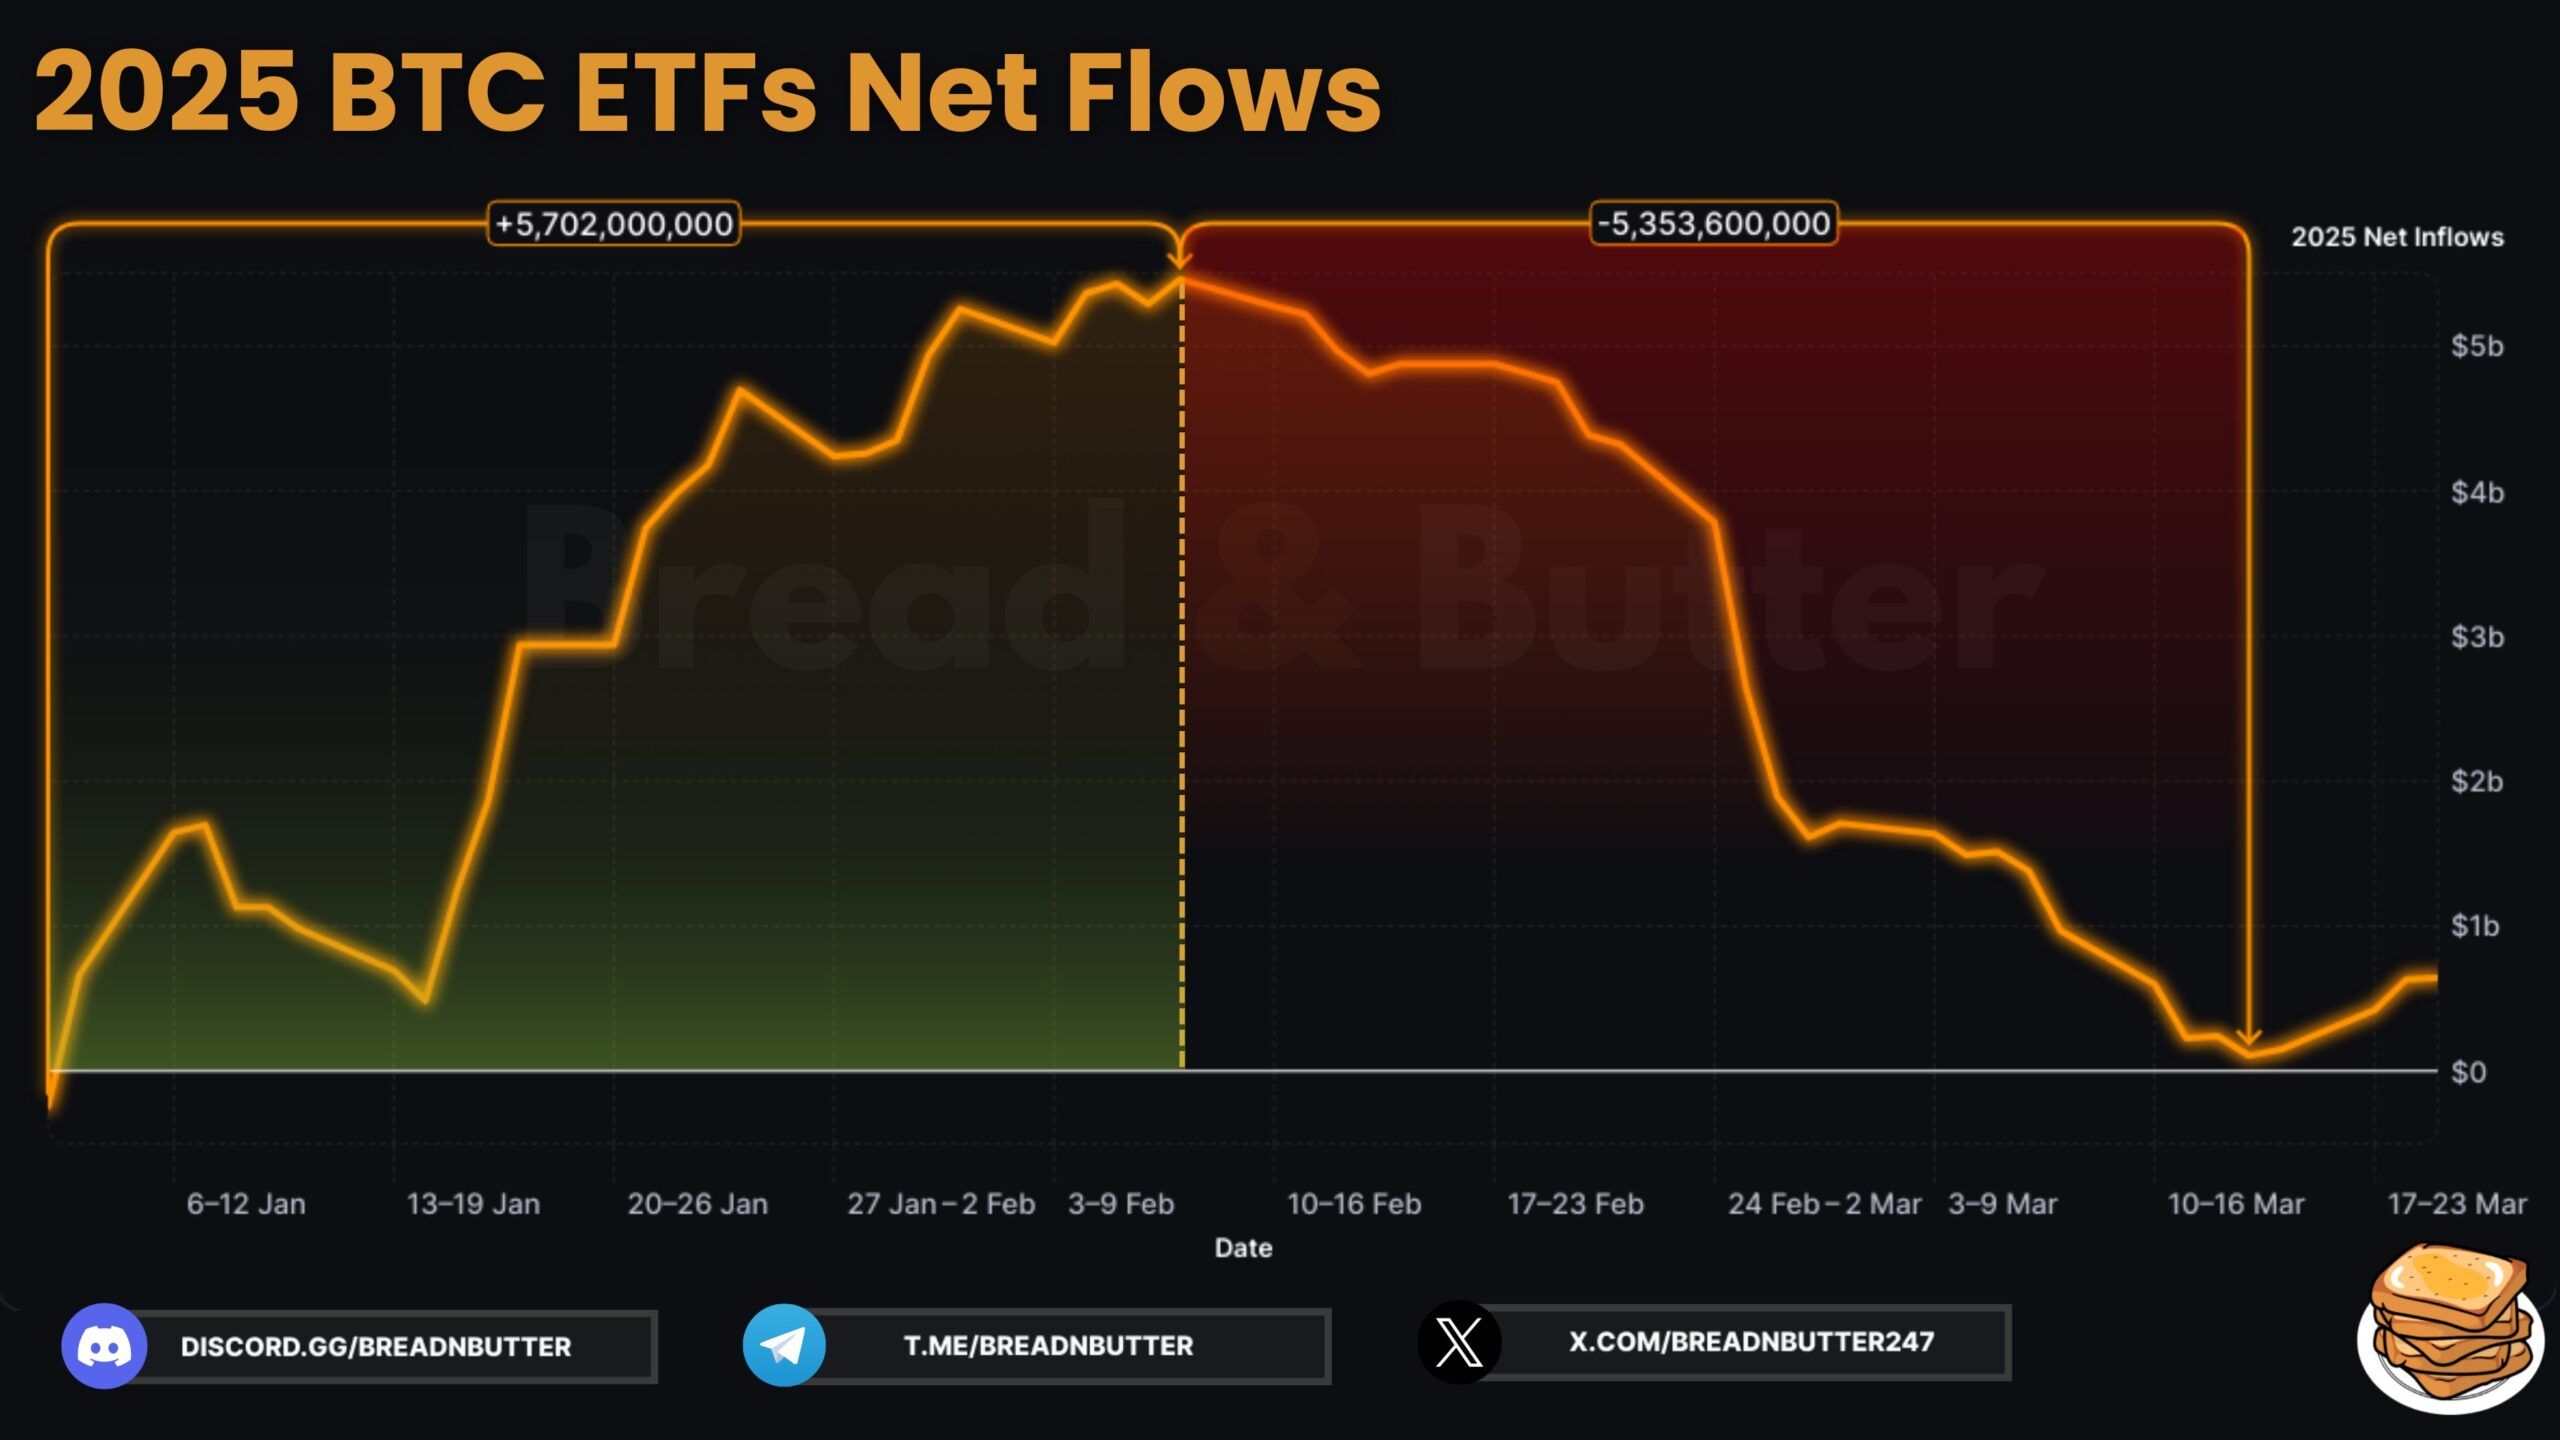
In fact, the largest weekly net outflow was recorded in the final week of February, at $2.7 billion. That’s not all. Since the ETFs began trading, they have experienced outflows in three separate months. February stands out as the most significant, with a staggering $3.5 billion recorded as the largest monthly outflow to date.
Nonetheless, the post revealed a positive shift, noting that inflows into Bitcoin ETFs have resumed. Since March 14, the ETFs have recorded consecutive days of inflows, pushing the year-to-date net inflows to over $600 million.
Notably, on March 17, BTC ETFs recorded their highest single-day inflow in 41 days. Amid this renewed momentum, BeInCrypto highlighted that asset managers Fidelity and ARK Invest were acquiring substantial amounts of Bitcoin, contributing to a bullish trend.
As of the latest data, the daily total net inflow reached $165.7 million on March 20. Yet, this growth was uneven across the 11 ETFs.
Only four recorded inflows, with iShares Bitcoin Trust ETF (IBIT), leading at $172.1 million, followed by Fidelity Wise Origin Bitcoin Fund (FBTC) with $9.2 million, Grayscale Bitcoin Mini Trust ETF (BTC) with $5.2 million, and VanEck Bitcoin ETF(HODL) with $11.9 million.

Meanwhile, four ETFs saw zero flows, and three—Grayscale Bitcoin Trust(GBTC), Bitwise Bitcoin ETF (BITB), and Franklin Templeton Digital Holdings Trust (EZBC)—experienced outflows, reflecting a mixed market performance.
“It remains to be seen whether this marks the beginning of a sustained rebound or just a temporary relief,” the post read.
This comes as Bitcoin’s price continues to navigate turbulent waters. The cryptocurrency has faced significant setbacks due to shifting macroeconomic conditions, leading to a notable decline.
According to BeInCrypto data, BTC has depreciated by 12.1% over the past month and 2.0% in the last 24 hours alone. At press time, it was trading at $84,147.

However, analysts suggest that the worst may be over. Arthur Hayes, former CEO of BitMEX, pointed to a potential bullish shift, citing his custom US bank credit supply index, which was moving upwards.
“Doesn’t mean we are done dumping but the odds are shifting more bullish,” he said.
Market observers have also compared Bitcoin to gold. They predict that BTC may follow a similar trajectory and emerge from its current “fakeout” phase. Others believe Bitcoin is in a bear trap that could soon end.
Disclaimer
In adherence to the Trust Project guidelines, BeInCrypto is committed to unbiased, transparent reporting. This news article aims to provide accurate, timely information. However, readers are advised to verify facts independently and consult with a professional before making any decisions based on this content. Please note that our Terms and Conditions, Privacy Policy, and Disclaimers have been updated.

Cardano has traded within a tight range over the past week as the broader crypto market attempts a recovery. It has faced resistance at $0.75 and found support at $0.69.
Despite the price consolidation, on-chain data reveals a strengthening bullish bias that could pave the way for an upward breakout.
Cardano Stuck in a Range—HODLing Points to a Potential Breakout
Amid ADA’s sideways price movements over the past week, investors have increased their holding times. According to IntoTheBlock, holding time has increased by 77% during the review period.
This trend signals a preference for hodling rather than short-term selling.
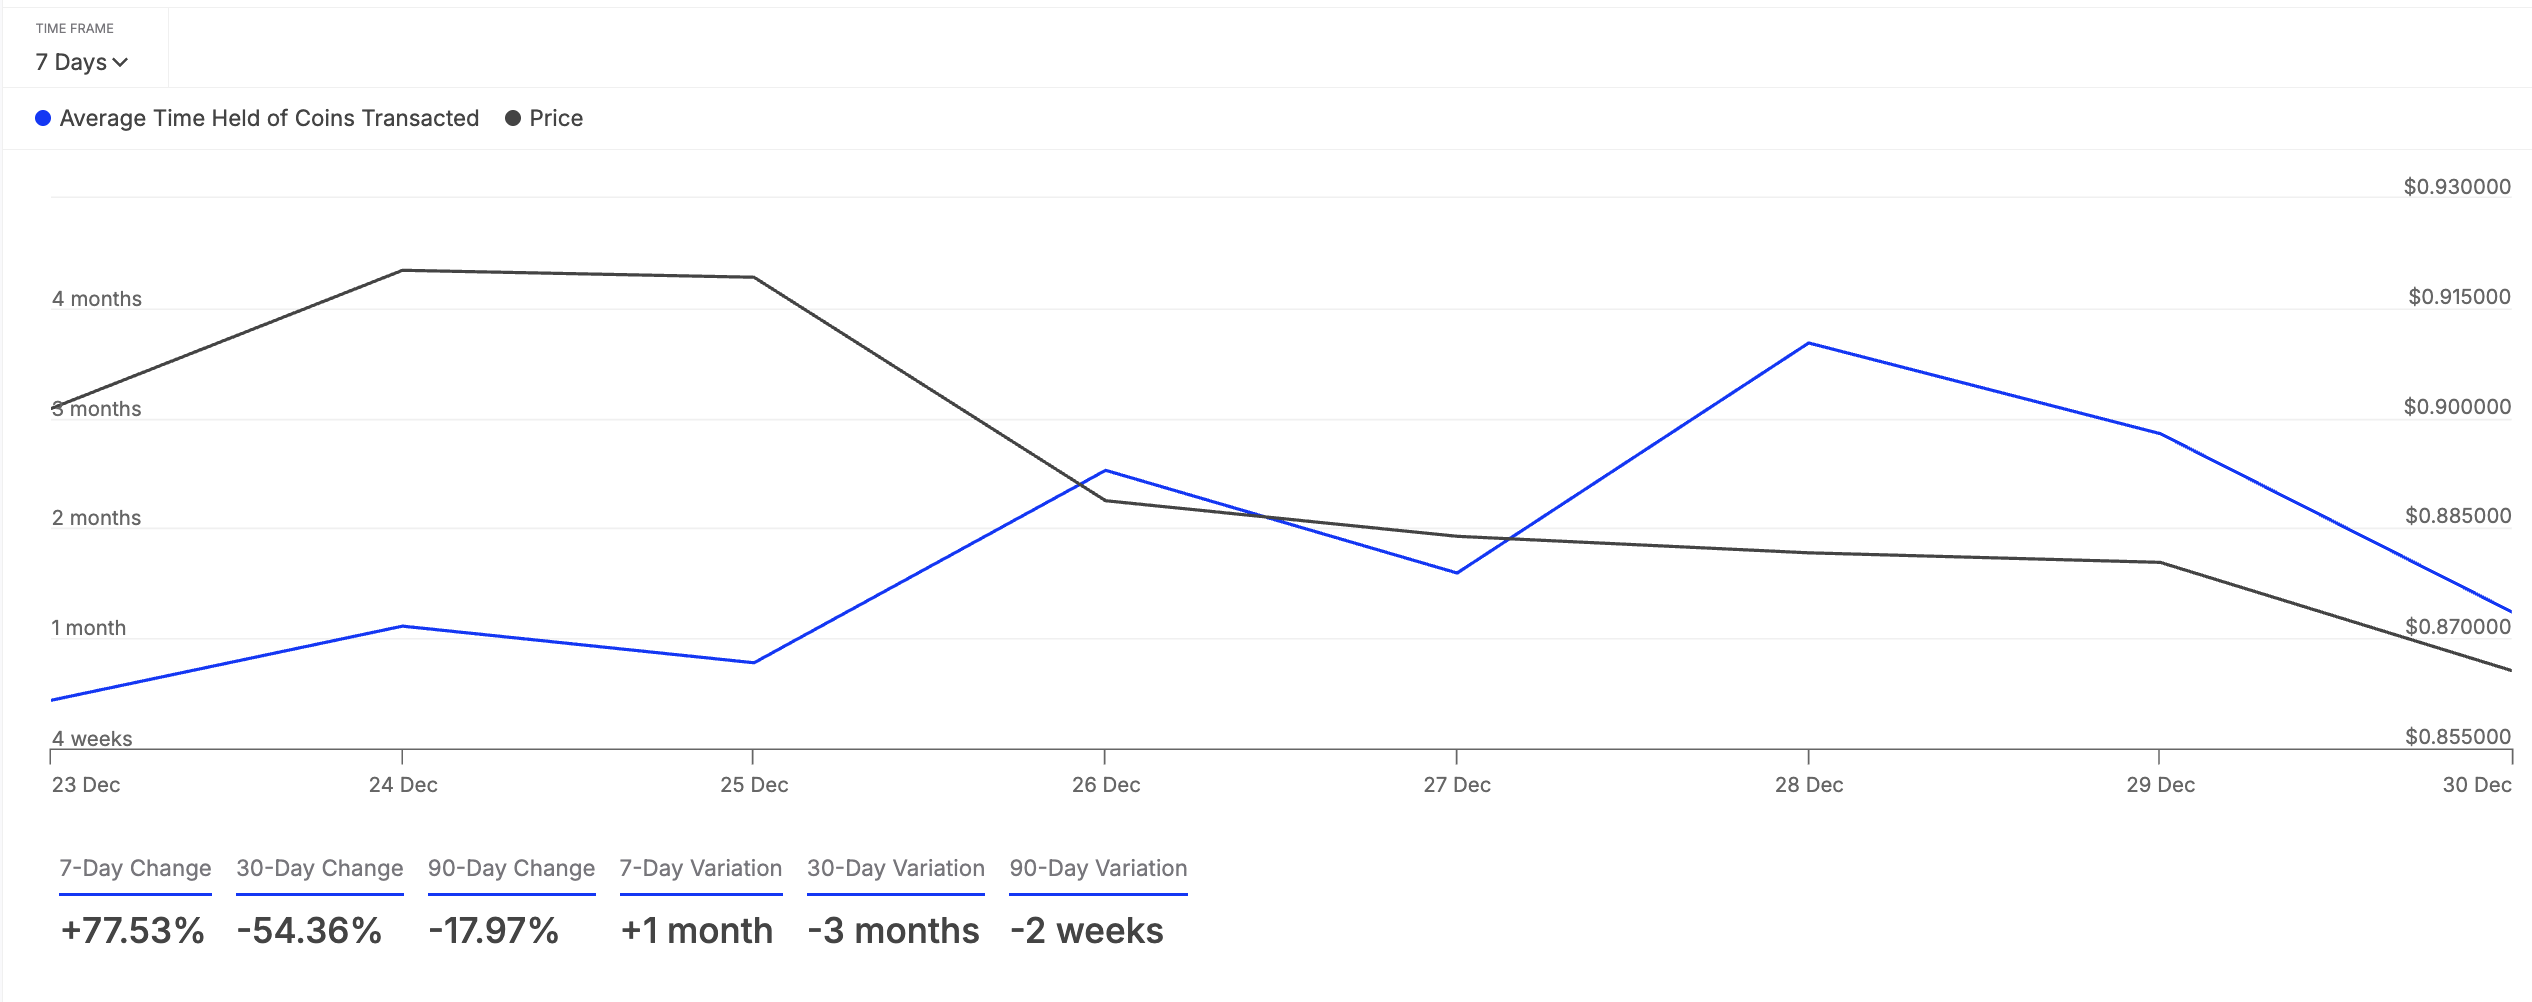
An asset’s coin holding time is a metric that tracks the average duration of time its tokens are held in wallet addresses before being sold or transferred.
As this time spikes, it signals Cardano holders are opting to hold onto their assets rather than sell. This suggests growing confidence in the asset’s long-term potential. If the trend persists, it could reduce selling pressure and cause ADA to attempt a break above the resistance at $0.75.
Additionally, ADA’s Network Realized Profit/Loss (NPL) remains negative, meaning most Cardano holders would incur losses if they sold now. At press time, this indicator stands at -2.33 million.
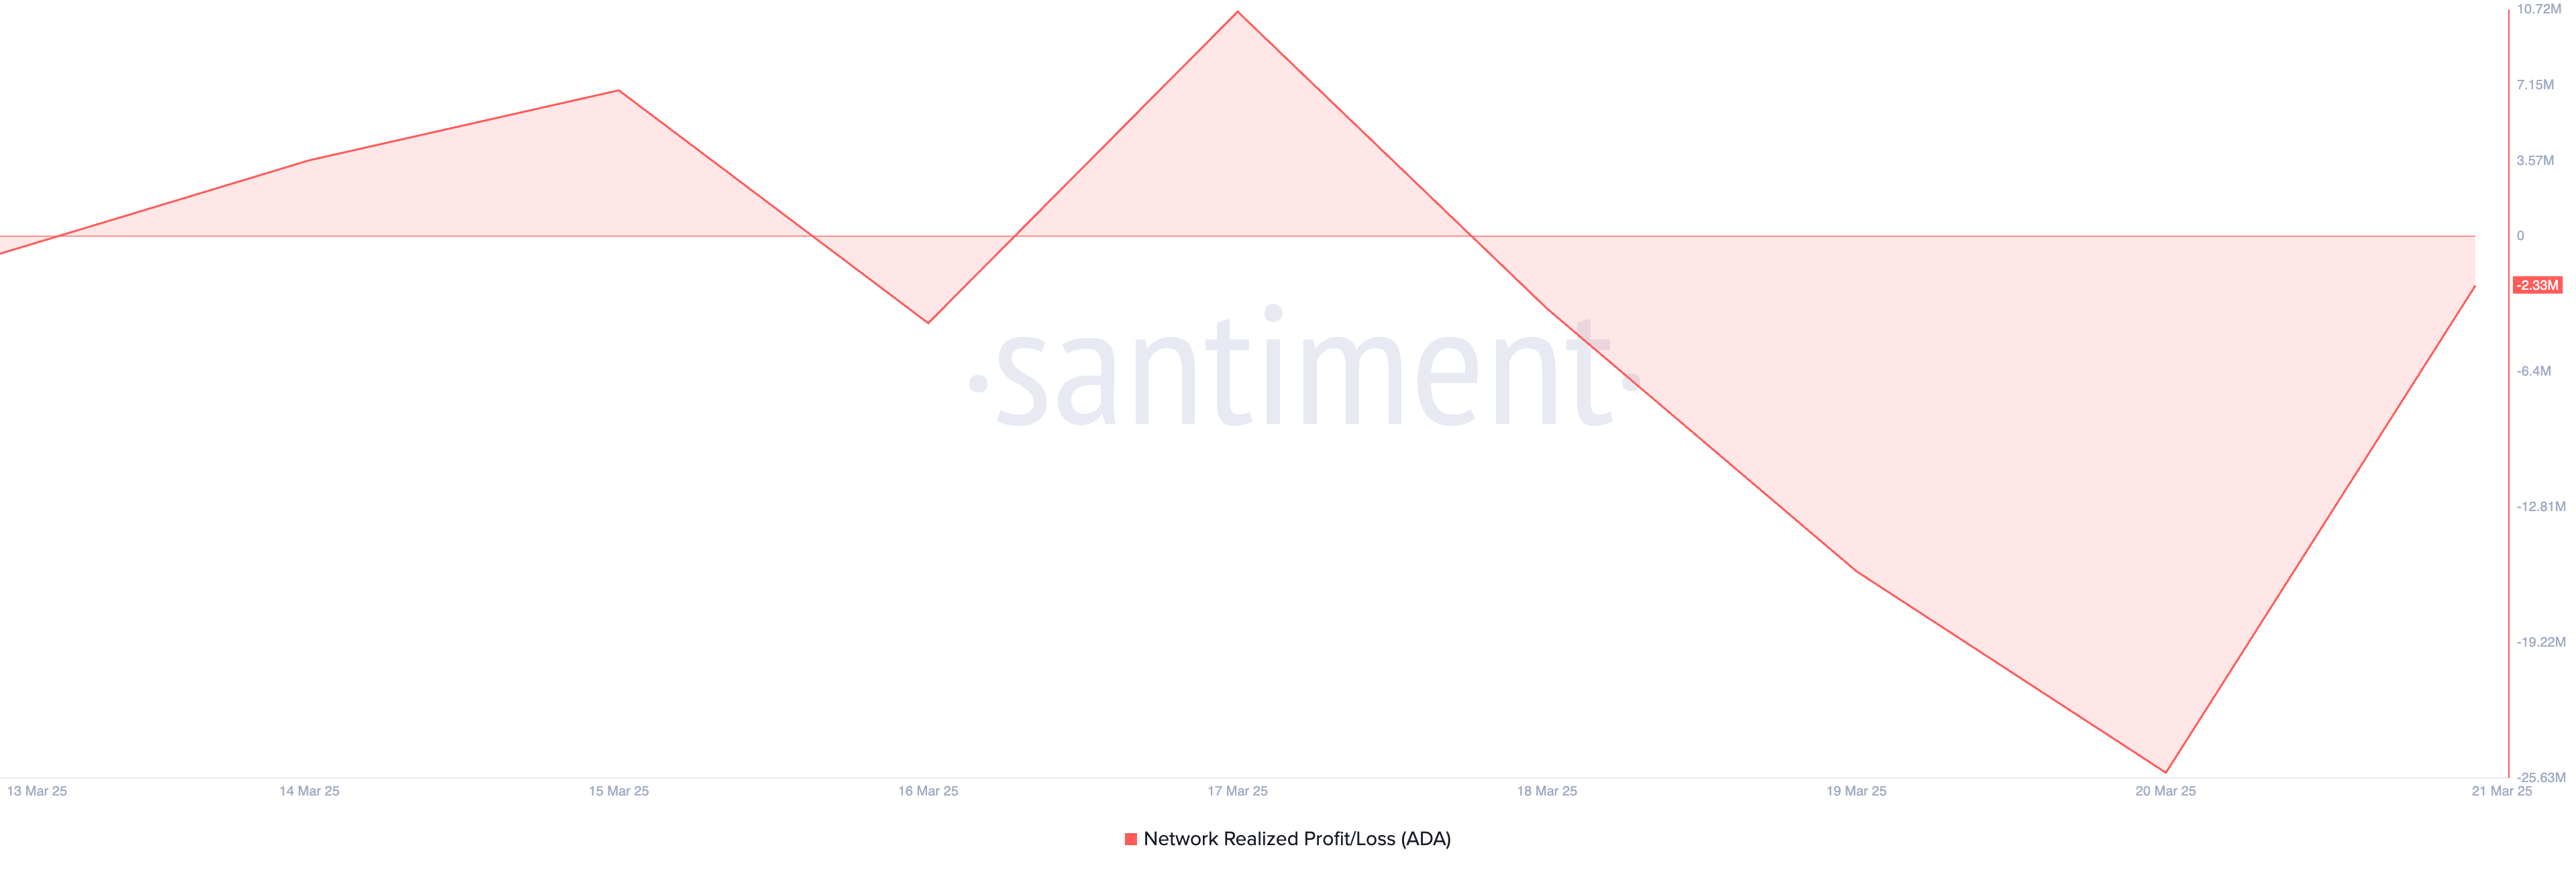
This metric measures the total profit or loss realized by investors when they move their coins on-chain, indicating overall market sentiment. When NPL is negative, more investors are at a loss, reducing the incentive to sell.
This would help reduce selling pressure in the ADA market and increase the likelihood of a potential rebound as more investors hold onto their assets instead of realizing losses.
ADA’s Next Move: Break Above $0.75 or Drop to $0.65?
At press time, ADA trades at $0.71. The horizontal trend of its Relative Strength Index (RSI) on the daily chart confirms the coin’s sideways movements.
The RSI indicator measures an asset’s oversold and overbought market conditions. When it is flat, as with ADA, it indicates a balance between buying and selling pressure, meaning there is no clear momentum in either direction. This suggests market consolidation, where the asset trades within a range without strong bullish or bearish dominance.
However, with the steady uptick in ADA accumulation, a break above the resistance at $0.75 could be on the horizon. If successful, ADA could rally toward $0.77.
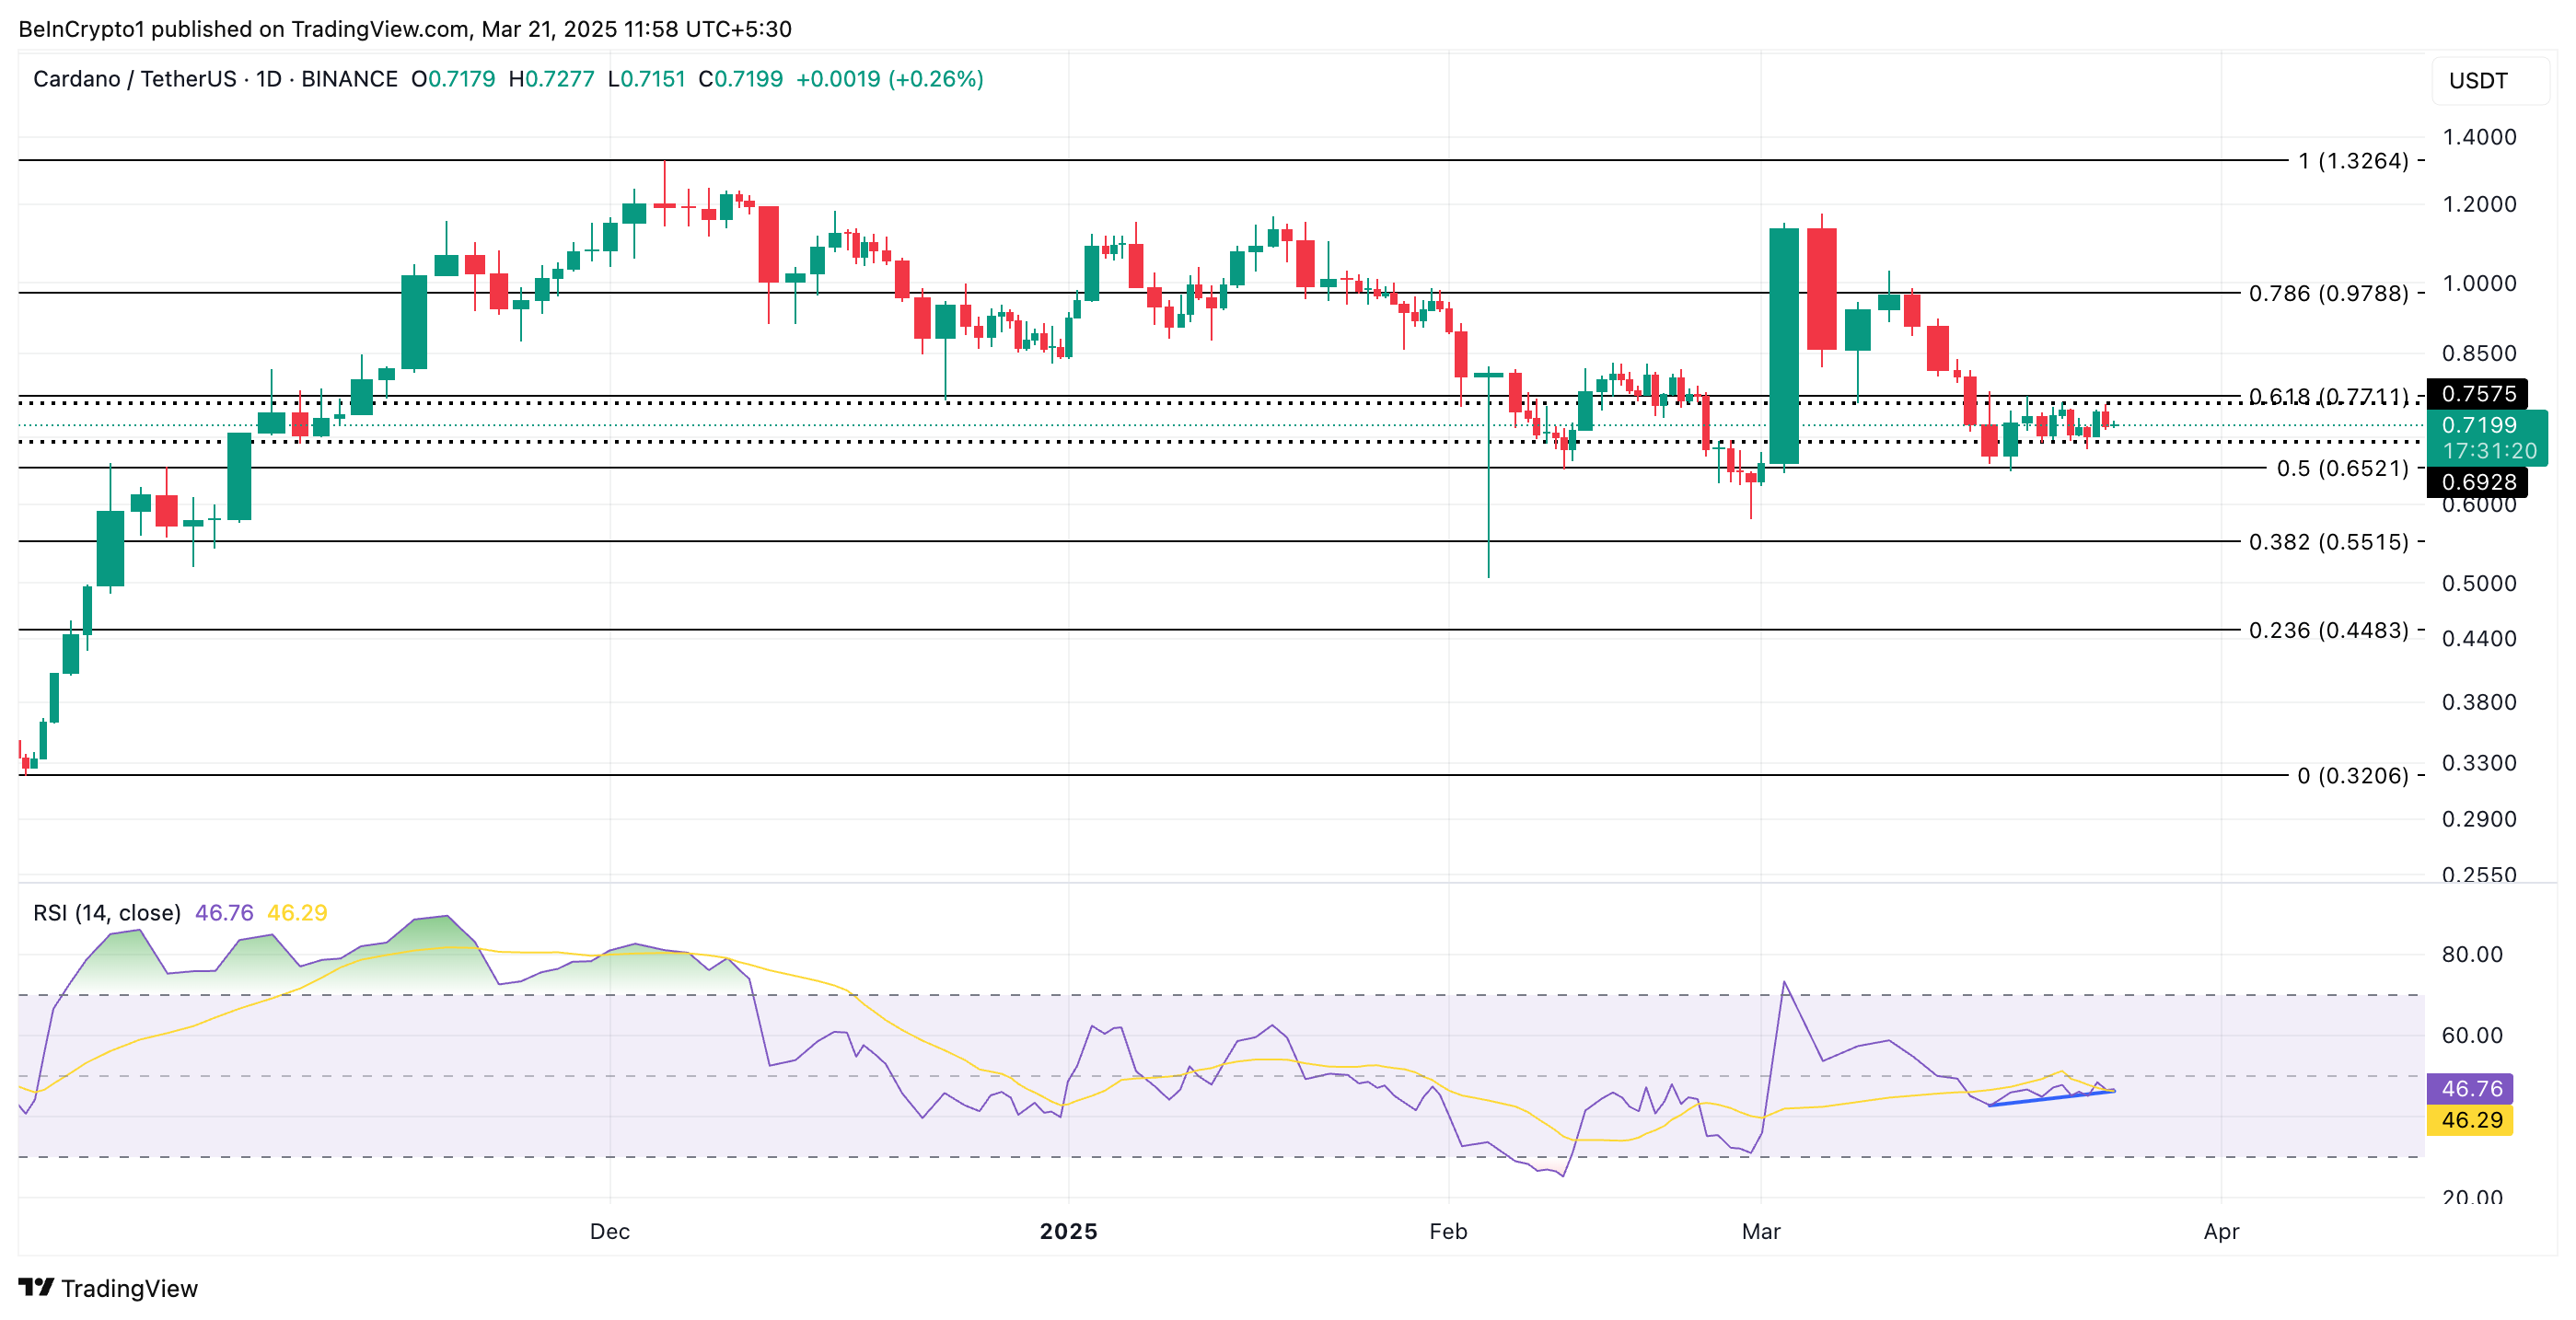
On the other hand, a breakdown below the $0.69 support could trigger a decline to $0.65.
Disclaimer
In line with the Trust Project guidelines, this price analysis article is for informational purposes only and should not be considered financial or investment advice. BeInCrypto is committed to accurate, unbiased reporting, but market conditions are subject to change without notice. Always conduct your own research and consult with a professional before making any financial decisions. Please note that our Terms and Conditions, Privacy Policy, and Disclaimers have been updated.

Why Is Solana DEX ORCA Price Skyrocketing 170% Today?

XRP Bears Persist Despite SEC Lawsuit Drop

Bitcoin ETFs Battle $5.3 Billion Loss, Recovery Signals Emerge

Cardano Holders Accumulate More ADA, Setting Stage for Rally
How DEXs Are Shaping Crypto’s Viral Tokens
Ethereum Price Eyes 50% Drop Amid Heavy ETH Whale Profit Booking

2.52 Million Altcoins Are Ruining Crypto’s Future

Animoca Brands Valuation Tanks 75% In Two Years, Here’s Why

Crypto exchange BingX hacked for $43 million

Are The Big Players Losing Interest?

Hong Kong’s Securities Association Tips Authorities On Crypto Self-Regulation

Coinbase cbBTC Set to go Live on Solana
2.52 Million Altcoins Are Ruining Crypto’s Future
Animoca Brands Valuation Tanks 75% In Two Years, Here’s Why
Crypto exchange BingX hacked for $43 million
Are The Big Players Losing Interest?
Hong Kong’s Securities Association Tips Authorities On Crypto Self-Regulation
Coinbase cbBTC Set to go Live on Solana
-

 Market19 hours ago
Why $2.66 Is The Most Important Level To Beat
-

 Market21 hours ago
Trump’s Digital Asset Summit Speech Talks Stablecoins
-

 Market20 hours ago
Key Indicators Suggest Short-Lived Gains
-

 Market18 hours ago
Solana Faces Overvaluation: Price Stagnation Ahead?
-

 Market23 hours ago
Pakistan Moves to Legalize Cryptocurrency with Clear Regulations
-

 Regulation12 hours ago
Paul Atkins To Face Nomination Hearing for US SEC Chair Role
-

 Market12 hours ago
Berachain (BERA) Struggles at $6 Despite Weaker Bearish Signals
-

 Market17 hours ago
BNB Chain Overtakes Solana in Weekly DEX Trading Volume