
Market
Redstone (RED) Shows Mixed Market Signals: Will It Hit $1?

Redstone (RED) has experienced a volatile week, climbing 25% over the past seven days despite pulling back 20% in the last three days.
This mixed performance reflects the current uncertainty surrounding RED’s price action. Technical indicators point to a market caught between consolidation and lingering bearish sentiment. While momentum indicators like RSI and ADX suggest weakening trend strength and growing indecision, price action continues to hold above key support levels.
RED RSI Has Been Neutral For The Past Two Days
Redstone’s RSI (Relative Strength Index) has slipped to 46.44, down from 53.93 just a day ago. This recent decline suggests that bearish pressure has been increasing, pulling momentum away from the bulls.
For the past two days, RSI has been hovering around the 50 level, which typically signals indecision in the market, as neither buyers nor sellers have had clear control.
However, the move below 50 today signals that bearish momentum is starting to tilt the scales.
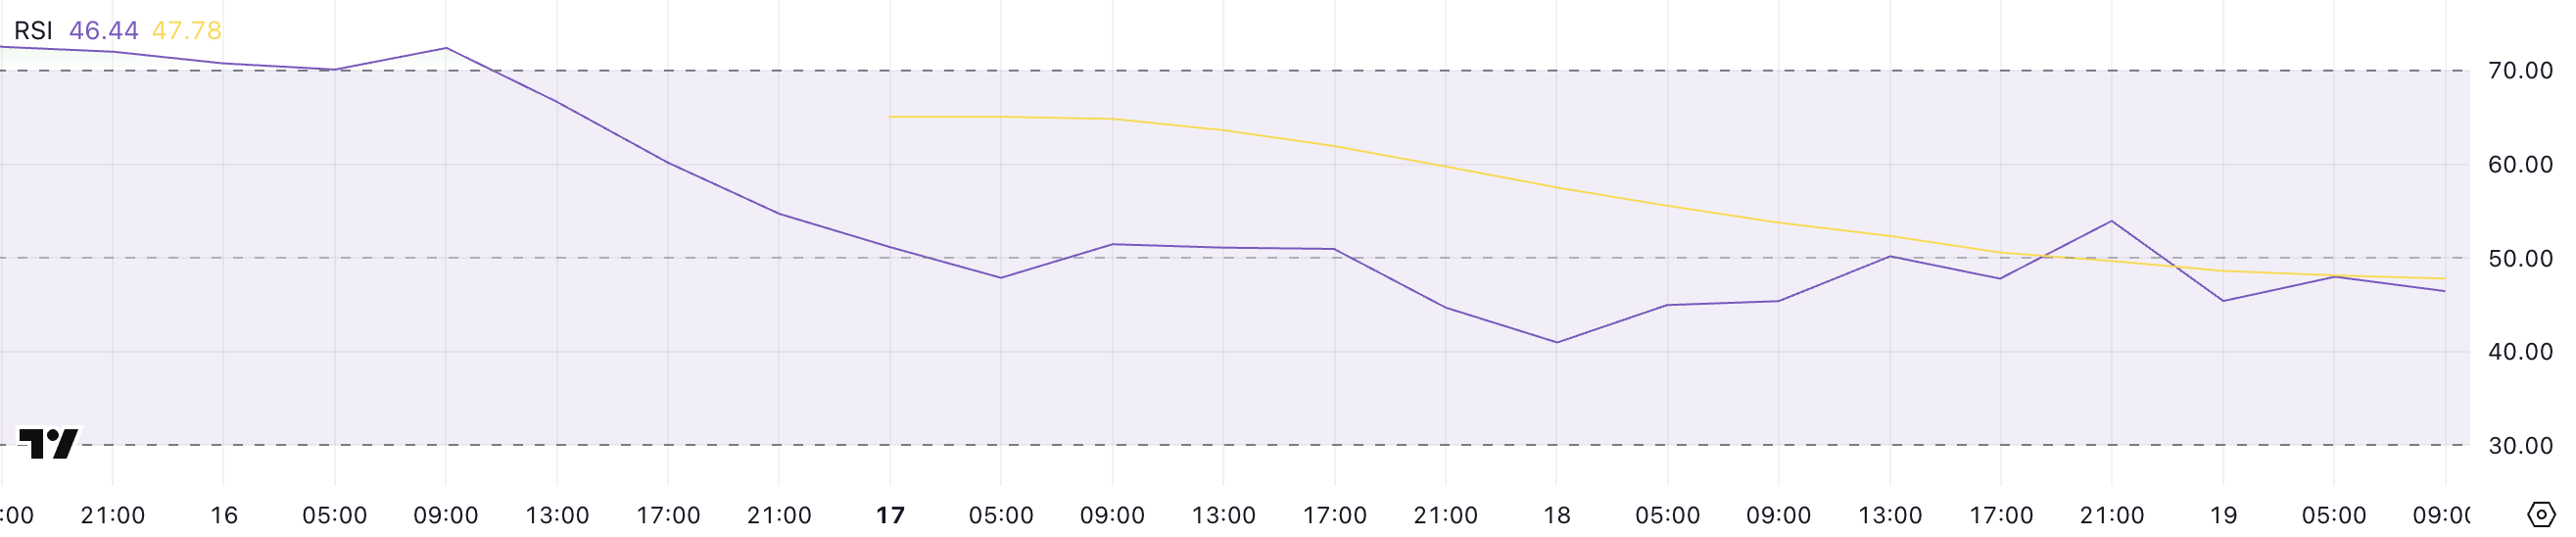
The RSI is a momentum oscillator that measures the speed and change of price movements. It typically ranges from 0 to 100. Values above 70 often indicate overbought conditions, while readings below 30 suggest oversold conditions.
The 50 mark acts as a midline that traders watch to gauge shifts in momentum—above 50 imply a bullish bias, while below 50 leans bearish.
Redstone’s RSI is now sitting at 46.44 after hovering near 50, which could mean the market is gradually tipping in favor of sellers as Redstone tries to establish itself as one of the most relevant leaders in the Oracle sector.
This shift may indicate further downside potential unless bulls regain control and push RSI back above 50 to reestablish bullish momentum.
Redstone ADX Shows The Current Downtrend Is Fading Away
Redstone’s ADX (Average Directional Index) has dropped significantly to 24.9, down from 42.6 just two days ago. This sharp decline suggests a noticeable weakening in the strength of the current trend.
Previously, with ADX at 42.6, the market experienced strong directional movement, but the drop to the current level implies that the momentum behind that trend is fading.
Despite this, Redstone is still maintaining its position within a broader downtrend, indicating that bearish conditions have not yet reversed but may be losing steam.
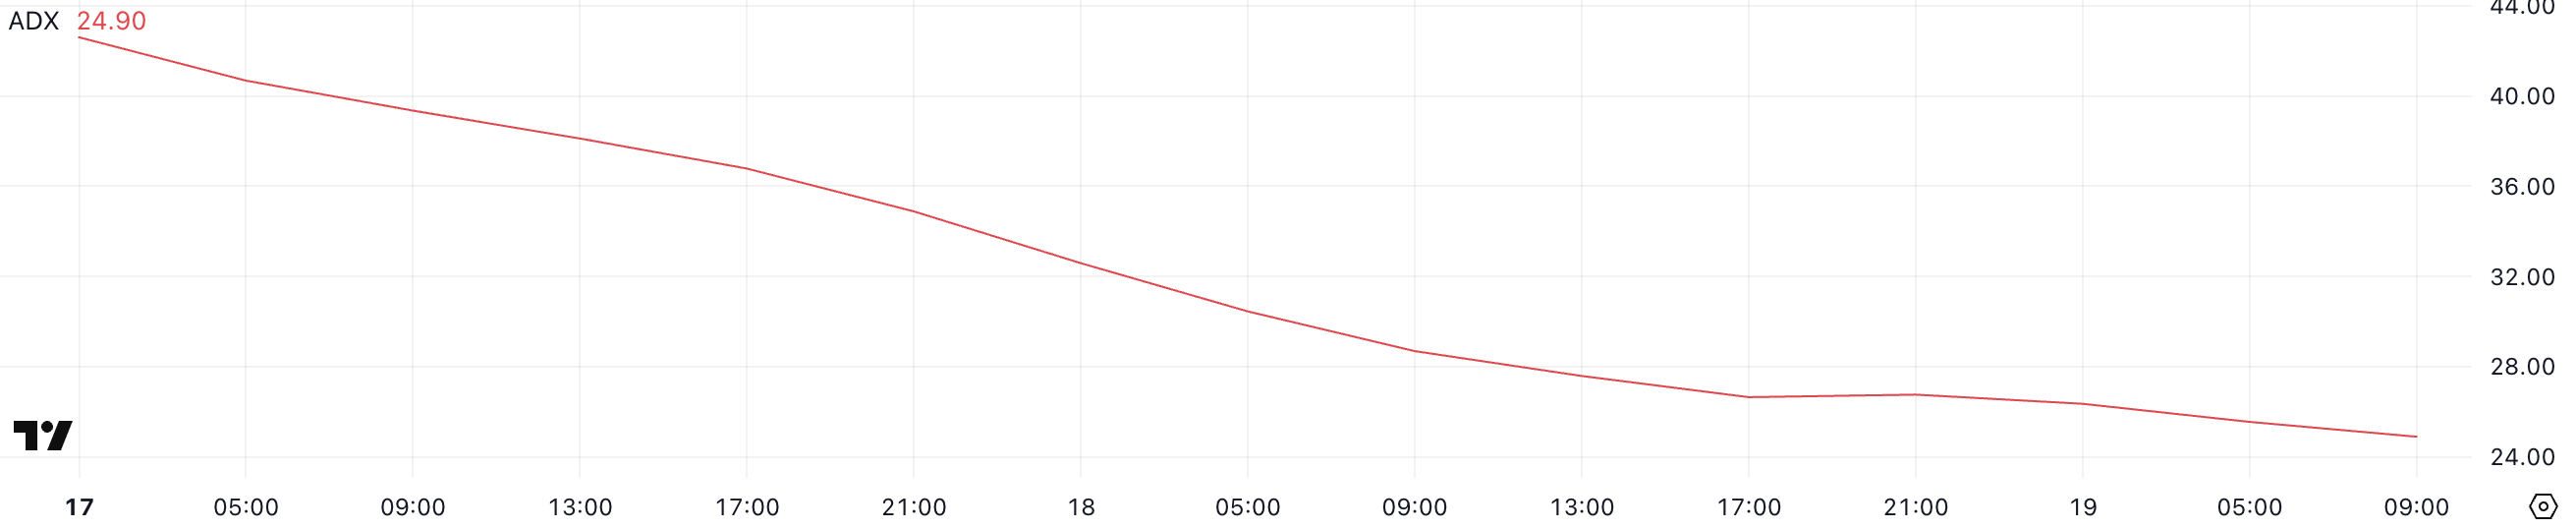
The ADX is a technical indicator used to quantify the strength of a trend without indicating its direction. Typically, ADX values above 25 suggest a strong trend, while values below 20 often indicate a weak or non-trending market.
Readings between 20 and 25 are generally considered a gray area, where the trend might be losing conviction. With Redstone’s ADX now sitting at 24.9, it points to a market where the downtrend is still present but lacks the strong momentum it recently had.
This weakening trend could lead to potential price stabilization or even a short-term bounce, but as long as the downtrend structure remains intact, caution is warranted.
Will Redstone Rise Above $1 In The Next Days?
Redstone’s EMA (Exponential Moving Average) lines continue to suggest that the asset is in a consolidation phase. Its price action is moving sideways rather than trending strongly in either direction.
A key support level has been identified at $0.65, which is currently acting as a floor for price movement. If this support is tested and broken, Redstone could potentially fall further, with downside targets around $0.50.
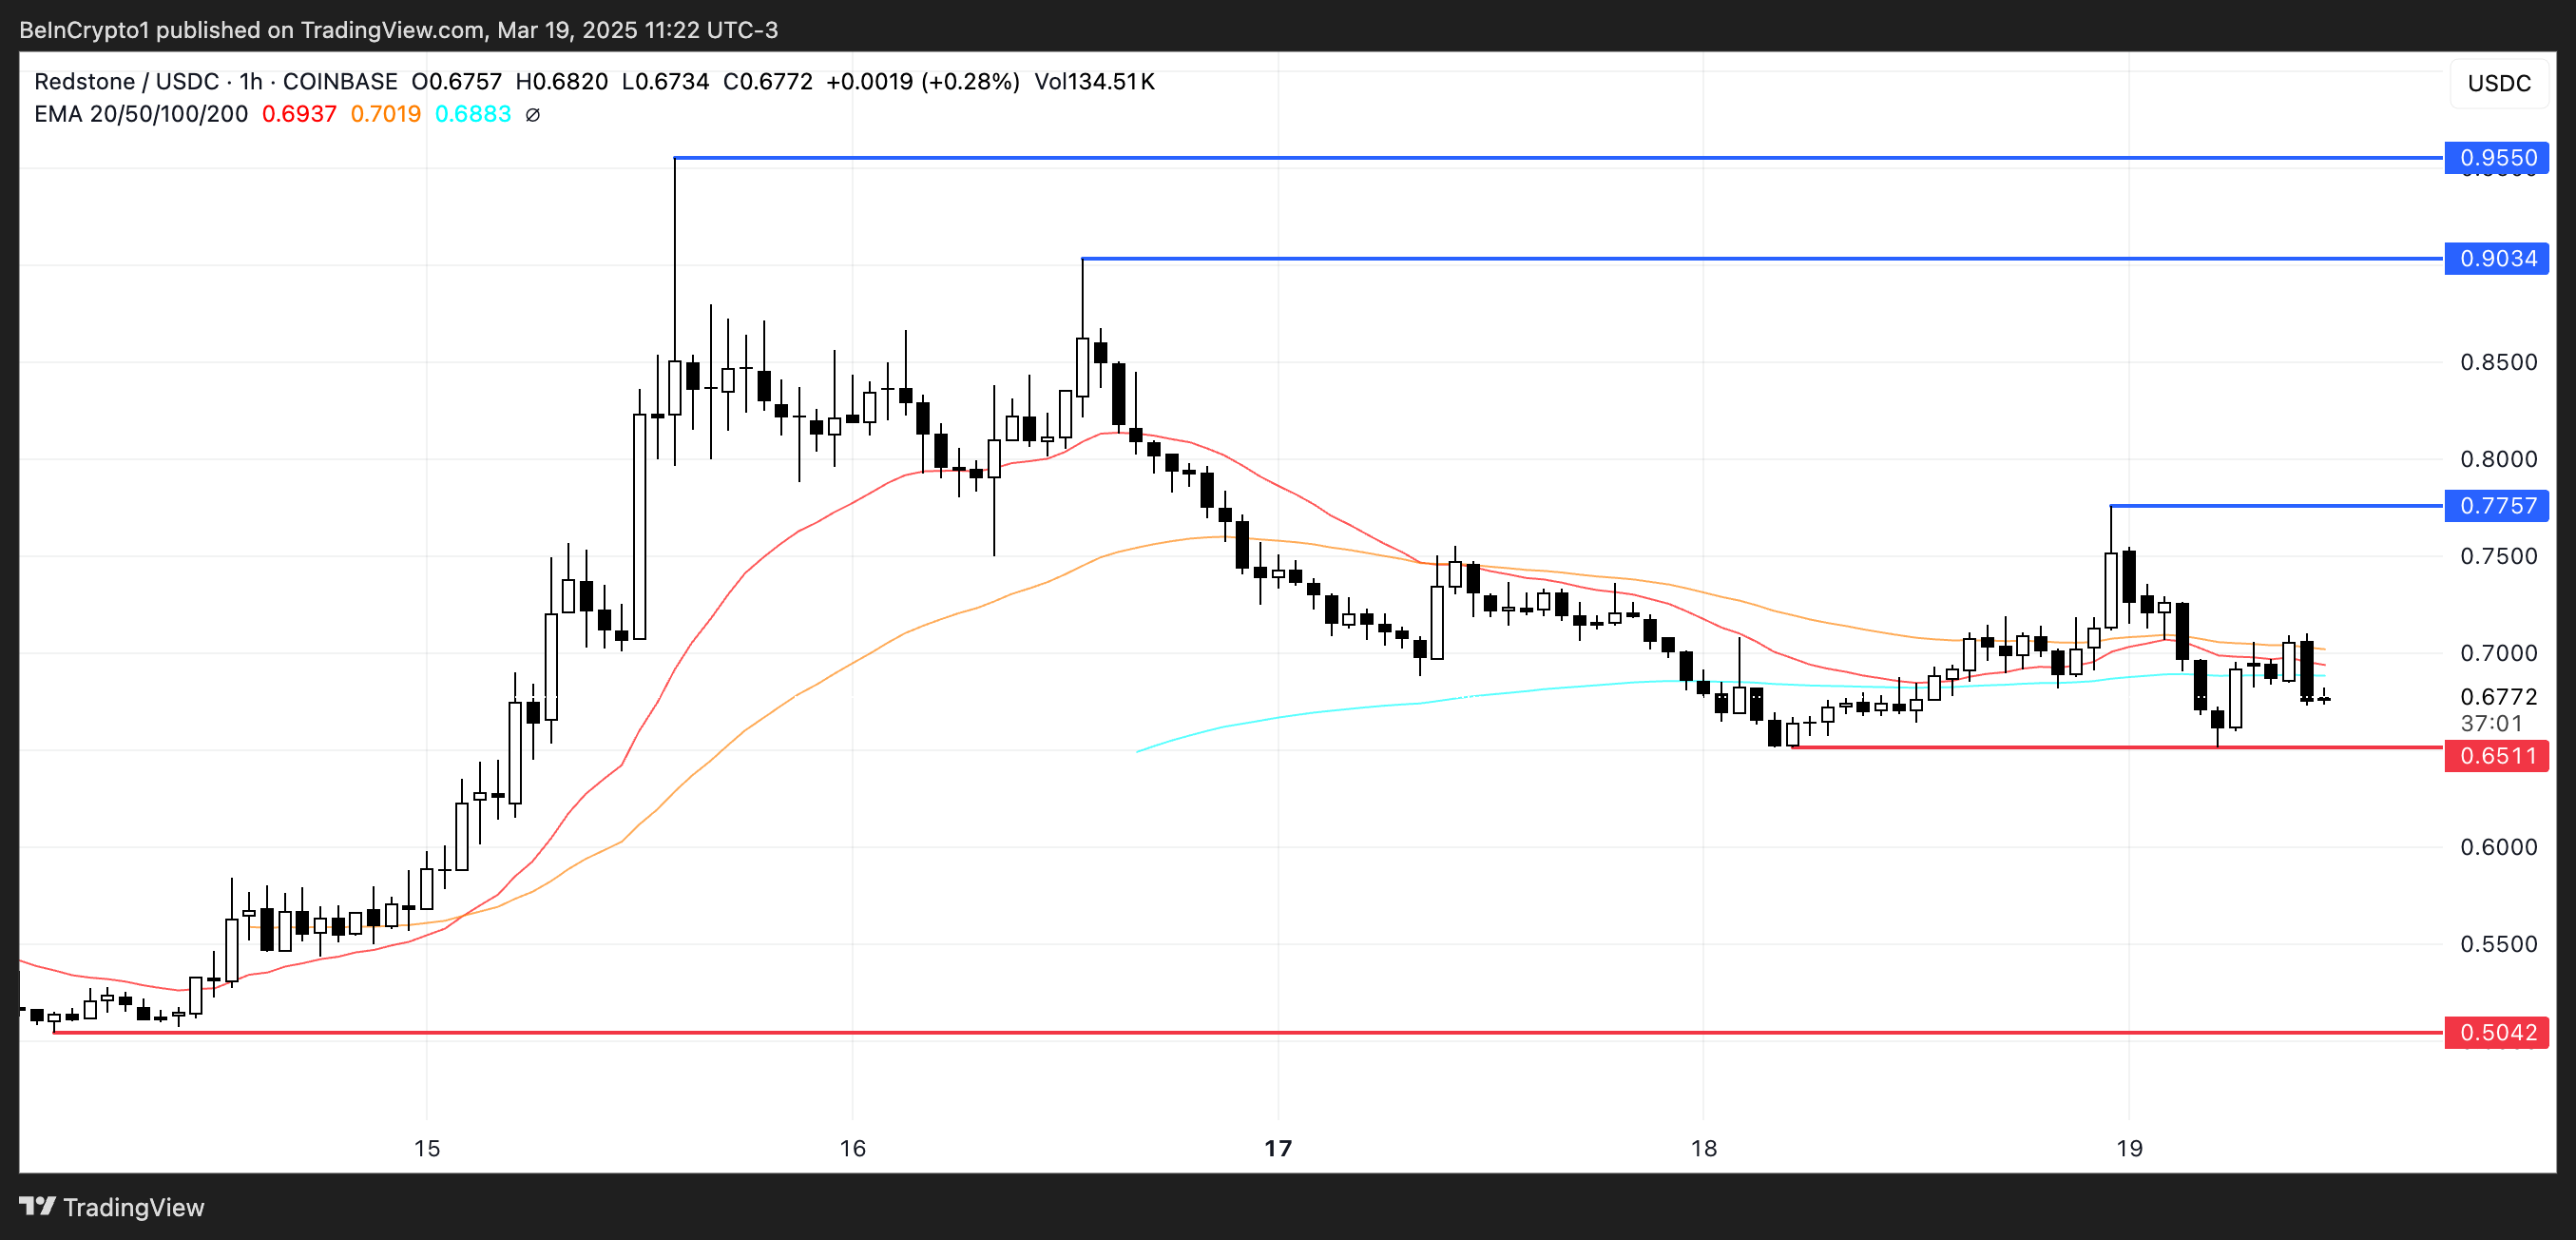
Conversely, if the price starts to build bullish momentum, Redstone could attempt to break through resistance at $0.77. A successful breakout above this level could open the path toward $0.90 and $0.95, with the possibility of finally reclaiming the $1 mark for the first time since March 3, potentially making it one of the most trending altcoins in the market.
In Redstone’s case, the EMA lines reflecting sideways movement point to indecision among market participants. For now, the $0.65 support is pivotal – holding it could give bulls room to stage a rally while losing it could invite stronger selling pressure.
Disclaimer
In line with the Trust Project guidelines, this price analysis article is for informational purposes only and should not be considered financial or investment advice. BeInCrypto is committed to accurate, unbiased reporting, but market conditions are subject to change without notice. Always conduct your own research and consult with a professional before making any financial decisions. Please note that our Terms and Conditions, Privacy Policy, and Disclaimers have been updated.


Berachain (BERA) is currently trading around $6.05, with a market cap sitting near $653 million, after pulling back from a recent high of $7.08 reached on March 17.
The asset has been consolidating after the recent price drop, as technical indicators suggest mixed signals. While bearish trends are still present, some early signs of bullish momentum are starting to emerge.
Berachain RSI Shows A Bullish Momentum Could Appear Soon
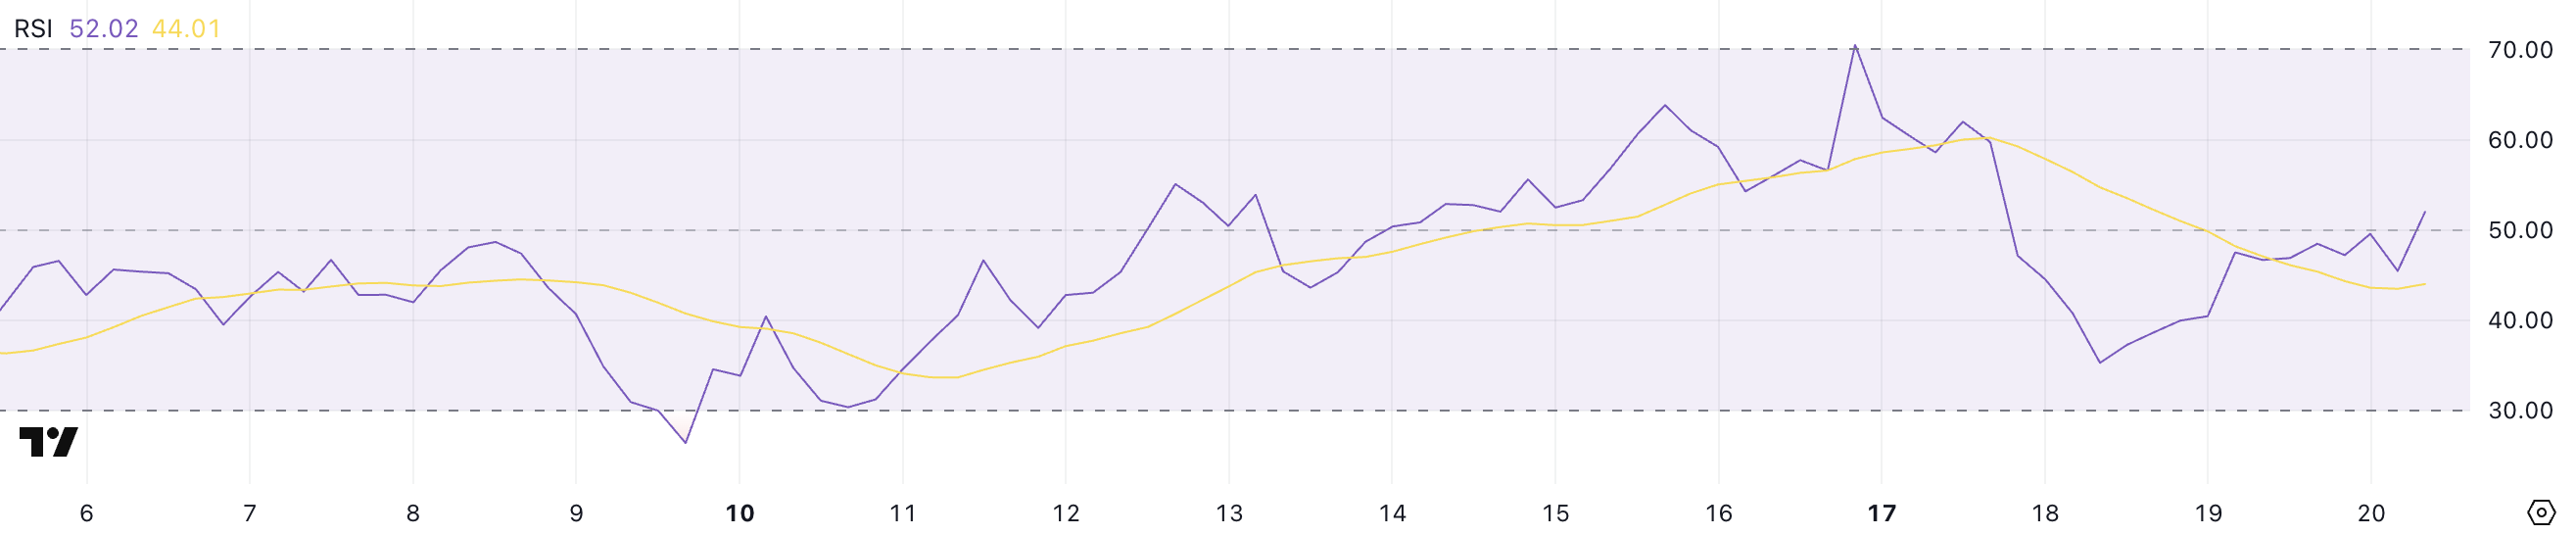
Berachain is showing signs of stabilizing after recent volatility, with its RSI currently sitting at 52, up from 35 just two days ago.
This rebound follows a sharp decline from an overbought level of 70.5, which was reached four days ago before the RSI cooled off.
The rise back above 50 suggests that bullish momentum is starting to regain some control after the recent correction, though the market remains relatively balanced between buyers and sellers for now.
The RSI (Relative Strength Index) is a momentum oscillator that measures the speed and magnitude of recent price changes, helping to identify potential overbought or oversold conditions.
Typically, an RSI above 70 signals that an asset might be overbought and due for a pullback, while an RSI below 30 points to oversold conditions, which could precede a price bounce.
With BERA’s RSI at 52, it is now in neutral territory, signaling neither an overbought nor an oversold condition. This suggests that while the selling pressure has eased, buyers still need to build more momentum to drive a sustained uptrend.
BERA CMF Is Rising, But Buying Pressure Is Still Building
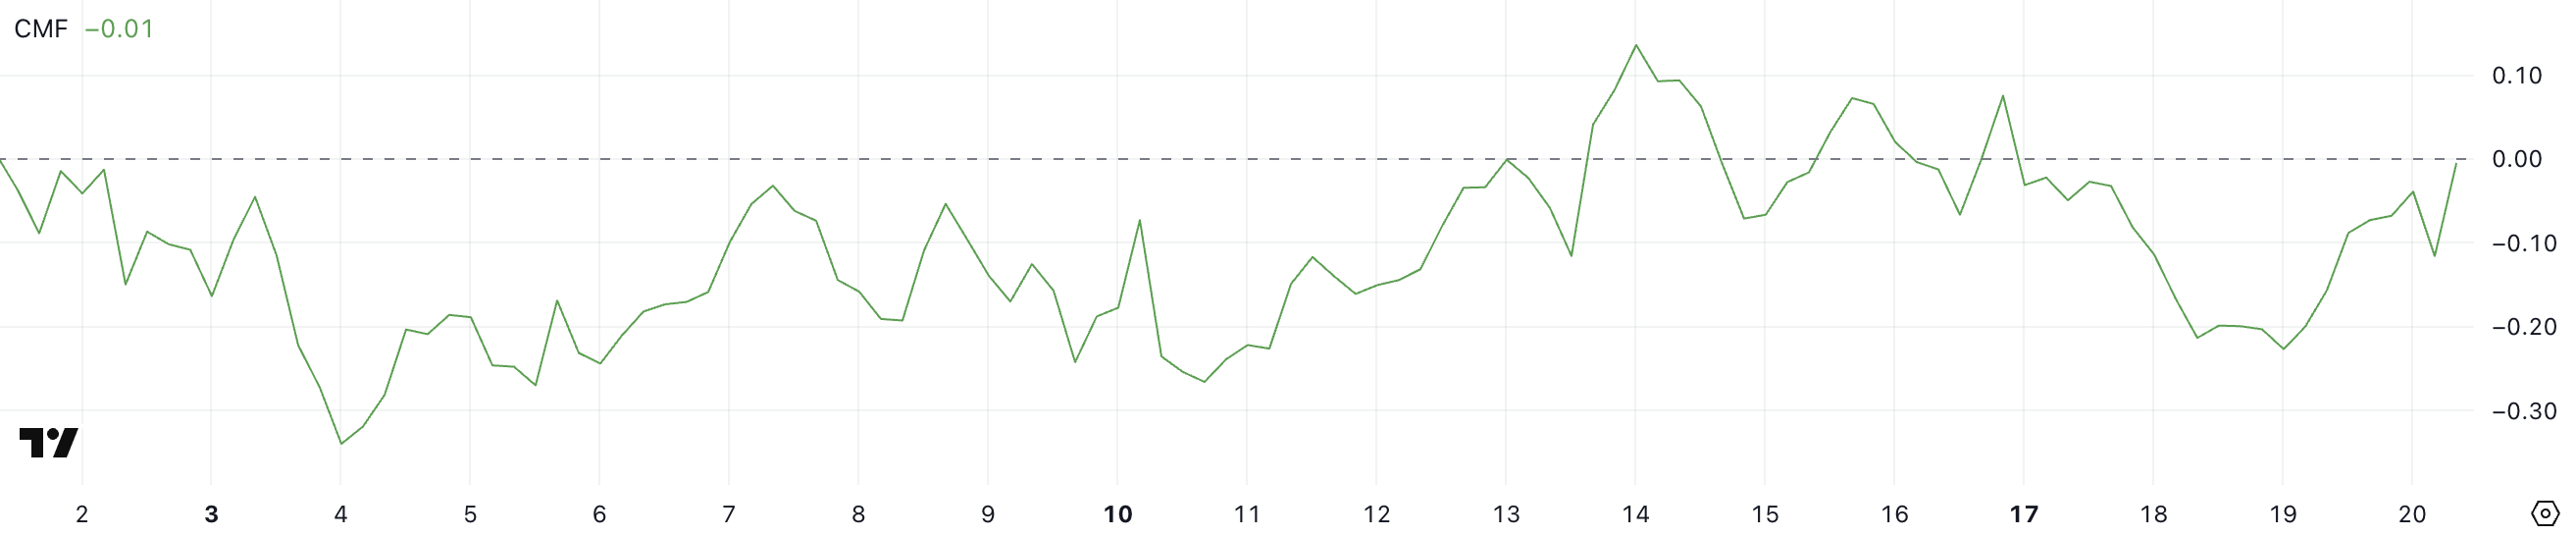
Berachain CMF is currently at -0.01, an improvement from -0.23 yesterday, indicating that selling pressure has started to ease.
However, despite this slight recovery, the CMF is still hovering in negative territory, suggesting that the market is not yet seeing strong capital inflows.
What’s notable is that BERA’s CMF hasn’t climbed above 0.10 since March 14, signaling a prolonged period of weak buying volume and cautious investor sentiment.
The Chaikin Money Flow (CMF) is a volume-based indicator that measures the flow of money into and out of an asset over a given period.
Values above 0 indicate buying pressure or accumulation, while values below 0 signal selling pressure or distribution. With BERA’s CMF still near neutral but below zero, it shows that while sellers are losing momentum, buyers have yet to take control firmly.
Until the CMF pushes decisively into positive territory – particularly above 0.10 – any upward price movement may struggle to sustain itself without stronger capital inflows.
Can Berachain Surge To $7?
Berachain EMA lines continue to reflect a bearish setup, with short-term moving averages positioned below the long-term ones.
This indicates that downward momentum still dominates the market. However, if Berachain manages to reverse this trend and build bullish momentum, the price could first target the resistance around $7.14.
A breakout above this level could open the door for a move toward $7.50 or even $8, a price level not seen since March 3.
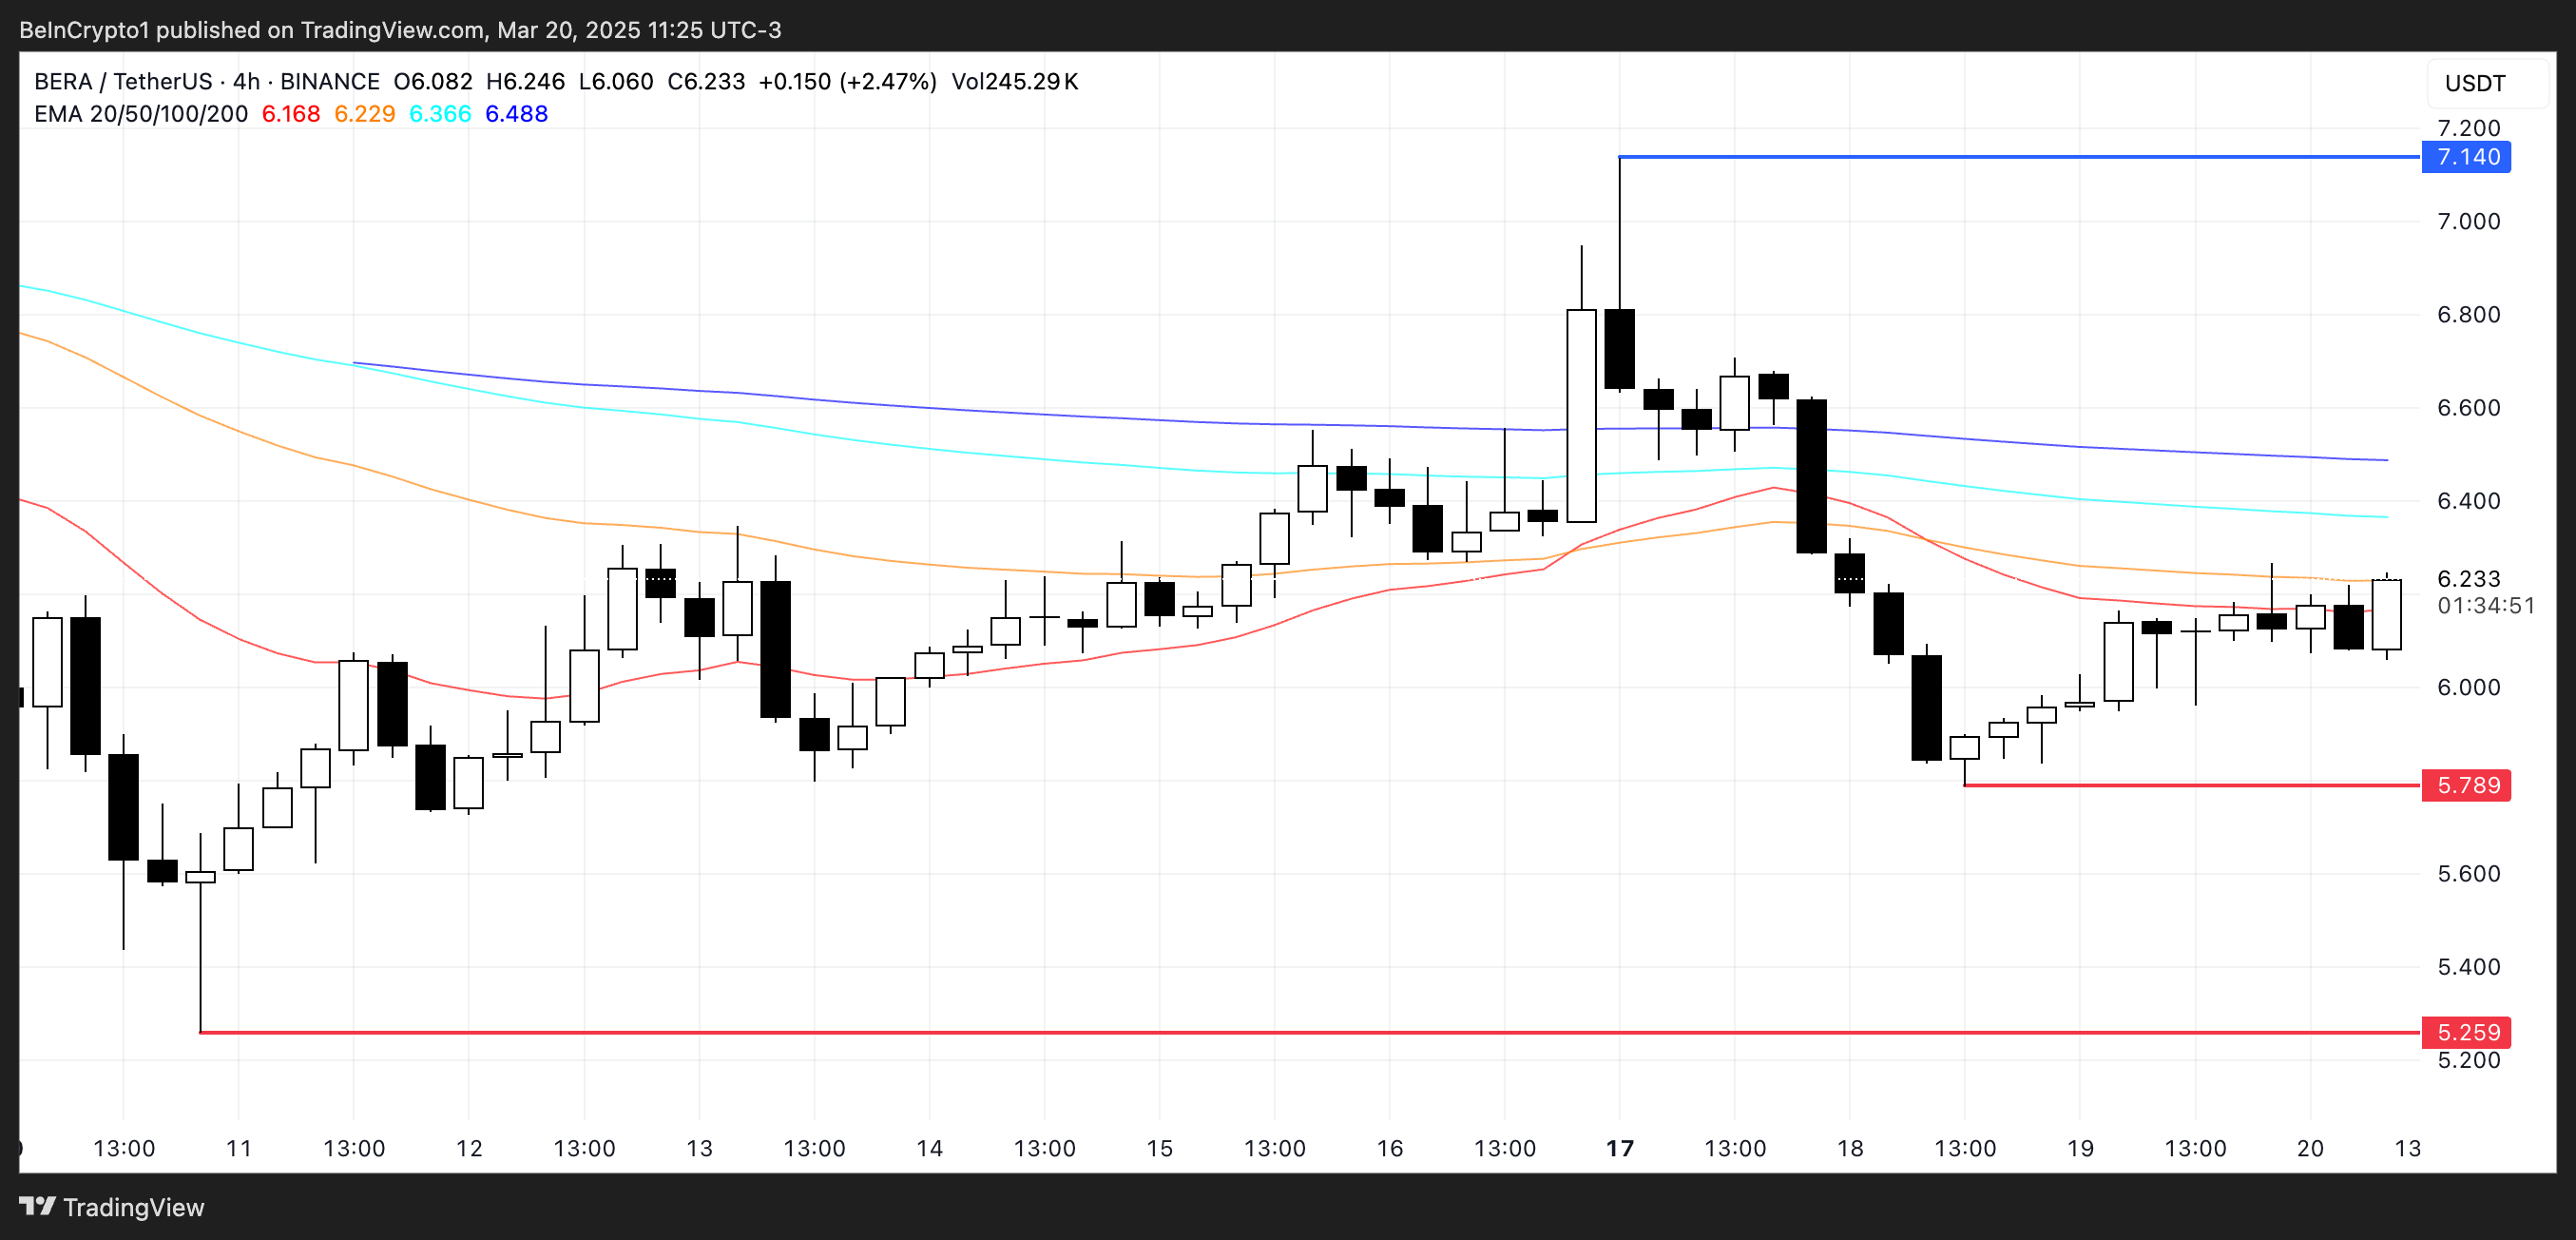
On the downside, if BERA fails to establish an uptrend and bearish momentum persists, the price could fall back to test the key support at $5.78.
Losing this level would likely deepen the bearish outlook, potentially driving Berachain price lower toward $5.25 in the near term.
For now, the EMA alignment suggests that sellers still have the upper hand, but a shift in momentum could quickly change the market structure and trigger a rally.
Disclaimer
In line with the Trust Project guidelines, this price analysis article is for informational purposes only and should not be considered financial or investment advice. BeInCrypto is committed to accurate, unbiased reporting, but market conditions are subject to change without notice. Always conduct your own research and consult with a professional before making any financial decisions. Please note that our Terms and Conditions, Privacy Policy, and Disclaimers have been updated.
The SEC declared today that proof-of-work cryptoassets are not bound by securities regulations. Based on this clarity and the commissions latest actions, BeInCrypto analysts predict that the SEC will approve multiple altcoin ETFs together by the end of Q2 2025
Meanwhile, Caroline Crenshaw, an anti-crypto SEC Commissioner, made another statement of public dissent today. She claimed that this ruling is full of loopholes, but it’s doubtful that these objections can stop a dedicated pro-crypto agenda.
SEC is Laying the Groundwork to Approve more ETFs
In a press release today, the Commission decided that proof-of-work cryptoassets are not considered securities under US law. Like Bitcoin, the entire asset class should be considered commodities. The SEC’s decision here could have huge implications for altcoin ETFs.
“It is the [SEC’s] view that mining activities do not involve the offer and sale of securities [and] that participants in mining activities do not need to register transactions with the Commission under the Securities Act or fall within one of the Securities Act’s exemptions from registration,” the SEC’s statement claimed.
This regulatory clarity could change the odds of ETF approval for a few proof-of-work (PoW) cryptoassets. For example, Litecoin, which falls in this category, was already very likely to receive approval.
With this ruling, more asset managers might be inclined to offer ETFs for other PoW coins, like Monero or Kaspa.
However, this trend also goes beyond PoW cryptoassets in general. The SEC has been systematically declaring several assets to be commodities.
For example, in February, it declared that meme coins are not securities. This potentially clearly the regulatory roadblock for Dogecoin ETFs.
SEC Wants Paul Atkins to Join Under a Clean Slate
In other words, the SEC could be declaring all these assets to not be securities as a way of laying foundations for any future ETF applications. When viewed through this angle, even a few apparent setbacks could be the groundwork for future gains.
Case in point, the Comission delayed ETF applications for Solana and XRP last week. However, the CFTC has since approved futures trading on both assets, boosting their ETF odds.
Meanwhile, the Commission also dropped its landmark lawsuit against Ripple, which hinged on the supposition that XRP is a security.
So, all of these decisions are collectively removing any regulatory hurdles that can restrict altcoin funds from entering the institutional markets.
Next week, the Senate will reportedly begin confirmation hearings on Paul Atkins, Trump’s pick to be the next SEC Chair. By the time those applications meet another deadline, Atkins could be seated.
It’s likely that Atkins will have an easy decision to approve a bunch of different altcoin ETFs, as Mark Uyeda and Hester Peirce are already clarifying securities and commodities debate.
“Donald Trump’s pick for SEC chair Paul Atkins will face the Senate Banking Committie next Thursday for his nomination hearing. Trump’s pick for OCC, Jonathan Gould, will also have his hearing,” wrote Eleanor Terrett.
Crenshaw Speaks Out Once Again
Given the current regulatory trends and SEC actions, BeInCrypto projects that the Comission is preparing to approve several altcoin ETFs during Q2 2025.
However, not everyone on the Commission is prepared to go along with it. Caroline Crenshaw, a Commissioner who recently broke ranks to publicly dissent with the SEC’s pro-crypto turn, criticized today’s decision too.
“Buried in the footnotes, the statement reveals its true limitation: one actually would have to conduct a Howey analysis to know if a specific mining arrangement constitutes an investment contract. For the sake of investors, other market participants, and the markets themselves, I hope that readers do not mistake it for something more than it is,” she said.
Crenshaw asserted that the SEC’s argument is full of several other serious loopholes, and doesn’t actually guarantee that PoW tokens are free from securities laws.
She said that today’s decision is the tenth such “non-binding interpretation” in nine weeks, although she stopped short of directly accusing her colleagues of making biased rulings to favor the crypto industry.
Still, Crenshaw’s time at the SEC is running out. If nobody wishes to test these loopholes, it’s functionally the same as if they did not exist.
Disclaimer
In adherence to the Trust Project guidelines, BeInCrypto is committed to unbiased, transparent reporting. This news article aims to provide accurate, timely information. However, readers are advised to verify facts independently and consult with a professional before making any decisions based on this content. Please note that our Terms and Conditions, Privacy Policy, and Disclaimers have been updated.

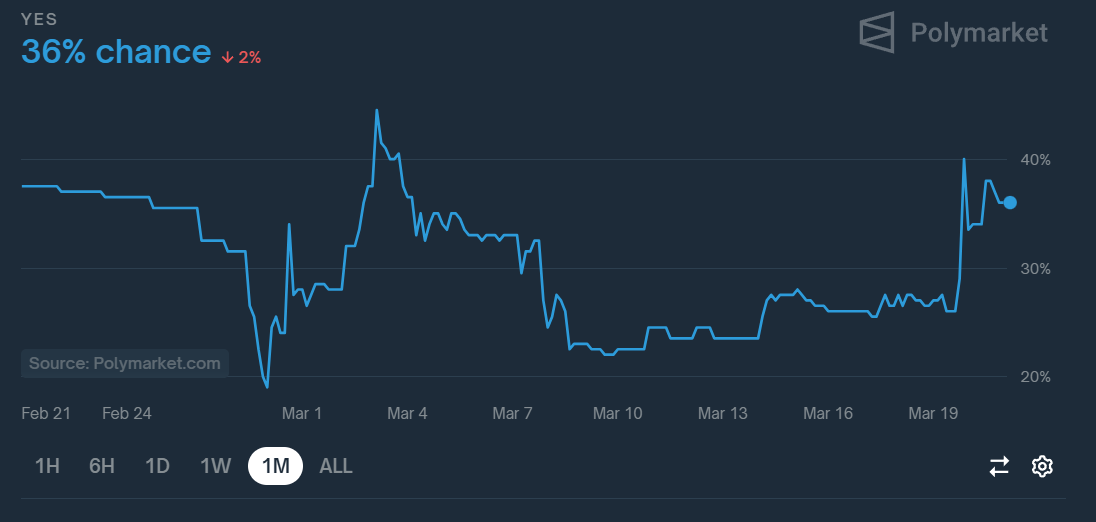
Cardano (ADA) has remained relatively stagnant, with its price barely moving from the levels seen seven days ago. Despite this lack of price action, trading volume has surged nearly 28% in the last 24 hours, climbing to $1 billion.
This increase in activity comes while ADA continues to consolidate, with technical indicators signaling indecision in the market. As momentum builds, traders are watching closely for signs of a breakout from this tight range.
Cardano ADX Shows The Lack Of A Clear Direction
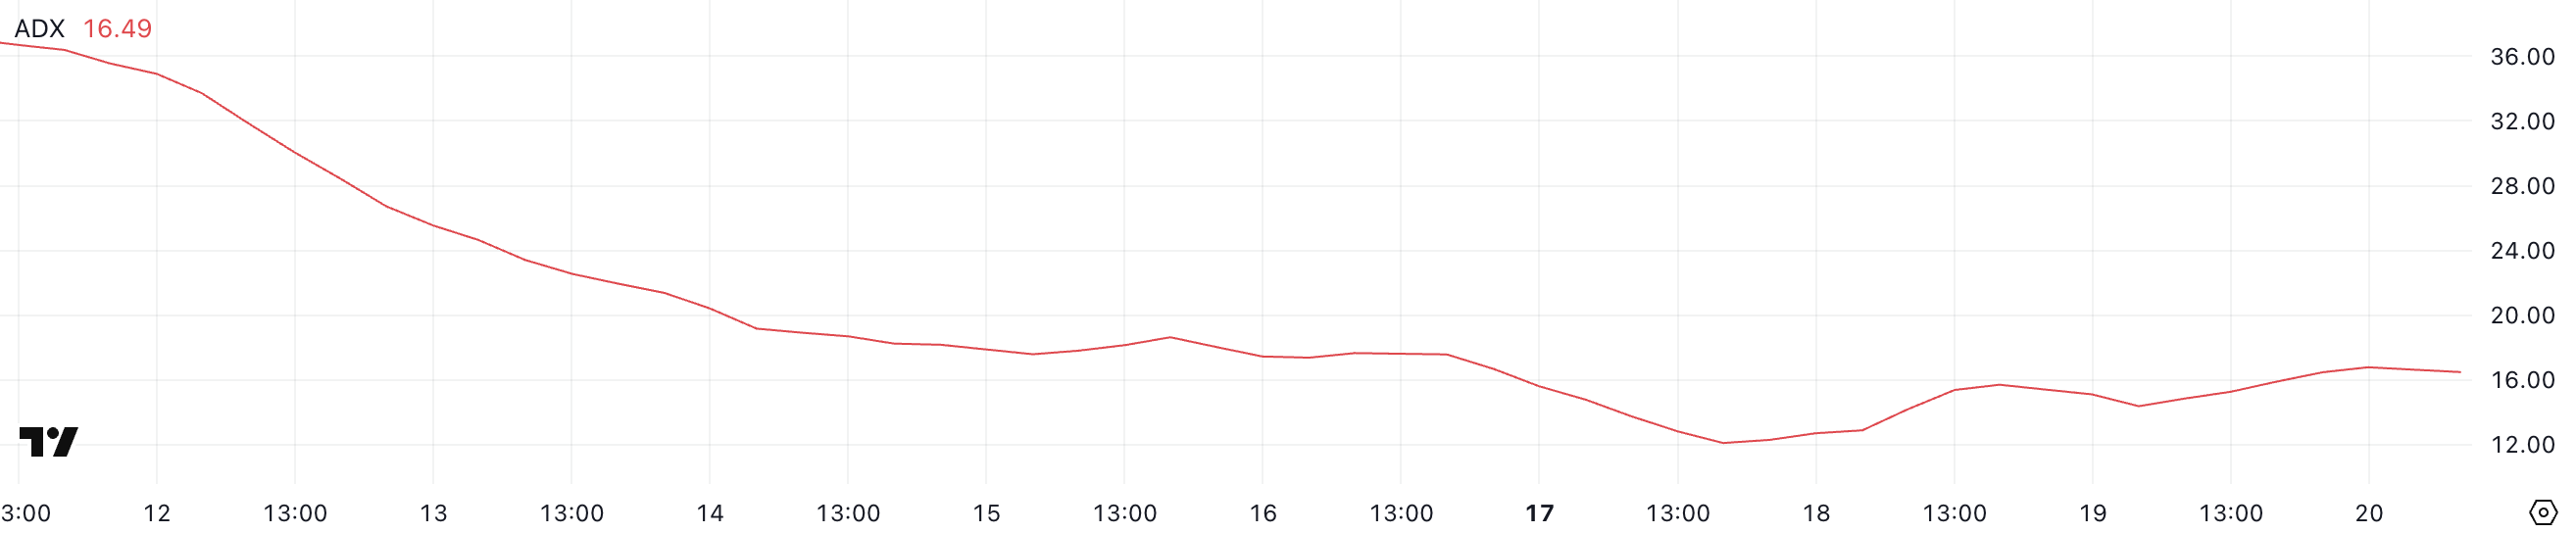
Cardano’s trend strength has remained relatively unchanged, with its ADX currently at 16.49 – roughly the same level it has maintained since yesterday.
This flat movement in the ADX suggests that there hasn’t been a significant shift in momentum, and the market lacks a clear directional trend.
ADA’s price is currently caught in a consolidation phase, with neither buyers nor sellers able to establish dominance, which is reflected in the stagnant ADX reading.
The ADX (Average Directional Index) is a technical indicator used to measure the strength of a trend without indicating its direction.
An ADX below 20 typically signals a weak or non-existent trend, while readings between 20 and 40 point to a developing or moderate trend, and values above 40 indicate a strong trend.
With ADA’s ADX holding below the 20 mark, it suggests that the current market environment remains indecisive, likely leading to continued sideways movement.
For now, this consolidation phase could persist until a stronger directional move emerges, either through renewed buying momentum or an increase in selling pressure.
Cardano Whales Dip to July 2024 Lows
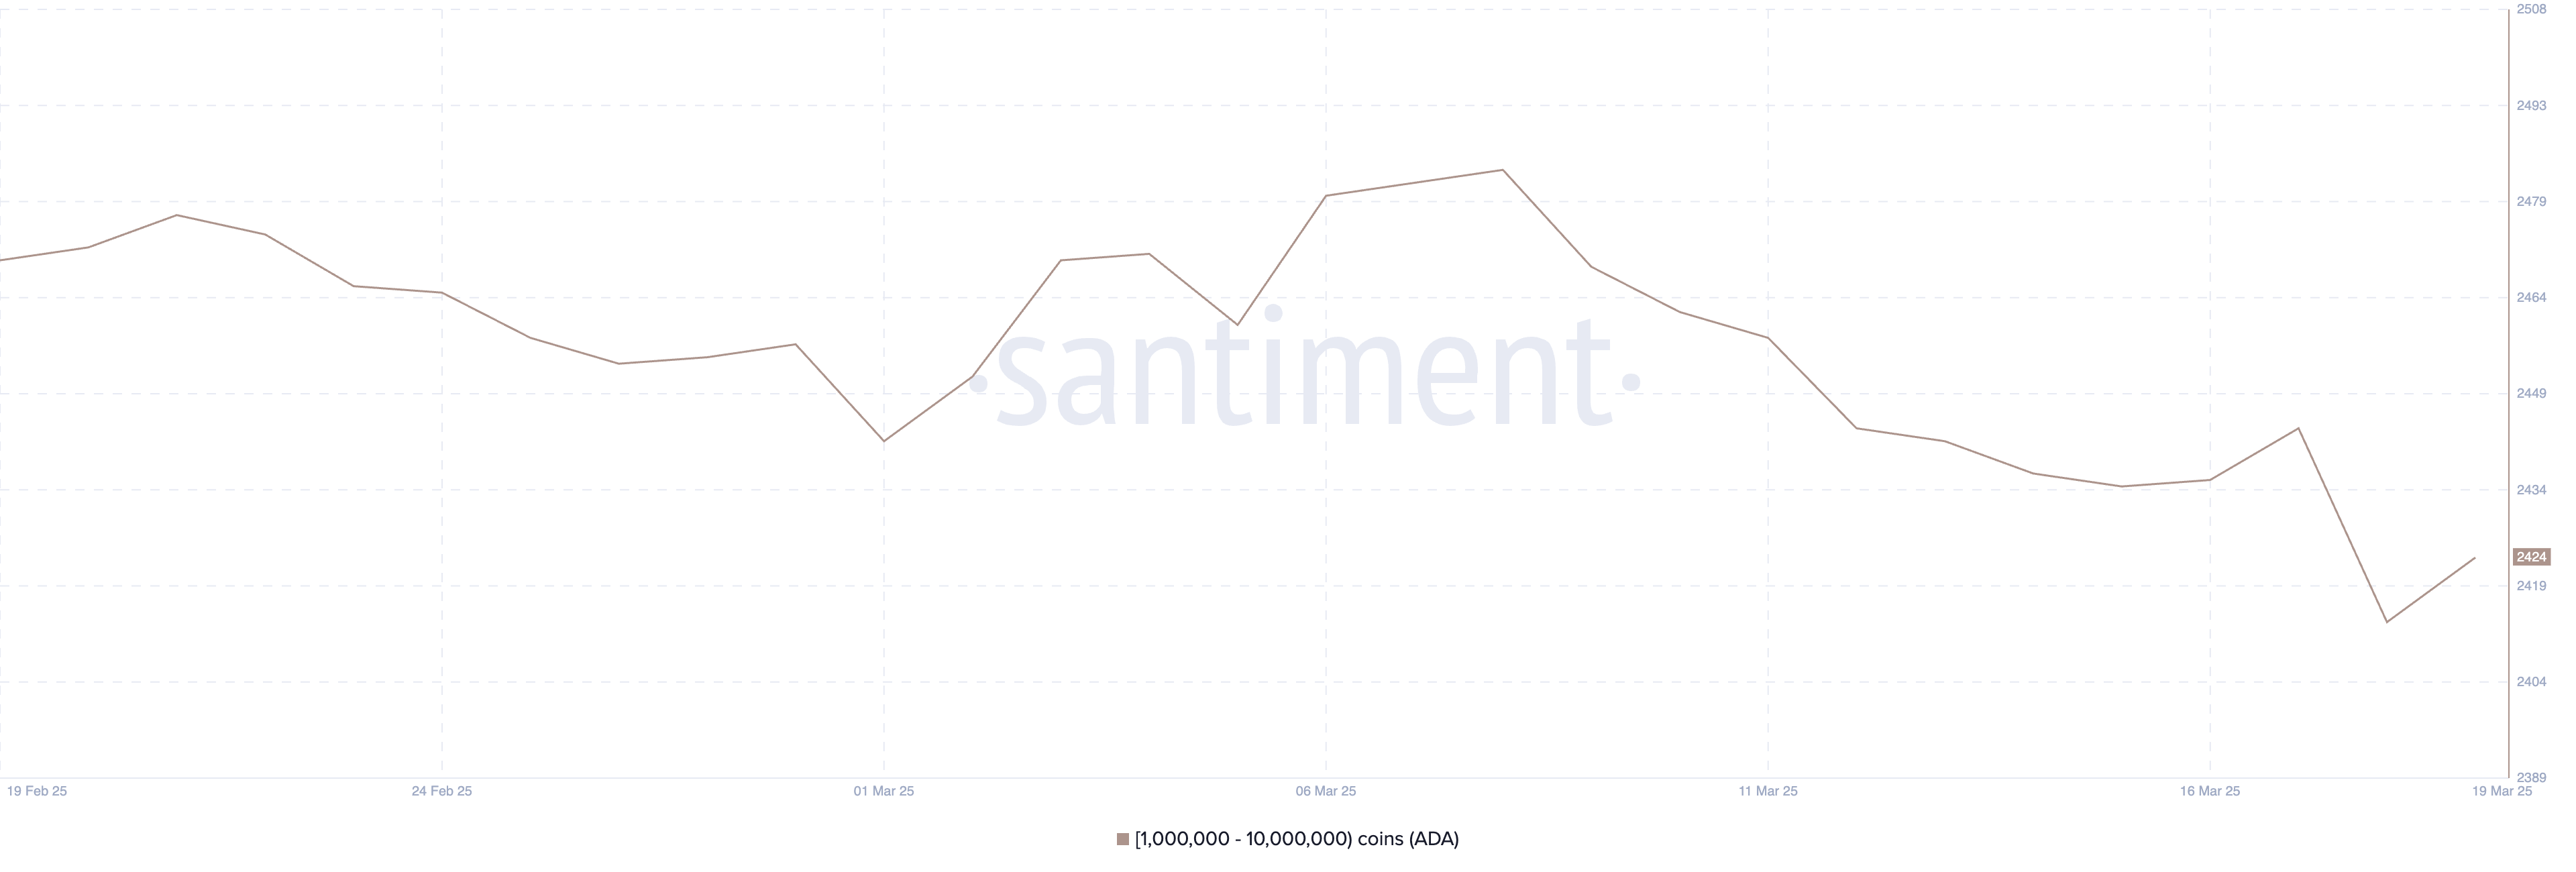
The number of Cardano whales experienced a sharp decline between March 8 and March 18. These are wallets holding between 1 million and 10 million ADA.
According to Santiment data, the number of ADA whales fell from 2,484 to just 2,414, marking the lowest level since July 2024.
On March 19, there was a slight recovery, with the number of whales rising to 2,424.
While this minor rebound shows some renewed accumulation, the overall count remains well below the levels seen in previous weeks, highlighting reduced participation from larger holders during this period.
Tracking ADA whales is crucial because these large addresses often play a significant role in influencing price action. Whales can create liquidity shifts and often act as a signal for institutional or high-net-worth investor sentiment.
The current lower whale count suggests that confidence among these key players might still be cautious.
Even with the recent uptick, whale numbers remaining below their earlier highs could point to subdued buying pressure, potentially limiting ADA’s ability to break out of its current consolidation phase in the near term.
Cardano Is Trading Between a Critical Range
Cardano EMA lines signal a consolidation phase. The short-term moving averages remain below the long-term ones but are currently very close together, indicating a lack of strong momentum in either direction.
This setup suggests indecision in the market, but it also leaves room for a potential breakout. If Cardano price manages to build bullish momentum and establish an uptrend, it could first target the $0.77 resistance.
A successful breakout above this level could pave the way for a rally toward $1.02, and if buying pressure continues, ADA might even push as high as $1.17.
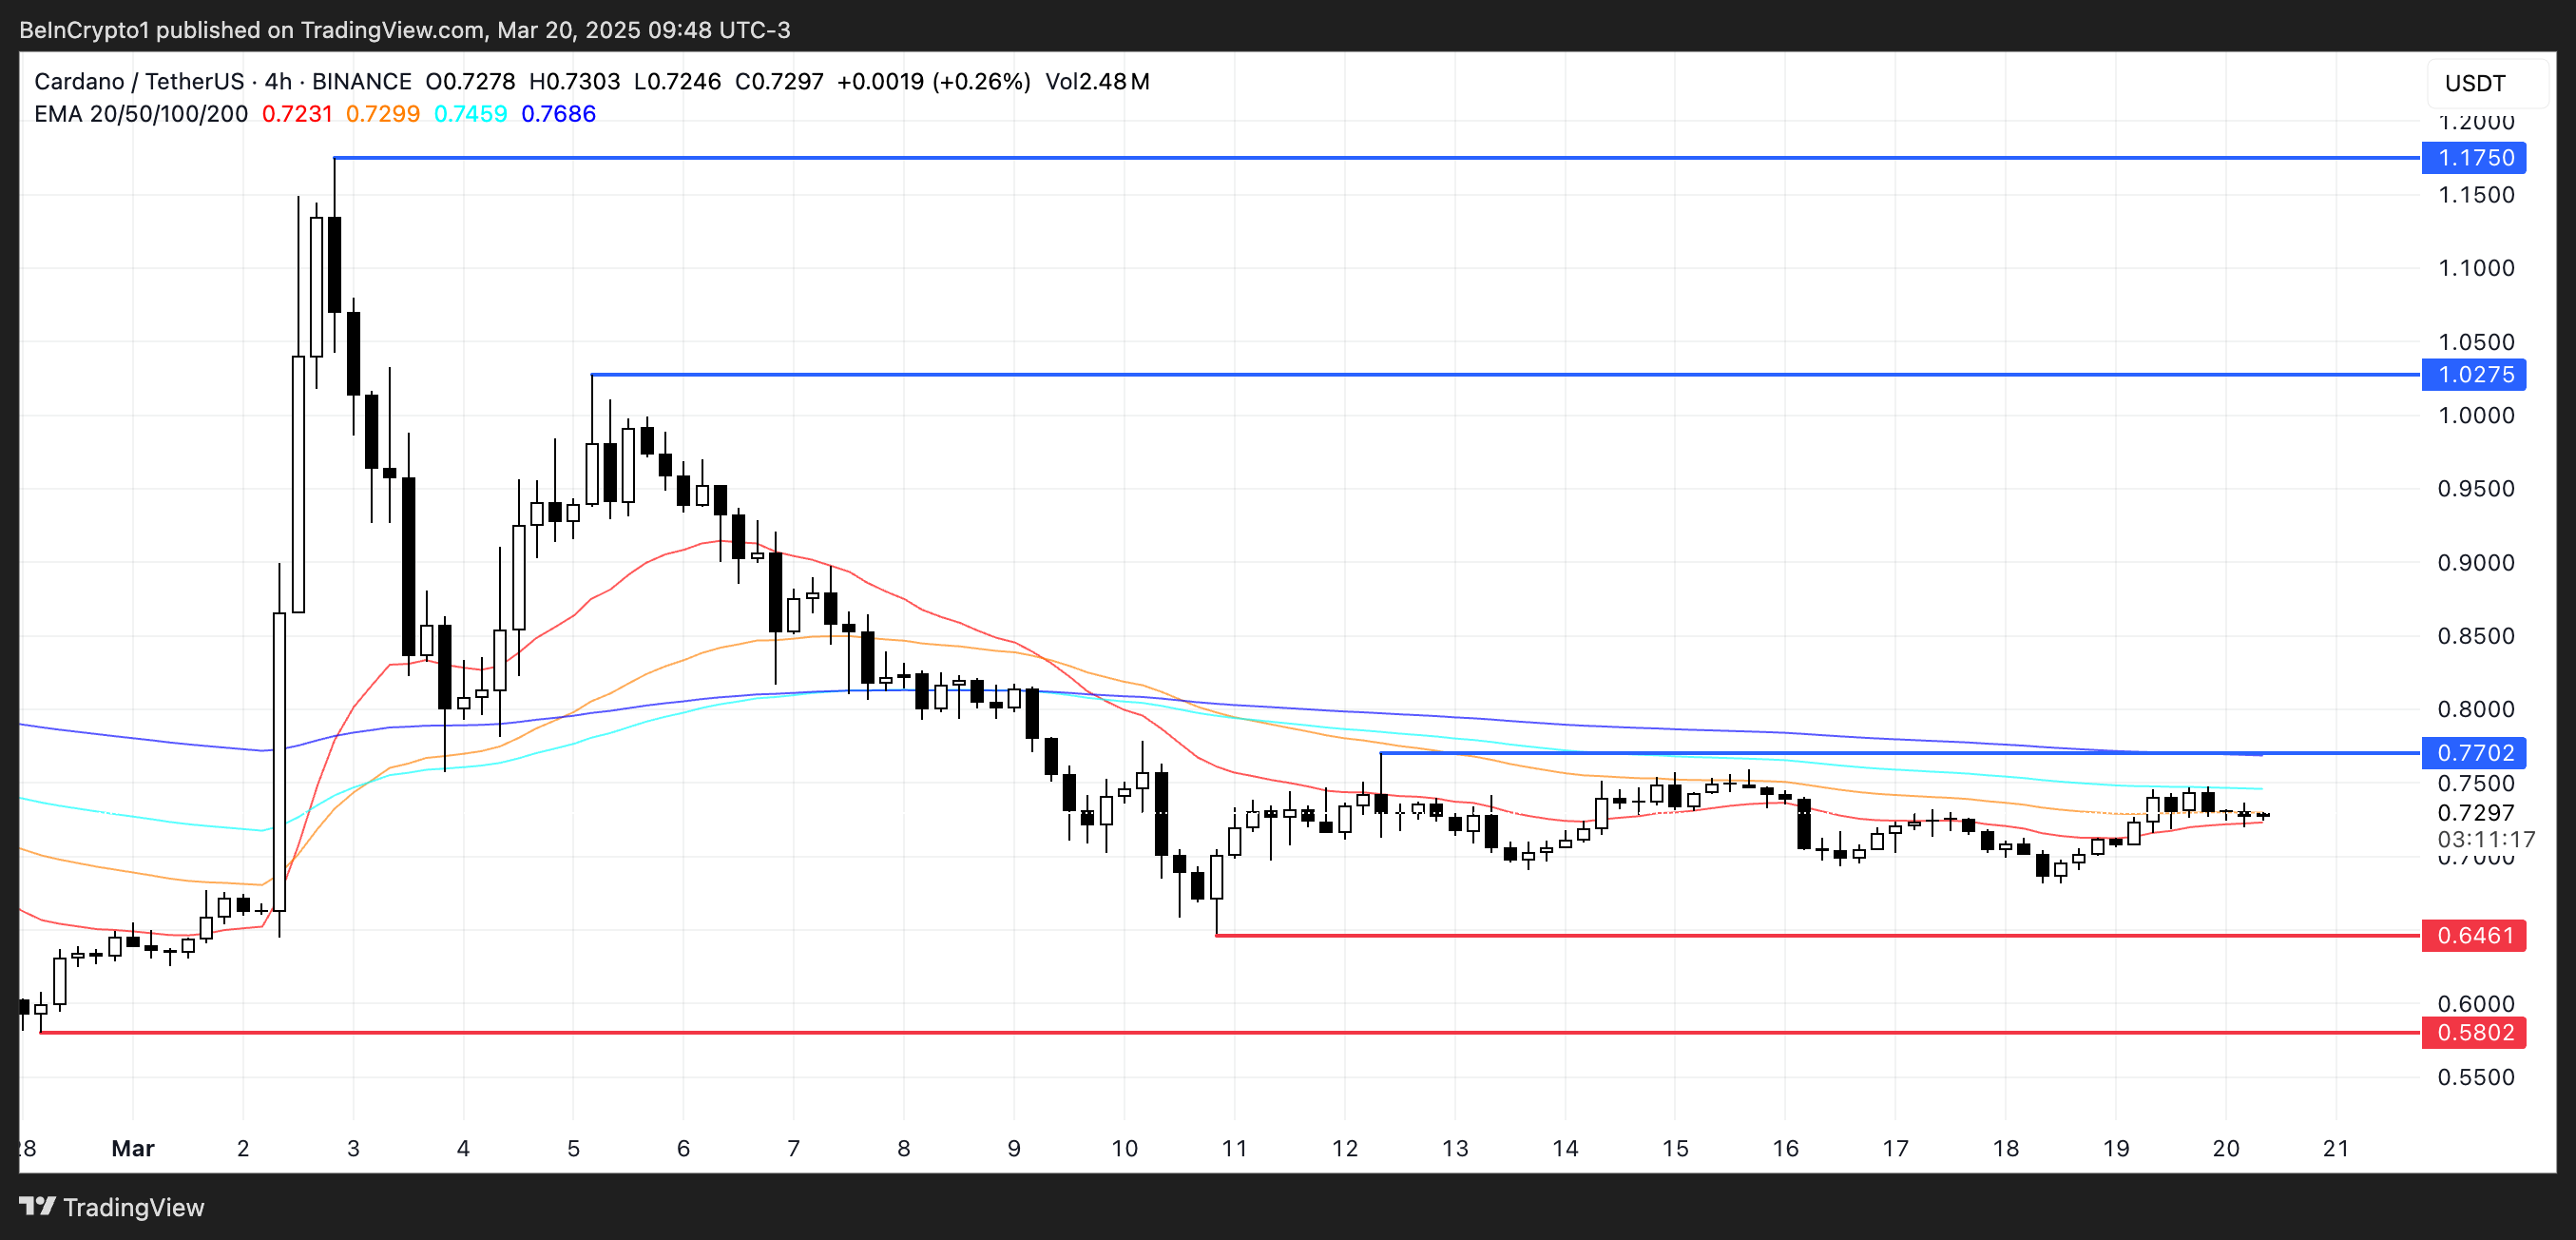
On the flip side, if a downtrend develops, ADA could fall back to test the key support level at $0.64.
Losing this support would be a bearish signal and could trigger a deeper decline toward $0.58.
The current positioning of the EMA lines shows that while there’s no clear trend dominance, both bullish and bearish scenarios remain possible depending on how the price reacts to these critical levels.
Disclaimer
In line with the Trust Project guidelines, this price analysis article is for informational purposes only and should not be considered financial or investment advice. BeInCrypto is committed to accurate, unbiased reporting, but market conditions are subject to change without notice. Always conduct your own research and consult with a professional before making any financial decisions. Please note that our Terms and Conditions, Privacy Policy, and Disclaimers have been updated.

Ethereum Trades At A Critical Level – Major Reclaim Or Steep Drop Ahead?

Berachain (BERA) Struggles at $6 Despite Weaker Bearish Signals

Paul Atkins To Face Nomination Hearing for US SEC Chair Role

SEC Likely to Approve Multiple Altcoin ETFs by Q2 2025
Analyst Confirms XRP Price Is Still On Path To $130

Cardano (ADA) Stalls as Volume Hits $1 Billion in 24 Hours

2.52 Million Altcoins Are Ruining Crypto’s Future

Animoca Brands Valuation Tanks 75% In Two Years, Here’s Why

Crypto exchange BingX hacked for $43 million

Are The Big Players Losing Interest?

Hong Kong’s Securities Association Tips Authorities On Crypto Self-Regulation

Coinbase cbBTC Set to go Live on Solana
2.52 Million Altcoins Are Ruining Crypto’s Future
Animoca Brands Valuation Tanks 75% In Two Years, Here’s Why
Crypto exchange BingX hacked for $43 million
Are The Big Players Losing Interest?
Hong Kong’s Securities Association Tips Authorities On Crypto Self-Regulation
Coinbase cbBTC Set to go Live on Solana
-
 Market23 hours ago
Pi Network Pioneers Allege Bot Activity on CoinMarketCap
-
 Altcoin24 hours ago
Analyst Reveal XRP Price Path To $5 as Ripple Vs SEC Lawsuit Ends
-
 Altcoin21 hours ago
Ethereum Price Stages Recovery As Analysts Claim The Bottom Is In
-

 Market18 hours ago
NinjaTrader Could Become Part of Kraken in $1.5 Billion Deal
-

 Market22 hours ago
Top 3 BNB Meme Coins to Watch Closely This Week
-

 Market19 hours ago
Uniswap Foundation Secures $165.5 Million for DeFi Innovation
-

 Altcoin19 hours ago
Memecoins Won’t Survive—Cathie Wood Predicts Their Demise
-
 Altcoin18 hours ago
Why Is Solana Price Up 6% Today?