
Market
Pi Network Pioneers Allege Bot Activity on CoinMarketCap

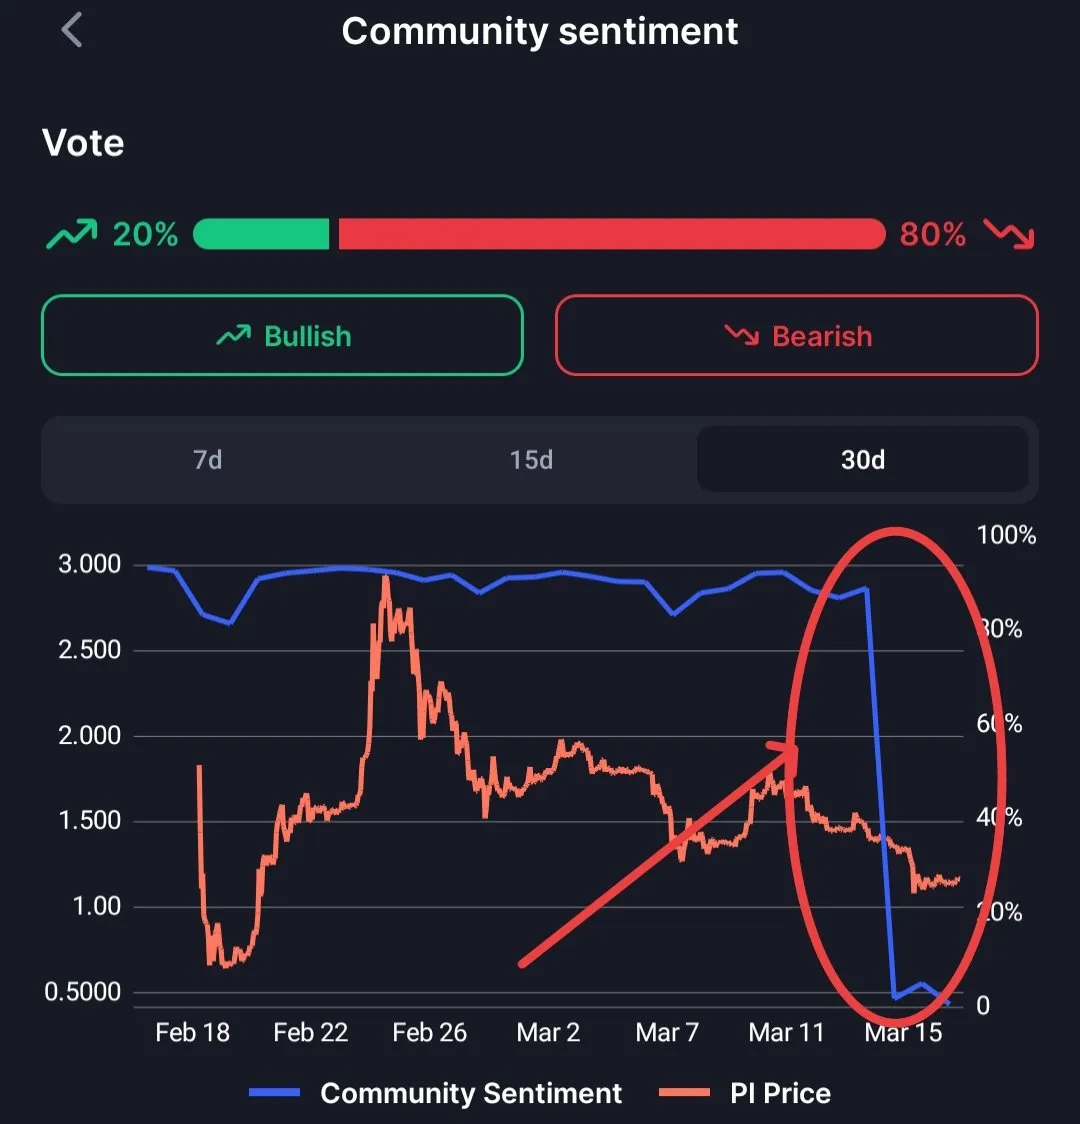
Pi Network’s community sentiment poll on CoinMarketCap fell dramatically today, leading to allegations of bot activity. Negative votes swarmed the site’s poll, while other community ratings stayed positive.
However, there is no clear proof either for or against these claims. Pi Network has suffered criticism and price setbacks recently, and its supporters have swayed polls, votes, and ratings on multiple occasions.
Since its launch on February 20, Pi Network has seen more than its share of controversies. Critics have attacked its accessibility, governance, transparency, and more, and multiple governments have called it a scam.
Today, however, Pi supporters raised concerns about bot activity on CoinMarketCap after the token’s community sentiment plummeted:
“It looks like somebody is using bots to vote against PI. I am 99% sure this is not an organic poll. Over 1.94 Million votes is even bigger than the BTC vote. 77% of the PI community is bullish on CoinGecko. Why is it so different on CoinMarketCap?” a Pioneer asked on social media.
Specifically, this user noted that Pi’s community sentiment plunged 90% in less than a day and that this poll had more participants than Bitcoin’s.
Other platforms with a similar voting mechanism kept Pi’s rating steady, leading him to conclude that bot activity was involved.
It’s very difficult to assess the veracity of these Pi Network bot allegations for several reasons. First of all, the token’s price has suffered dramatically this week.
Many users lost huge sums of Pi tokens after the KYC migration deadline, and massive investor sell-offs have triggered a price rout. Some of this negative sentiment may be genuine.
Additionally, it’s interesting that CoinMarketCap is the only platform involved in the Pi Network bot voting allegations. The firm refused to acknowledge Pi as one of the largest tokens by market cap, but it eventually relented.
Either the platform or its community could bear resentment towards Pi after these setbacks.
Furthermore, the community does have a reputation for vote brigading. Bybit’s CEO has repeatedly criticized Pi, and the token’s supporters review-bombed the Bybit app in response. They did a similar practice with Binance after the exchange delayed a Pi listing.
Ultimately, it seems very unlikely that disgruntled Pi supporters or committed haters spiked this poll without any bot activity. The negative votes came in absurdly fast, were isolated to one platform, and exceeded the votes for even the largest cryptoassets.
As of now, it remains challenging to find definitive proof either way.
Disclaimer
In adherence to the Trust Project guidelines, BeInCrypto is committed to unbiased, transparent reporting. This news article aims to provide accurate, timely information. However, readers are advised to verify facts independently and consult with a professional before making any decisions based on this content. Please note that our Terms and Conditions, Privacy Policy, and Disclaimers have been updated.


Cardano (ADA) has remained relatively stagnant, with its price barely moving from the levels seen seven days ago. Despite this lack of price action, trading volume has surged nearly 28% in the last 24 hours, climbing to $1 billion.
This increase in activity comes while ADA continues to consolidate, with technical indicators signaling indecision in the market. As momentum builds, traders are watching closely for signs of a breakout from this tight range.
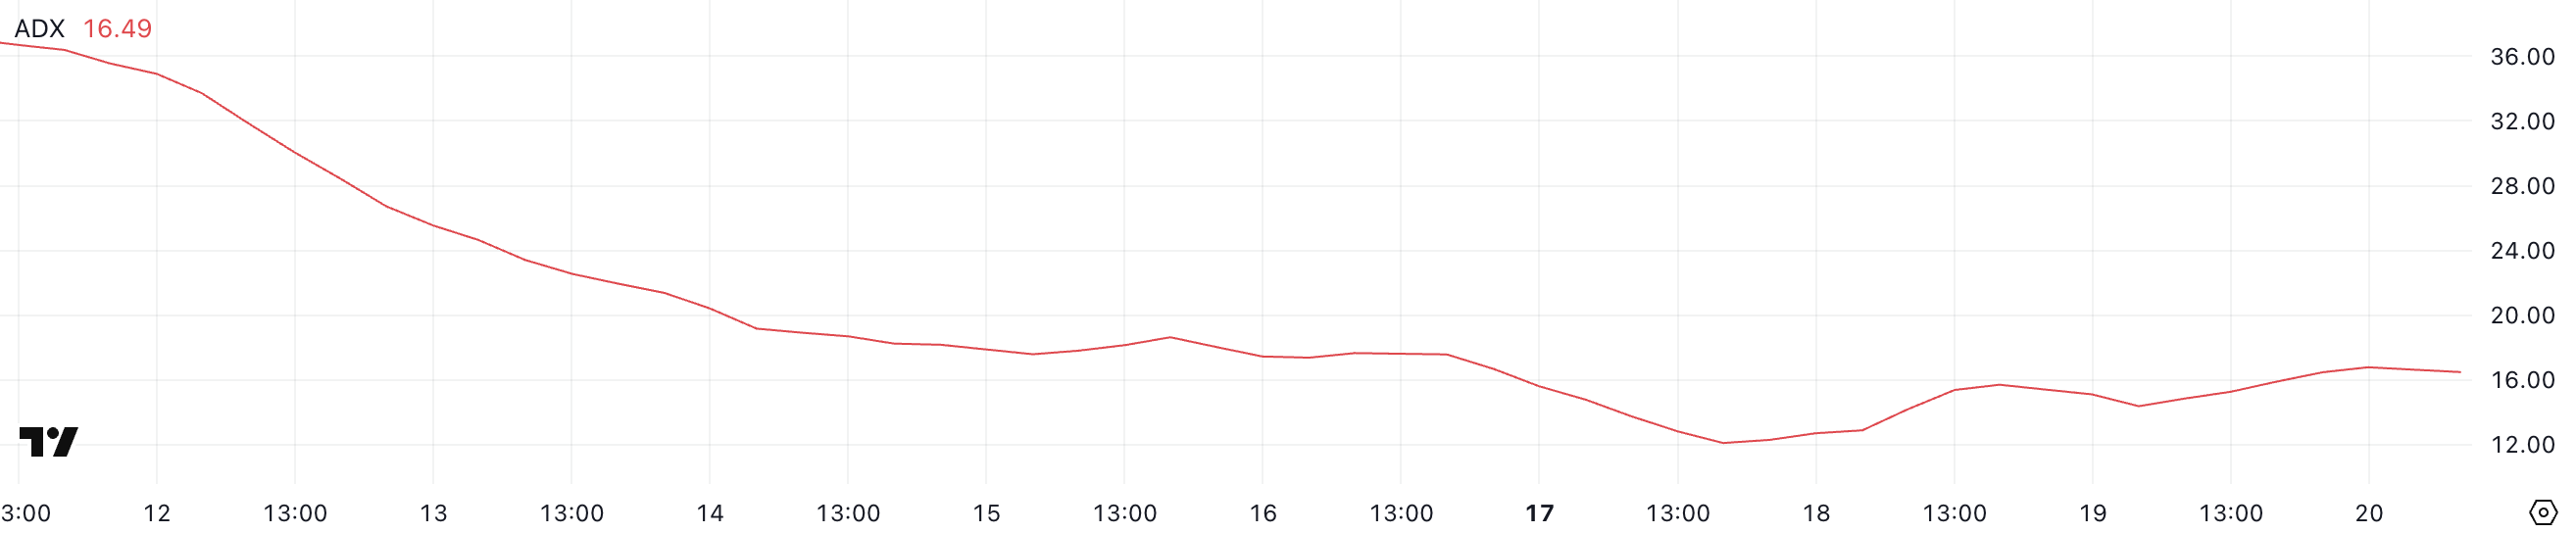
Cardano ADX Shows The Lack Of A Clear Direction
Cardano’s trend strength has remained relatively unchanged, with its ADX currently at 16.49 – roughly the same level it has maintained since yesterday.
This flat movement in the ADX suggests that there hasn’t been a significant shift in momentum, and the market lacks a clear directional trend.
ADA’s price is currently caught in a consolidation phase, with neither buyers nor sellers able to establish dominance, which is reflected in the stagnant ADX reading.
The ADX (Average Directional Index) is a technical indicator used to measure the strength of a trend without indicating its direction.
An ADX below 20 typically signals a weak or non-existent trend, while readings between 20 and 40 point to a developing or moderate trend, and values above 40 indicate a strong trend.
With ADA’s ADX holding below the 20 mark, it suggests that the current market environment remains indecisive, likely leading to continued sideways movement.
For now, this consolidation phase could persist until a stronger directional move emerges, either through renewed buying momentum or an increase in selling pressure.
Cardano Whales Dip to July 2024 Lows
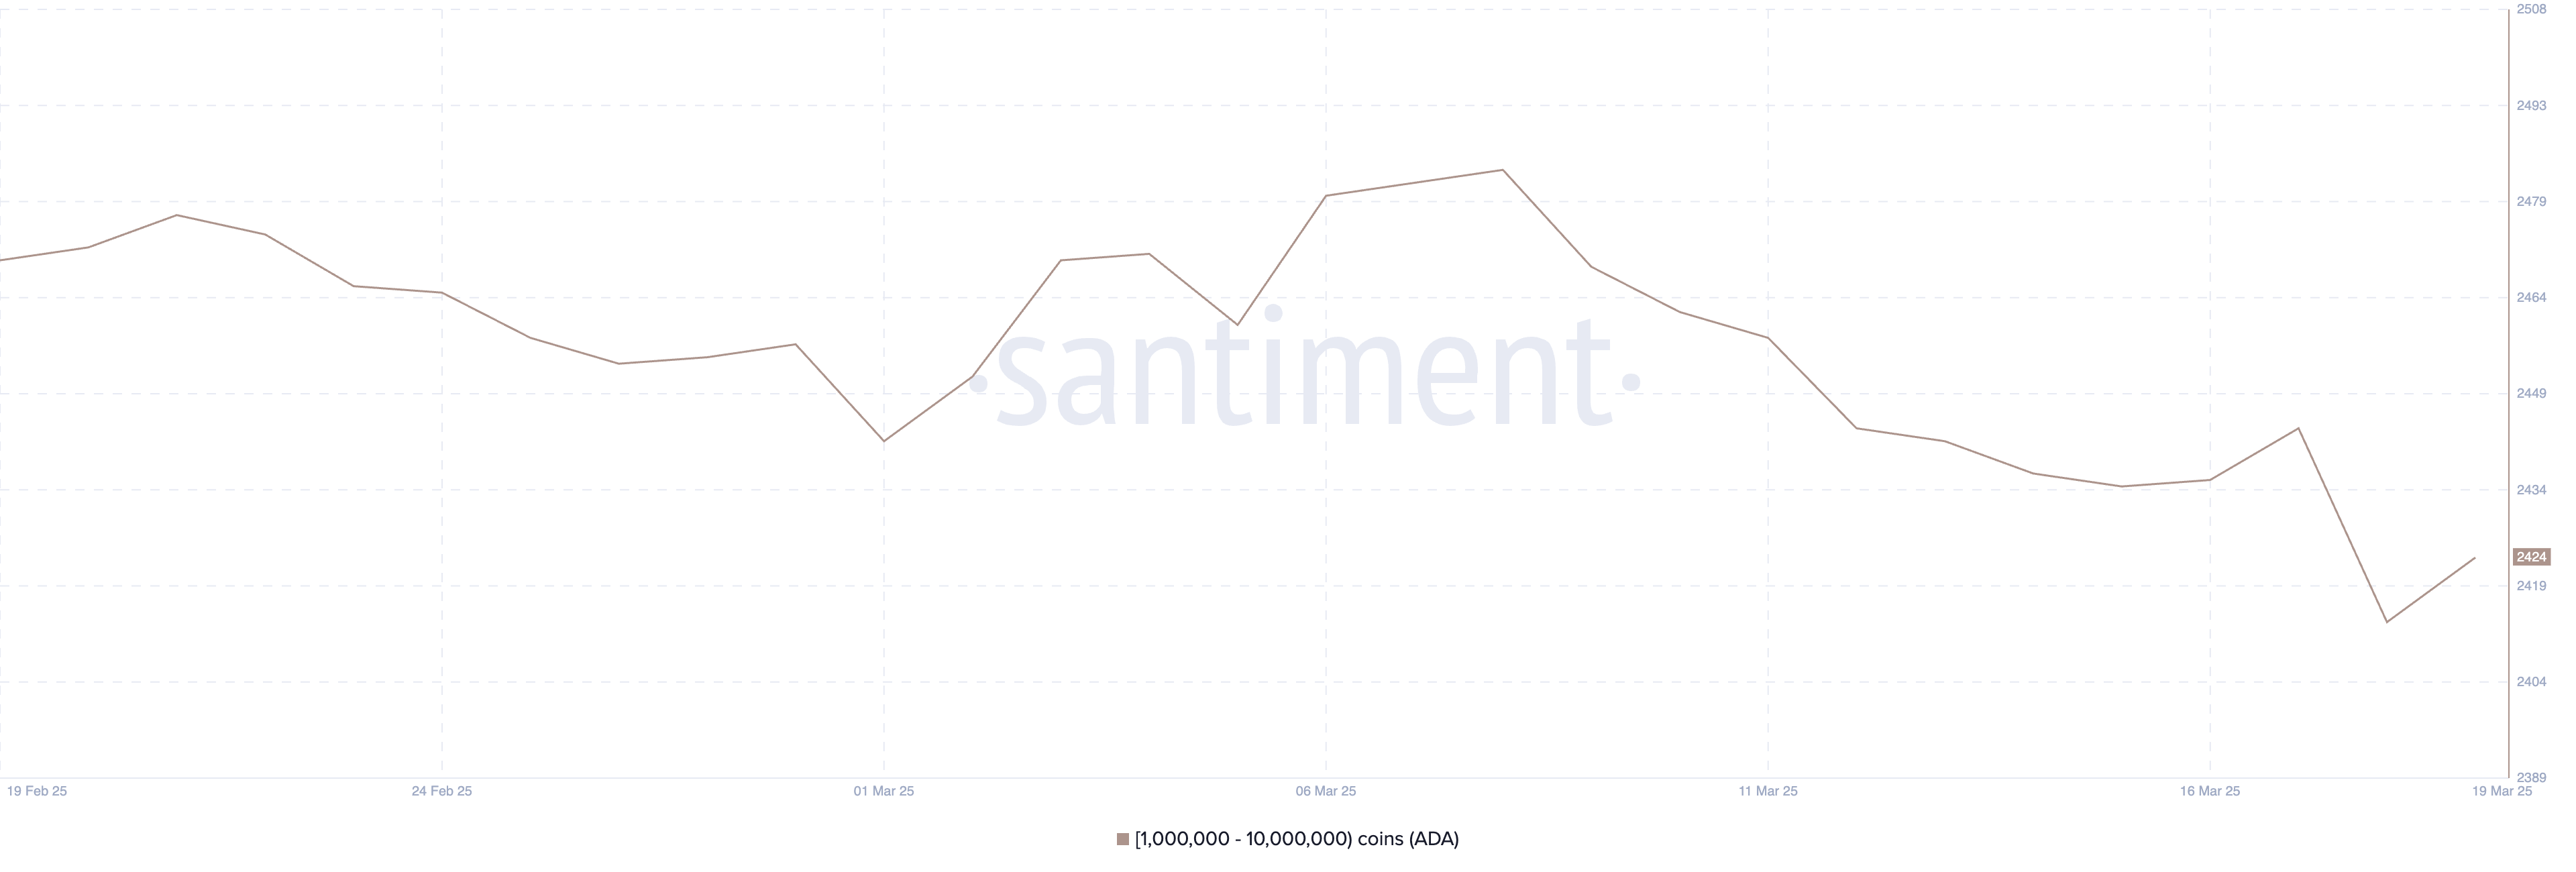
The number of Cardano whales experienced a sharp decline between March 8 and March 18. These are wallets holding between 1 million and 10 million ADA.
According to Santiment data, the number of ADA whales fell from 2,484 to just 2,414, marking the lowest level since July 2024.
On March 19, there was a slight recovery, with the number of whales rising to 2,424.
While this minor rebound shows some renewed accumulation, the overall count remains well below the levels seen in previous weeks, highlighting reduced participation from larger holders during this period.
Tracking ADA whales is crucial because these large addresses often play a significant role in influencing price action. Whales can create liquidity shifts and often act as a signal for institutional or high-net-worth investor sentiment.
The current lower whale count suggests that confidence among these key players might still be cautious.
Even with the recent uptick, whale numbers remaining below their earlier highs could point to subdued buying pressure, potentially limiting ADA’s ability to break out of its current consolidation phase in the near term.
Cardano Is Trading Between a Critical Range
Cardano EMA lines signal a consolidation phase. The short-term moving averages remain below the long-term ones but are currently very close together, indicating a lack of strong momentum in either direction.
This setup suggests indecision in the market, but it also leaves room for a potential breakout. If Cardano price manages to build bullish momentum and establish an uptrend, it could first target the $0.77 resistance.
A successful breakout above this level could pave the way for a rally toward $1.02, and if buying pressure continues, ADA might even push as high as $1.17.
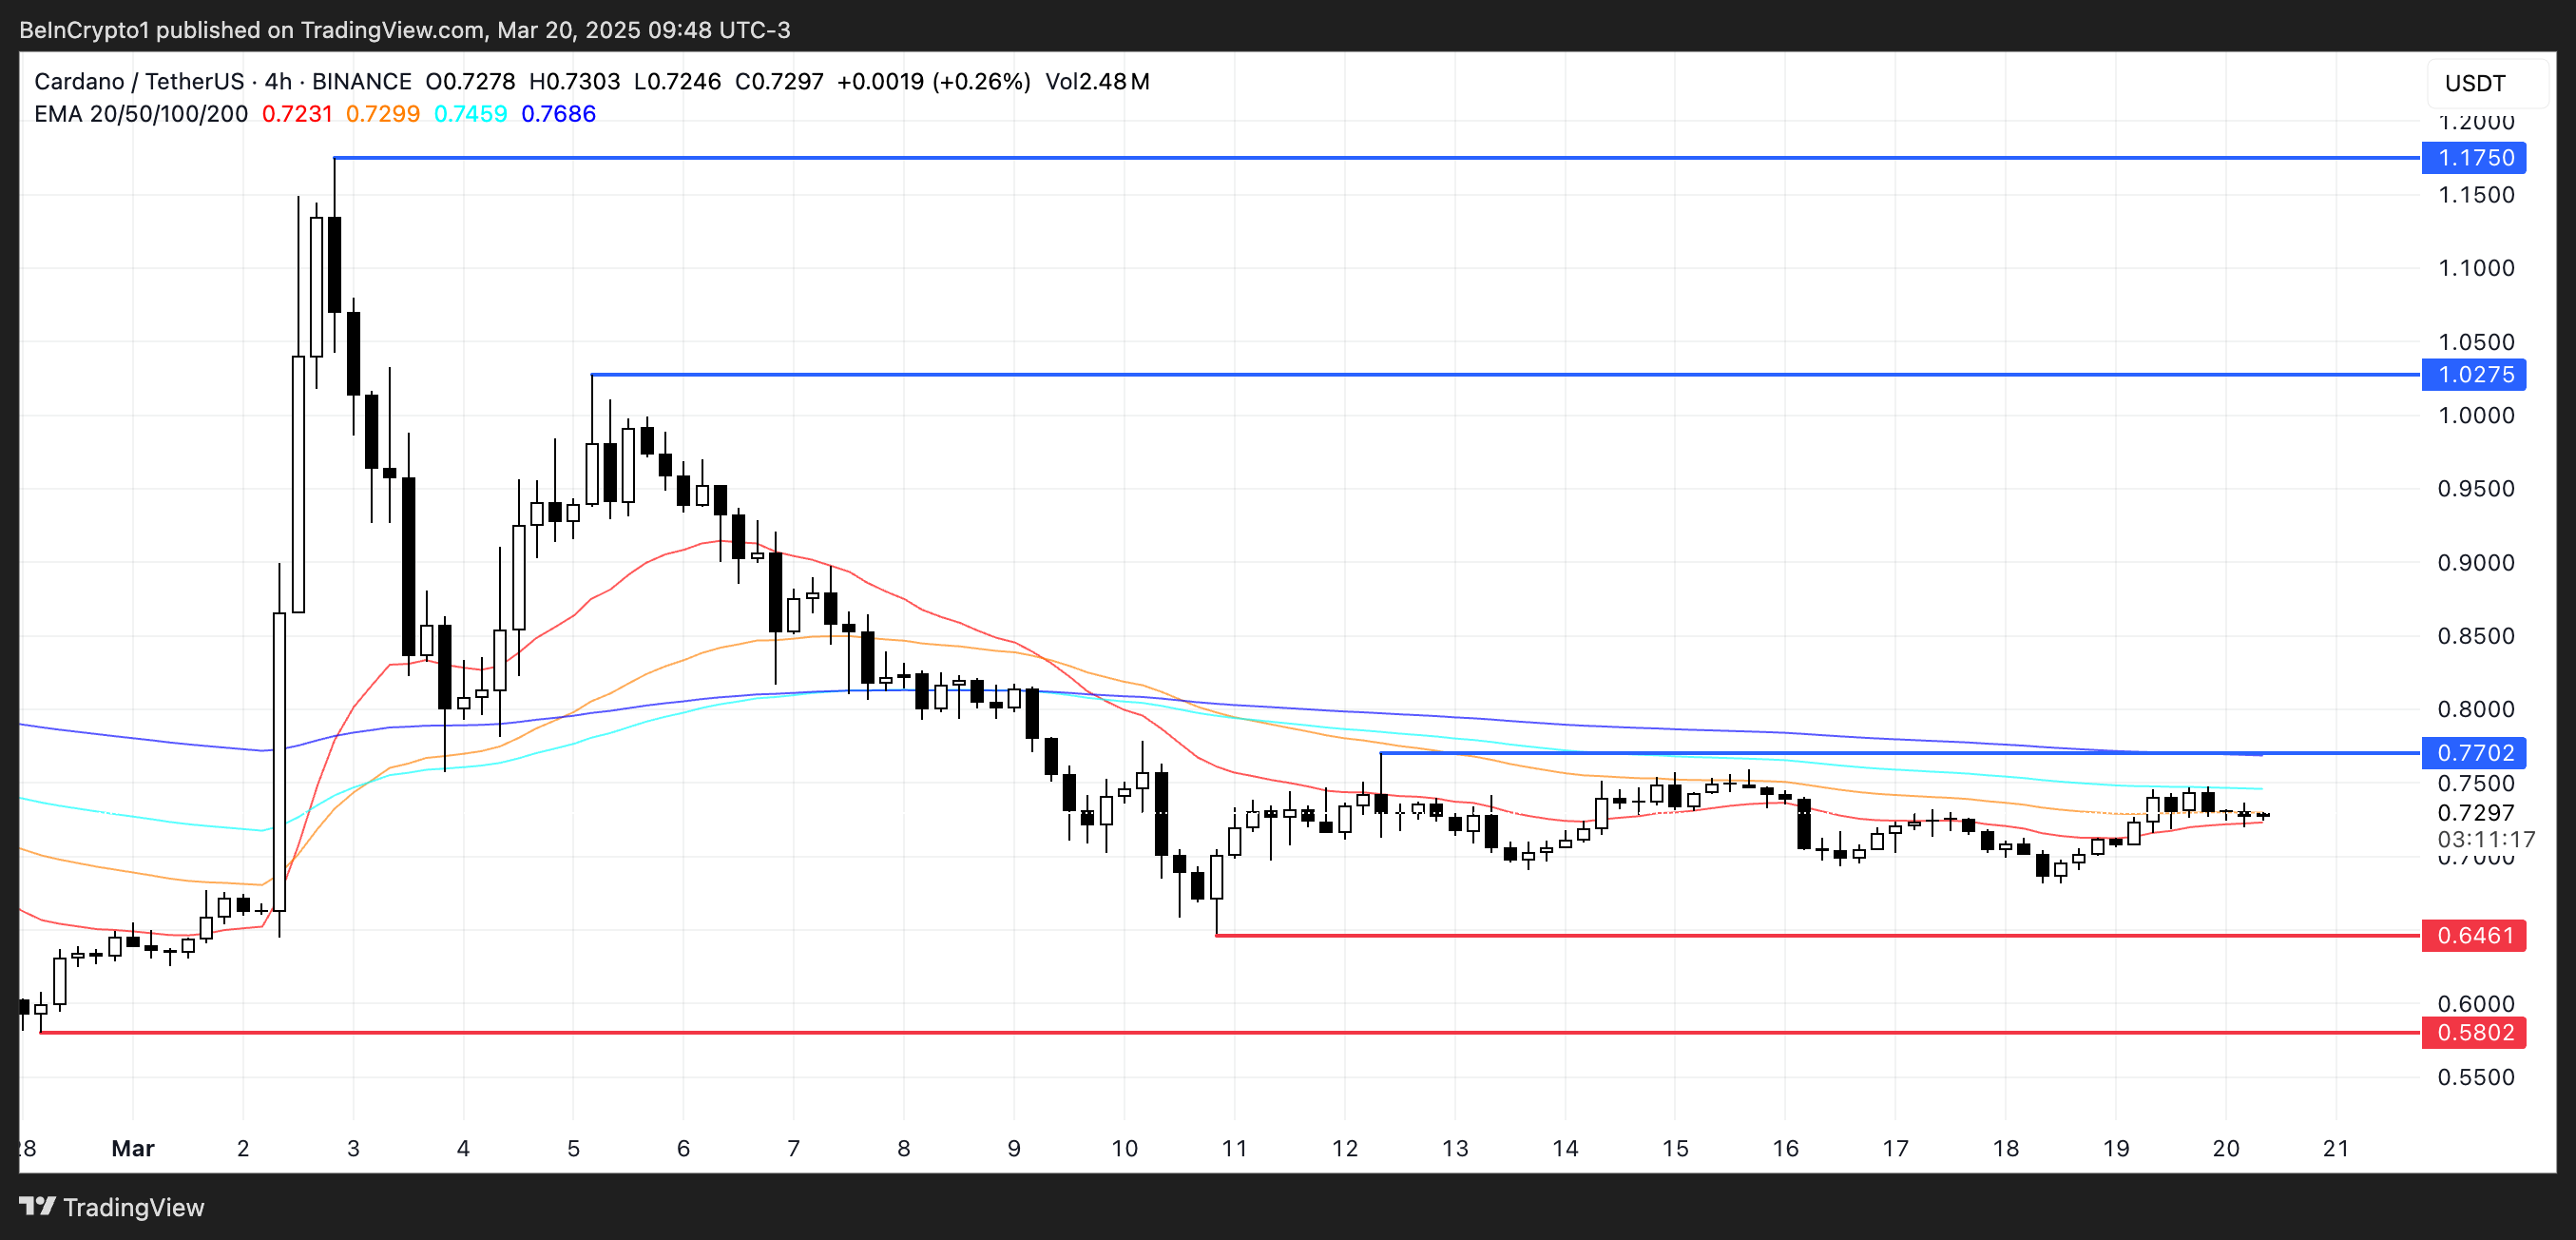
On the flip side, if a downtrend develops, ADA could fall back to test the key support level at $0.64.
Losing this support would be a bearish signal and could trigger a deeper decline toward $0.58.
The current positioning of the EMA lines shows that while there’s no clear trend dominance, both bullish and bearish scenarios remain possible depending on how the price reacts to these critical levels.
Disclaimer
In line with the Trust Project guidelines, this price analysis article is for informational purposes only and should not be considered financial or investment advice. BeInCrypto is committed to accurate, unbiased reporting, but market conditions are subject to change without notice. Always conduct your own research and consult with a professional before making any financial decisions. Please note that our Terms and Conditions, Privacy Policy, and Disclaimers have been updated.

Onyxcoin (XCN) has been under significant selling pressure, correcting by 9.4% over the last seven days and plunging by 43% in the past 30 days.
The downtrend has left XCN struggling to regain its footing as technical indicators continue to point toward a bearish market structure. Despite short-lived attempts at recovery, the asset has remained weighed down by persistent bearish momentum.
Onyxcoin RSI Has Been Below 50 For Almost 5 Days
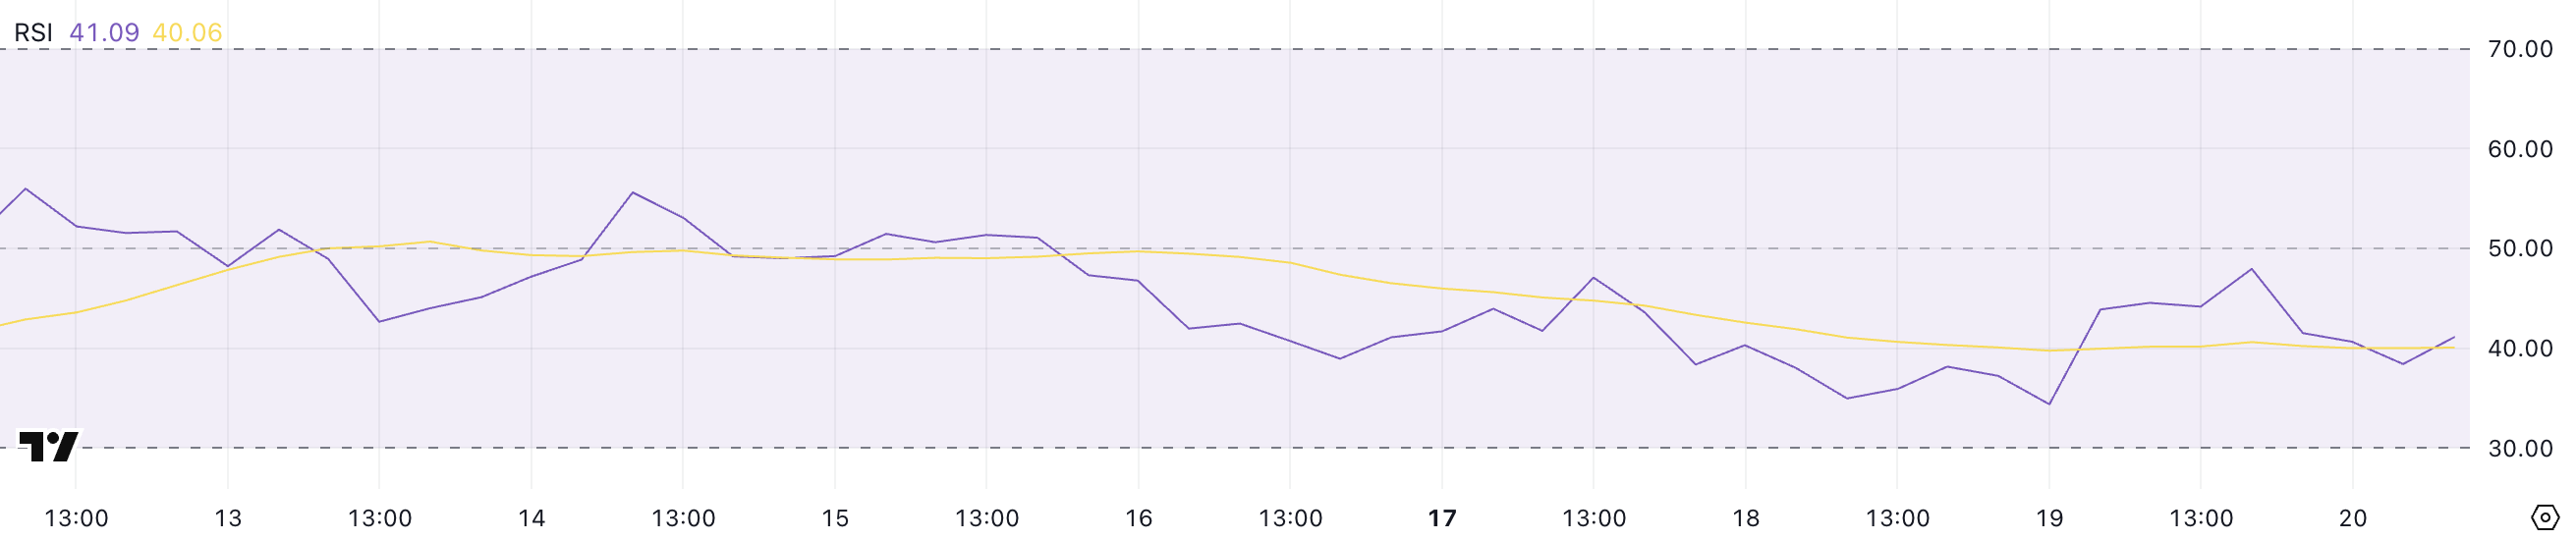
Onyxcoin RSI is currently sitting at 41.09, marking a decline from yesterday’s level of 47.95. This drop indicates that bearish momentum has been gaining ground over the past 24 hours, pushing the RSI further away from the neutral 50 mark.
Since March 15, XCN’s RSI has remained consistently below 50, signaling that the asset has been under persistent selling pressure.
The continued weakness reflected in the RSI suggests that bulls are struggling to regain control, keeping the price in a bearish or consolidative phase.
The RSI (Relative Strength Index) is a momentum oscillator that measures the speed and magnitude of recent price changes to evaluate overbought or oversold conditions.
Typically, an RSI above 70 signals that an asset might be overbought and due for a pullback, while an RSI below 30 indicates that the asset could be oversold and might see a bounce. With XCN’s RSI at 41.09 and stuck below 50 for several days, it suggests the market remains tilted toward bearish sentiment.
While it’s not yet in oversold territory, the ongoing sub-50 readings highlight the lack of bullish momentum and could imply continued sideways or downward movement unless buyers step in to reverse the trend.
XCN BBTrend Shows Selling Pressure Is Still Here
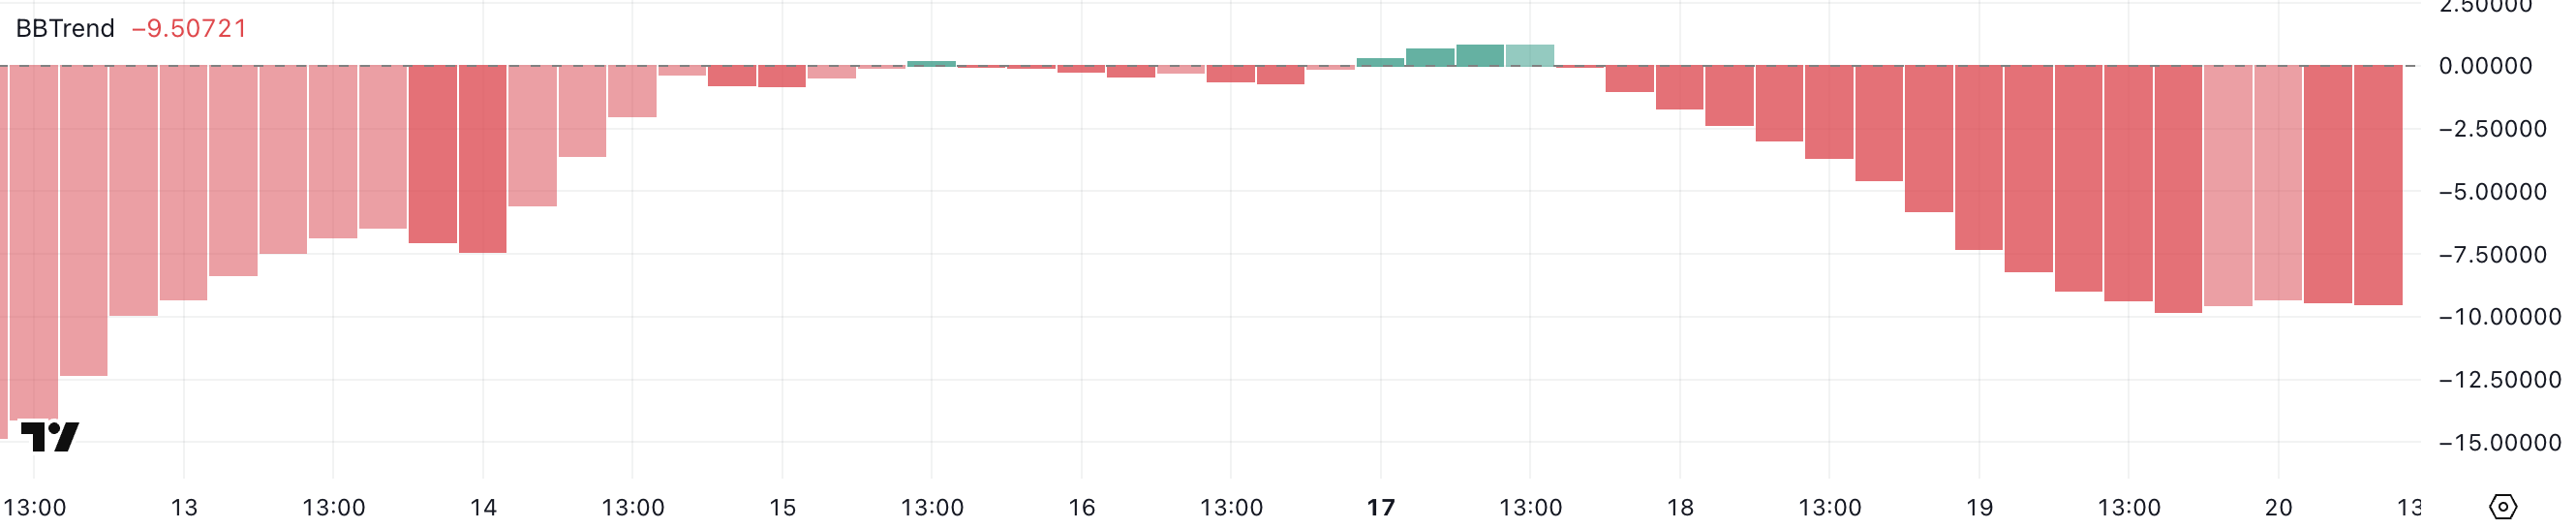
Onyxcoin BBTrend is currently at -9.5 and has remained in negative territory for the past two days, signaling a bearish environment.
Earlier, on March 17, BBTrend briefly turned positive at 0.83 but failed to sustain upward momentum, quickly reverting back below zero. This inability to maintain positive readings suggests that bullish attempts have been weak and short-lived, reinforcing the notion that sellers continue to dominate the market.
The deepening negative value of the BBTrend reflects ongoing pressure on XCN’s price, keeping it under strain.
The BBTrend, or Bollinger Band Trend indicator, measures price trends based on the positioning of price action relative to the Bollinger Bands.
When BBTrend values are above zero, it indicates that the price is trading above the midline (typically the 20-period moving average), suggesting bullish momentum. Conversely, negative values point to prices trending below the midline, indicating bearish momentum.
With XCN’s BBTrend at -9.5 and struggling to establish positive values, it signals that the asset continues to lack strong bullish pressure, leaving the price vulnerable to further downside or prolonged consolidation.
Will Onyxcoin Fall Below $0.010 In March?
Onyxcoin EMA lines are showing a bearish configuration, with short-term moving averages positioned below the long-term ones.
This alignment suggests that downward momentum is prevailing, increasing the likelihood of further price declines. If XCN continues to trend lower, it could fall below the key support at $0.010, a level not seen since January 17.
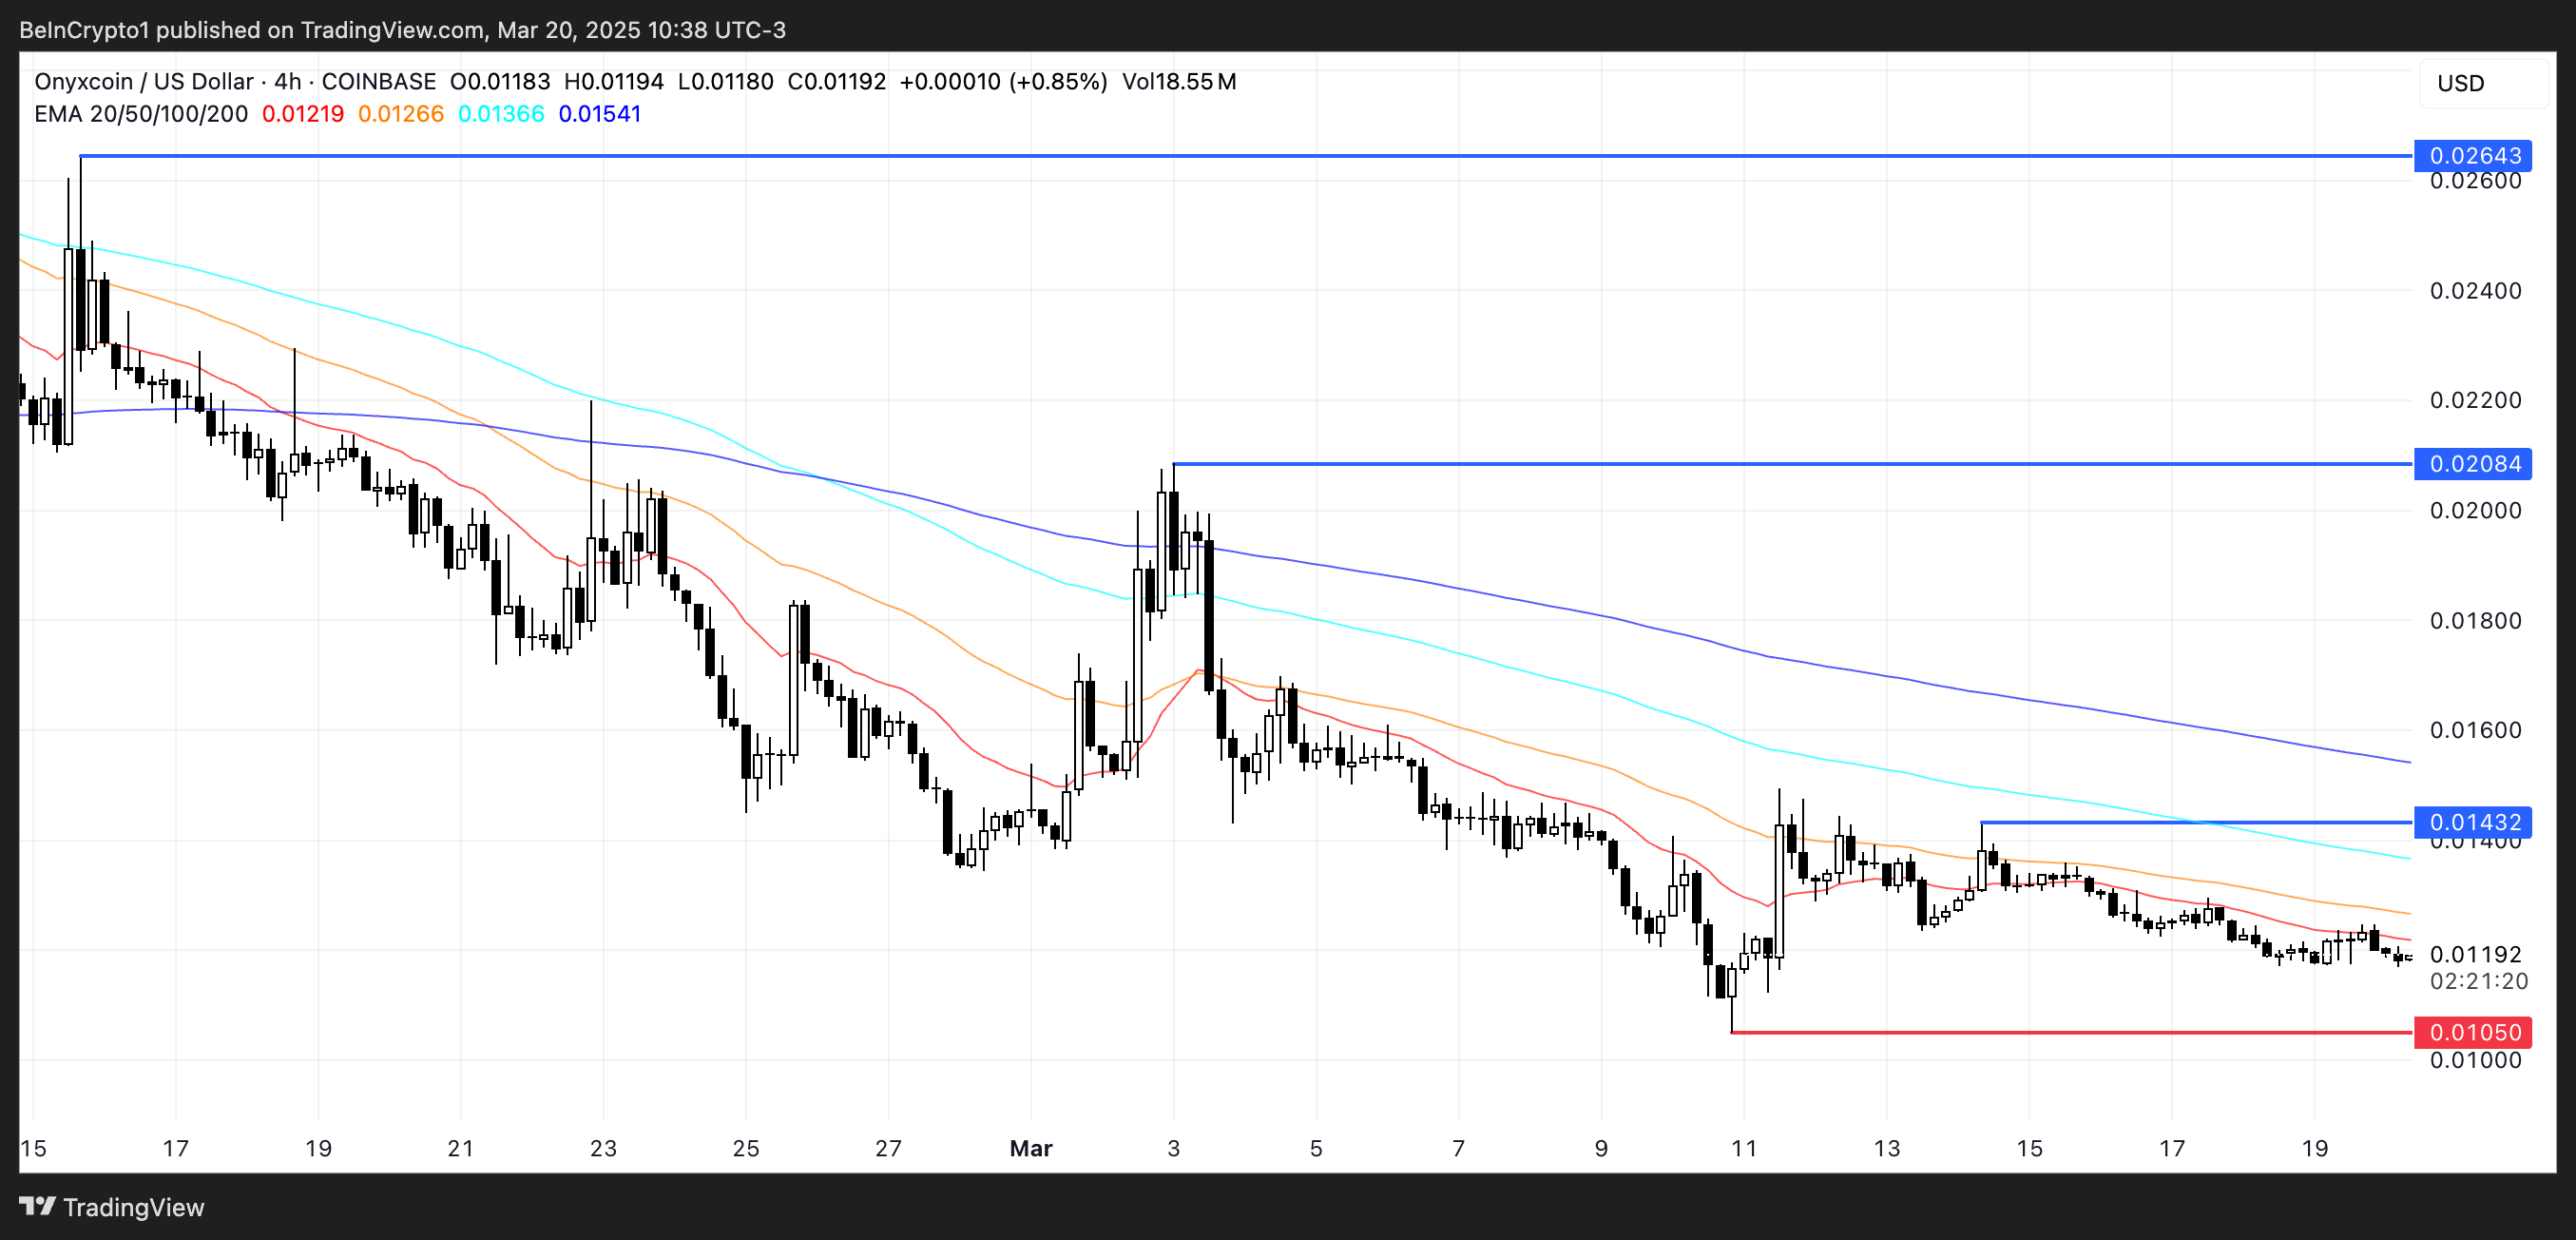
However, if Onyxcoin manages to regain the strong bullish momentum it demonstrated at the end of January – when it became one of the best-performing altcoins in the market – it could reverse this setup.
In that case, XCN might challenge resistance levels at $0.014 and $0.020, with the potential to climb as high as $0.026 if buyers step in aggressively.
Disclaimer
In line with the Trust Project guidelines, this price analysis article is for informational purposes only and should not be considered financial or investment advice. BeInCrypto is committed to accurate, unbiased reporting, but market conditions are subject to change without notice. Always conduct your own research and consult with a professional before making any financial decisions. Please note that our Terms and Conditions, Privacy Policy, and Disclaimers have been updated.

XRP has been attempting a recovery recently, showing positive price movement. The surge is fueled by a shift in investor sentiment, with many holders now taking a more bullish stance toward the altcoin.
This change is likely to drive the price higher, possibly targeting the $3.00 mark.
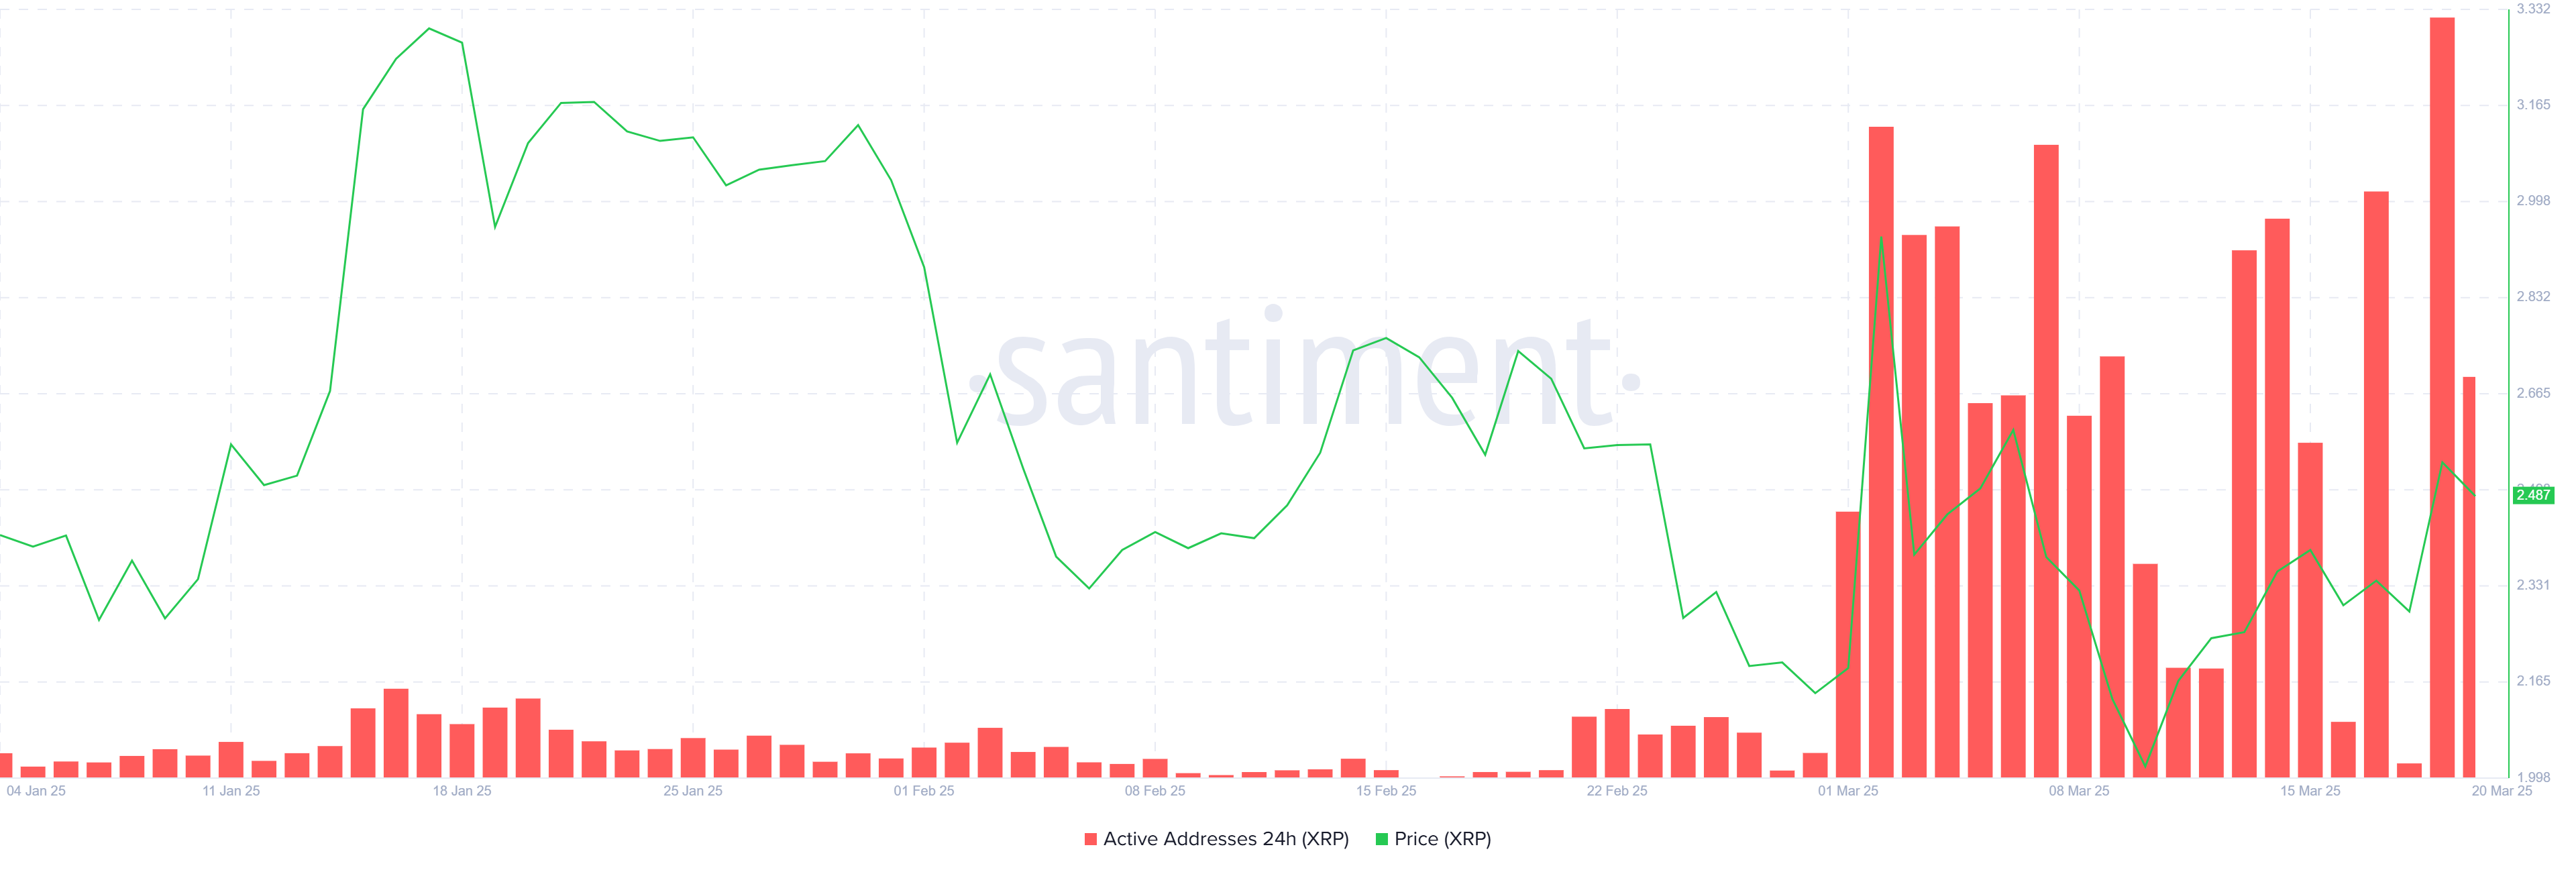
XRP Holders Seem Bullish
Active addresses on the XRP network have remained notably high throughout March, signaling increased investor engagement averaging at 363,000. This consistent activity is a clear indication that investor sentiment has shifted positively compared to January and February.
The growth in active addresses reflects stronger support for the altcoin as more participants continue to engage with the network. As the demand for XRP increases, this heightened engagement could push the price to higher levels.
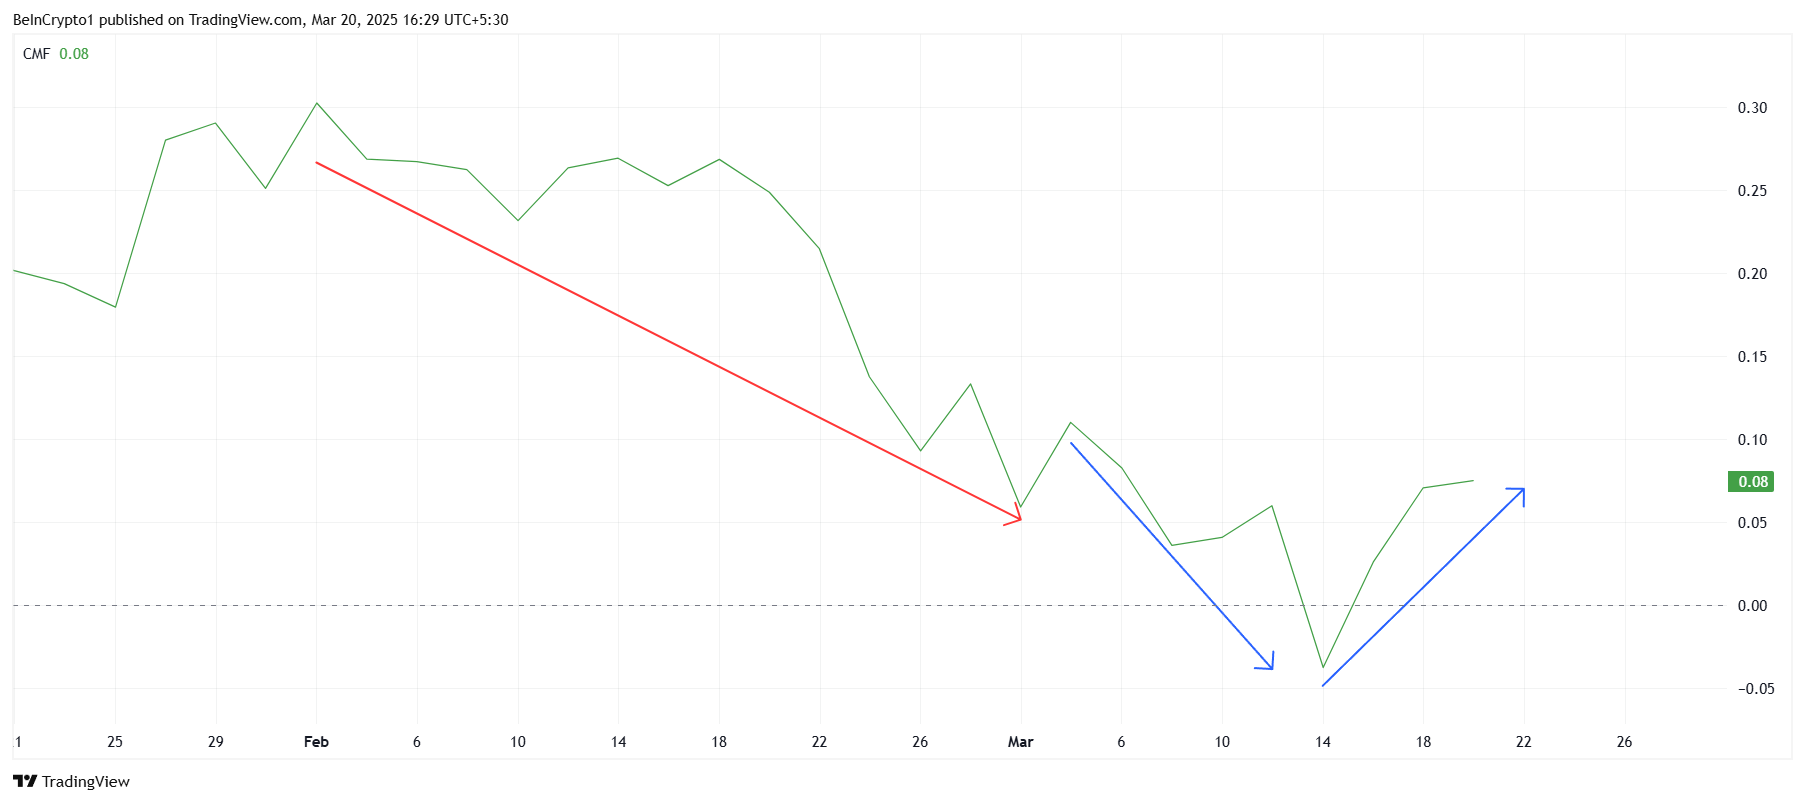
The Chaikin Money Flow (CMF) indicator shows a clear shift in investor behavior. While March began with significant outflows, the trend reversed as investors poured money back into XRP. This positive change comes after a month of outflows in February, reflecting a shift towards accumulation.
As market conditions fluctuate, XRP investors have shown resilience, continuing to buy into the asset despite external volatility. The increase in capital inflows suggests that the market is stabilizing, with XRP gaining support from those confident in its future. This shift in momentum offers XRP room to grow and continue its upward trajectory.
XRP Price Faces Resistance
XRP price is trading at $2.48 today, marking a 22% increase over the last ten days. The altcoin is now testing the resistance at $2.56, a level it has struggled to surpass in the past. Given the positive market sentiment and increased investor participation, XRP could break through this barrier.
If XRP manages to flip the $2.56 resistance into support, the next target will be $3.00. Overcoming the $2.95 resistance would pave the way for further gains, with the price potentially climbing towards the $3.00 mark. The current bullish momentum supports this outlook as investors appear ready to push the price higher.
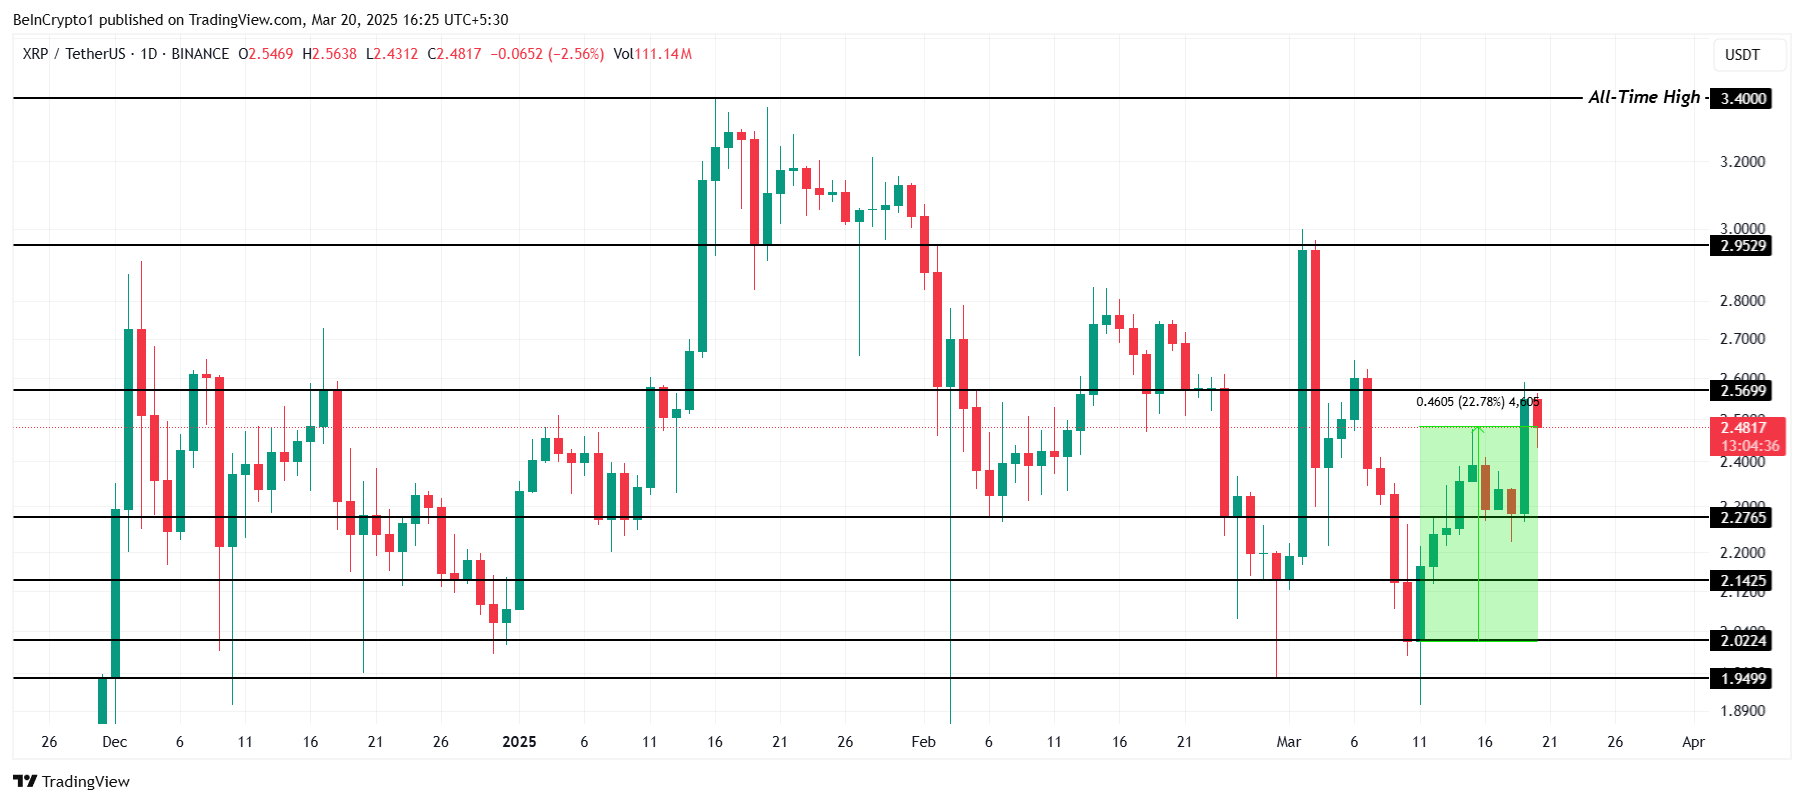
However, if XRP fails to breach the $2.56 resistance, it could face a pullback to $2.27. Losing the support at $2.27 would invalidate the bullish outlook, sending the price down to $2.14.
Disclaimer
In line with the Trust Project guidelines, this price analysis article is for informational purposes only and should not be considered financial or investment advice. BeInCrypto is committed to accurate, unbiased reporting, but market conditions are subject to change without notice. Always conduct your own research and consult with a professional before making any financial decisions. Please note that our Terms and Conditions, Privacy Policy, and Disclaimers have been updated.
Analyst Confirms XRP Price Is Still On Path To $130

Cardano (ADA) Stalls as Volume Hits $1 Billion in 24 Hours

Ethereum CLS Shows Price Will Rebound Above $2,600, Here’s Why

Onyxcoin (XCN) Drops 40% In March as Bears Take Over

US SEC Exempts Proof-Of-Work Mining From Security Obligations

Here’s Why XRP Holders Will Likely Drive Price To $3.00

2.52 Million Altcoins Are Ruining Crypto’s Future

Animoca Brands Valuation Tanks 75% In Two Years, Here’s Why

Crypto exchange BingX hacked for $43 million

Are The Big Players Losing Interest?

Hong Kong’s Securities Association Tips Authorities On Crypto Self-Regulation

Coinbase cbBTC Set to go Live on Solana
2.52 Million Altcoins Are Ruining Crypto’s Future
Animoca Brands Valuation Tanks 75% In Two Years, Here’s Why
Crypto exchange BingX hacked for $43 million
Are The Big Players Losing Interest?
Hong Kong’s Securities Association Tips Authorities On Crypto Self-Regulation
Coinbase cbBTC Set to go Live on Solana
-

 Ethereum22 hours ago
Ethereum’s Price Action Paints One Of Its Worst Charts Ever, What Comes Next For ETH?
-
 Regulation24 hours ago
President Trump To Address Crypto Summit Amid Bitcoin Reserve Strategy
-

 Market22 hours ago
Hyperliquid (HYPE) Might Hit $20 Amid Potential Golden Cross
-

 Market16 hours ago
NinjaTrader Could Become Part of Kraken in $1.5 Billion Deal
-
 Altcoin22 hours ago
Analyst Reveal XRP Price Path To $5 as Ripple Vs SEC Lawsuit Ends
-

 Market20 hours ago
Top 3 BNB Meme Coins to Watch Closely This Week
-

 Market19 hours ago
Redstone (RED) Shows Mixed Market Signals: Will It Hit $1?
-
 Altcoin19 hours ago
Ethereum Price Stages Recovery As Analysts Claim The Bottom Is In