
Market
ADA Whales Fuel Bullish Momentum by Acquiring 190 Million Coins
Cardano has noted significant whale activity over the past 24 hours, aligning with the broader market recovery. During that period, the total crypto market capitalization has added another $50 billion, signaling renewed bullish momentum.
As bullish pressure strengthens, ADA appears poised to re-commence an upward trend.
Cardano Sees Heavy Whale Accumulation
On-chain data shows that Cardano whales, holding between 100 million and 1 billion coins, have acquired 190 million ADA in the past 24 hours. This cohort of large ADA investors currently holds 3.22 billion coins.
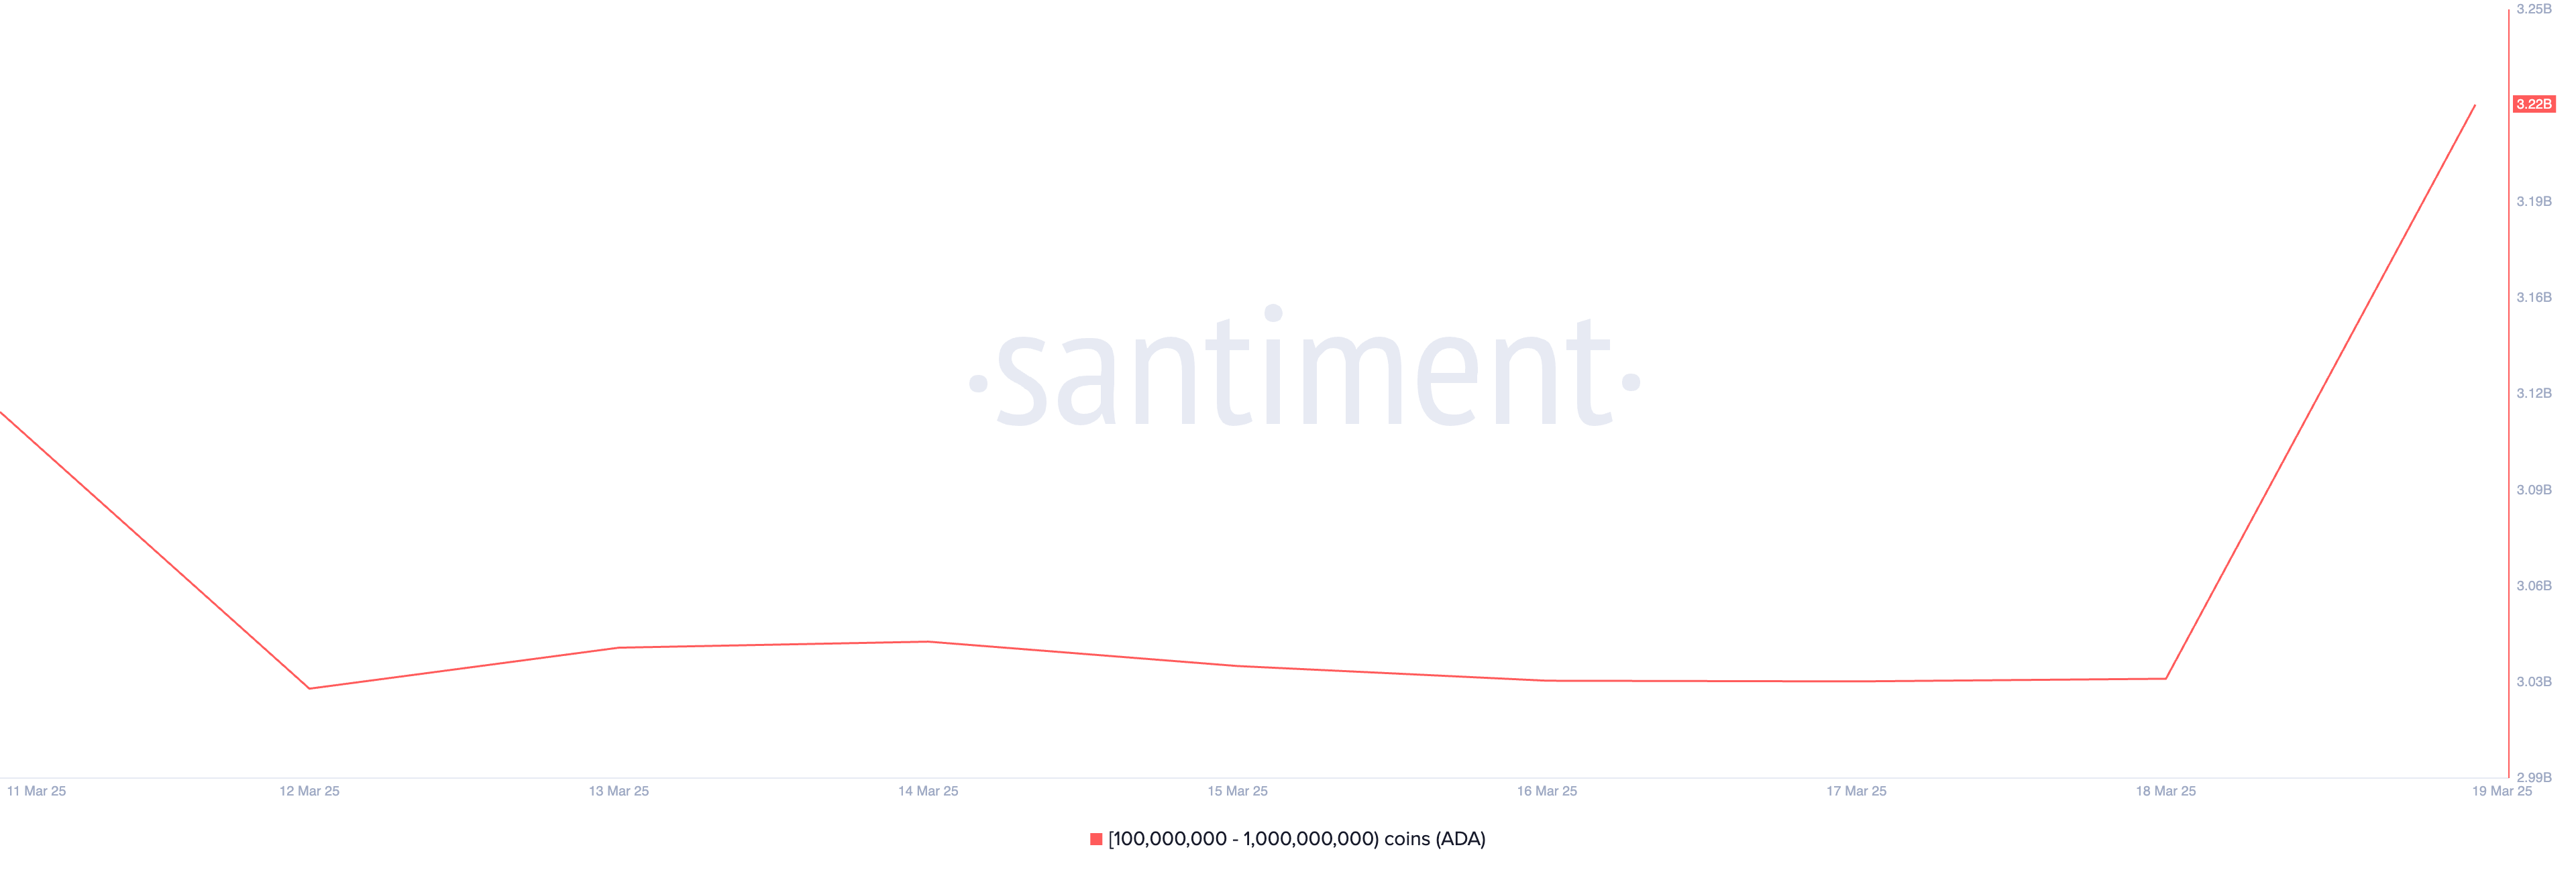
When whales increase their coin holdings, it signals strong confidence in the asset’s future price potential.
Large-scale accumulation like this would reduce ADA’s available supply in the market, which can drive up its price if demand remains steady. The trend indicates a bullish outlook, as whales typically buy in anticipation of higher prices.
ADA’s Network Realized Profit/Loss (NPL) further supports this bullish outlook. At press time, it stands at -15.87 million.
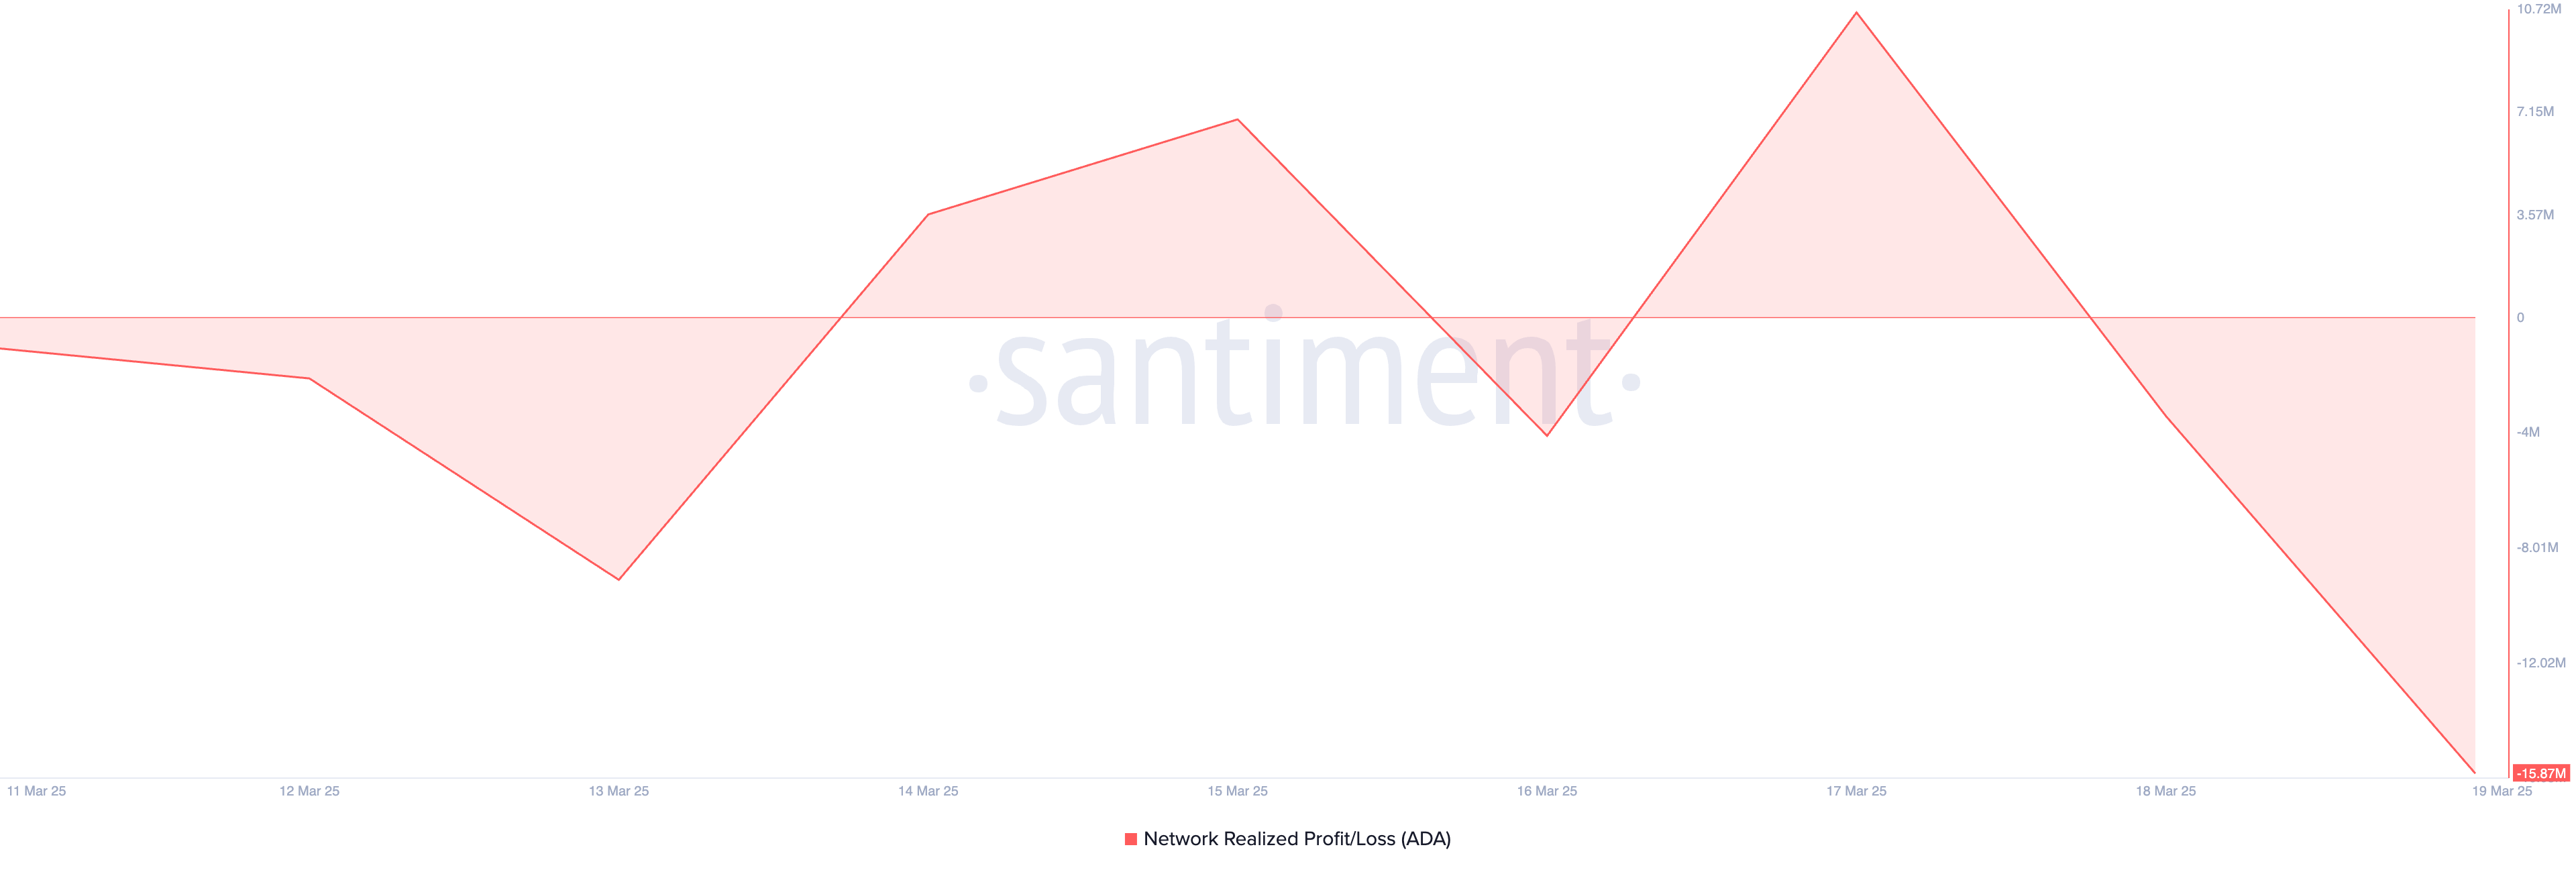
This metric measures the net profit or loss of all coins moved on the blockchain depending on their acquisition cost. When an asset’s NPL is negative, many investors are holding at a loss.
This situation is known to reduce the selling pressure in the market, as traders may choose to hold their assets instead of realizing losses, which could support a potential price rebound.
The steady dip in ADA’s NPL indicates that many holders are sitting on unrealized losses. To avoid selling at a loss, they may choose to hold onto their investments, reducing selling pressure. The increased holding time could, in turn, drive up ADA’s price as supply tightens in the market.
ADA’s Buying Pressure Increases—Will It Fuel a Price Breakout?
At press time, ADA trades at $0.72. On the daily chart, the coin’s Chaikin Money Flow (CMF) is in an uptrend and poised to cross above the zero line, highlighting the rise in buying pressure.
The indicator measures fund flows into and out of an asset. When it attempts to break above the zero line, it signals a potential shift from selling pressure to buying pressure.
If the breakout is sustained, it would confirm strengthening bullish momentum in the ADA market and hint at a potential price uptrend. In this case, the coin’s price could rally toward $0.82.
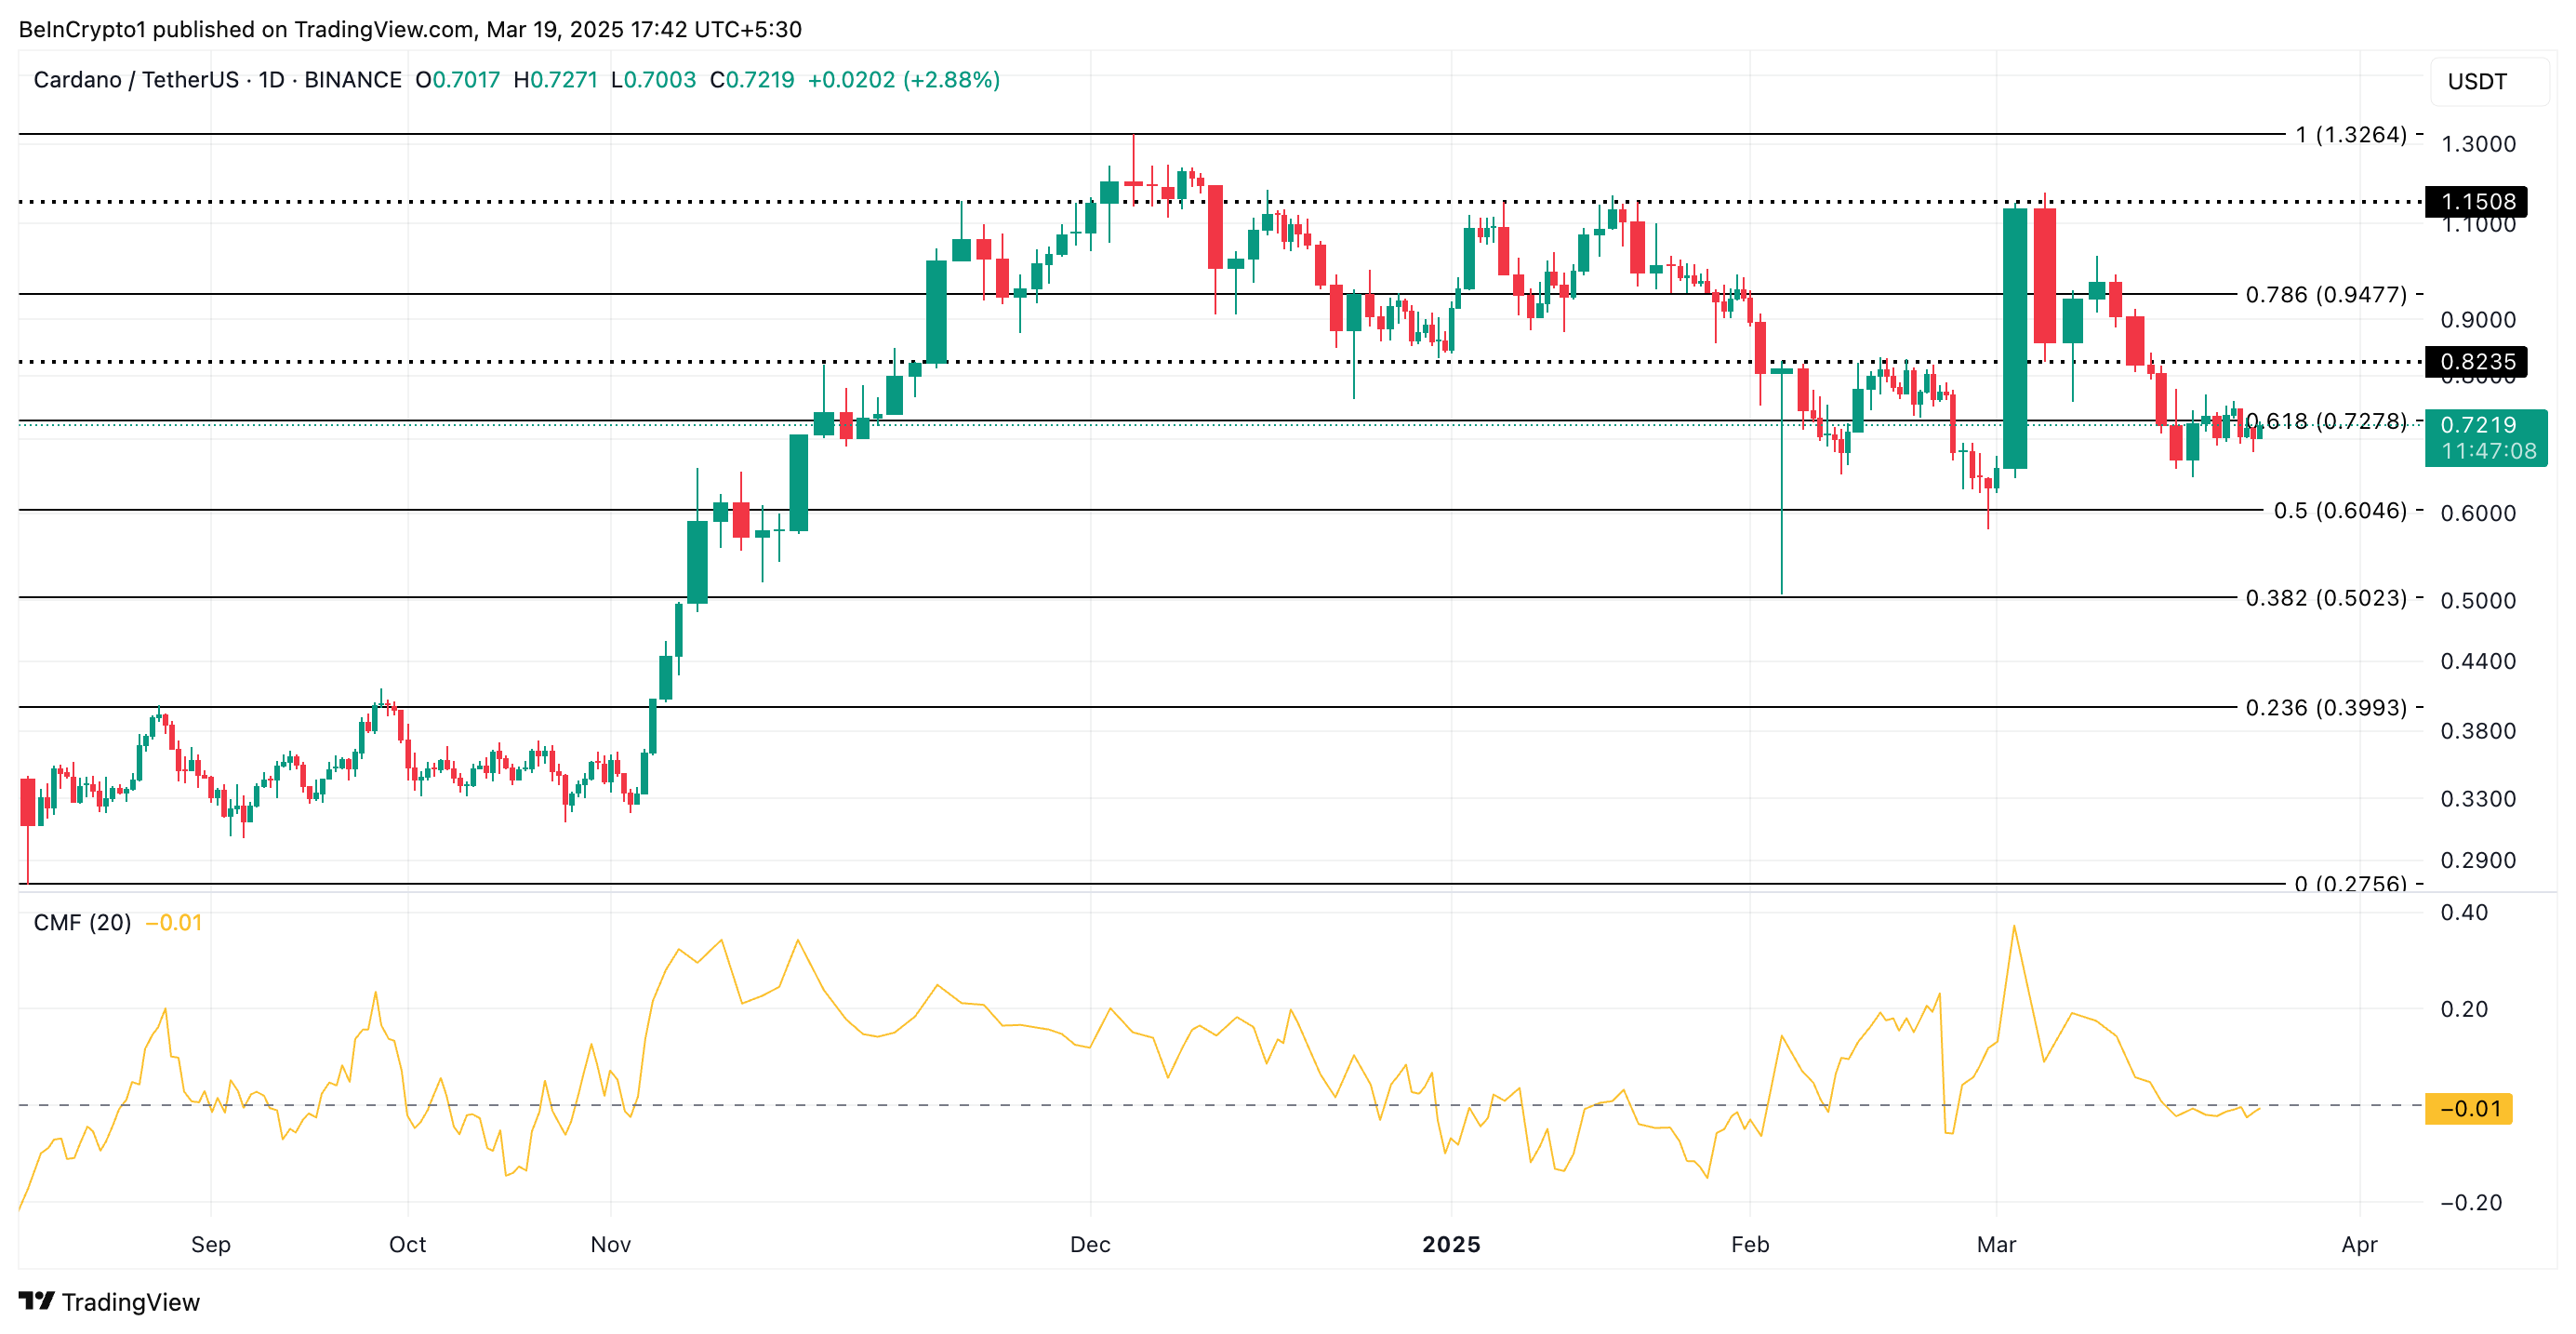
However, if selloffs intensify, this bullish projection will be invalidated. In that scenario, ADA’s price could fall to $0.60.
Disclaimer
In line with the Trust Project guidelines, this price analysis article is for informational purposes only and should not be considered financial or investment advice. BeInCrypto is committed to accurate, unbiased reporting, but market conditions are subject to change without notice. Always conduct your own research and consult with a professional before making any financial decisions. Please note that our Terms and Conditions, Privacy Policy, and Disclaimers have been updated.


PI has been in a persistent downtrend since the start of March. With bearish pressure intensifying over the past week, the token has shed 32% of its value in seven days.
Further losses appear likely as selling pressure strengthens among PI market holders.
PI Bulls Struggle as Trading Activity Plummets
PI currently trades at $1.17, noting a 1% price rise over the past day. Despite this modest uptick, PI’s declining trading volume suggests that the slight rebound is not backed by strong demand for the altcoin. It merely mirrors the broader market growth recorded over the past 24 hours.
During the review period, PI’s trading volume totals $366 million, down 37%. When an asset’s price rises while trading volume declines, it suggests that the upward movement lacks strong buyer participation, making the rally weak or unsustainable.
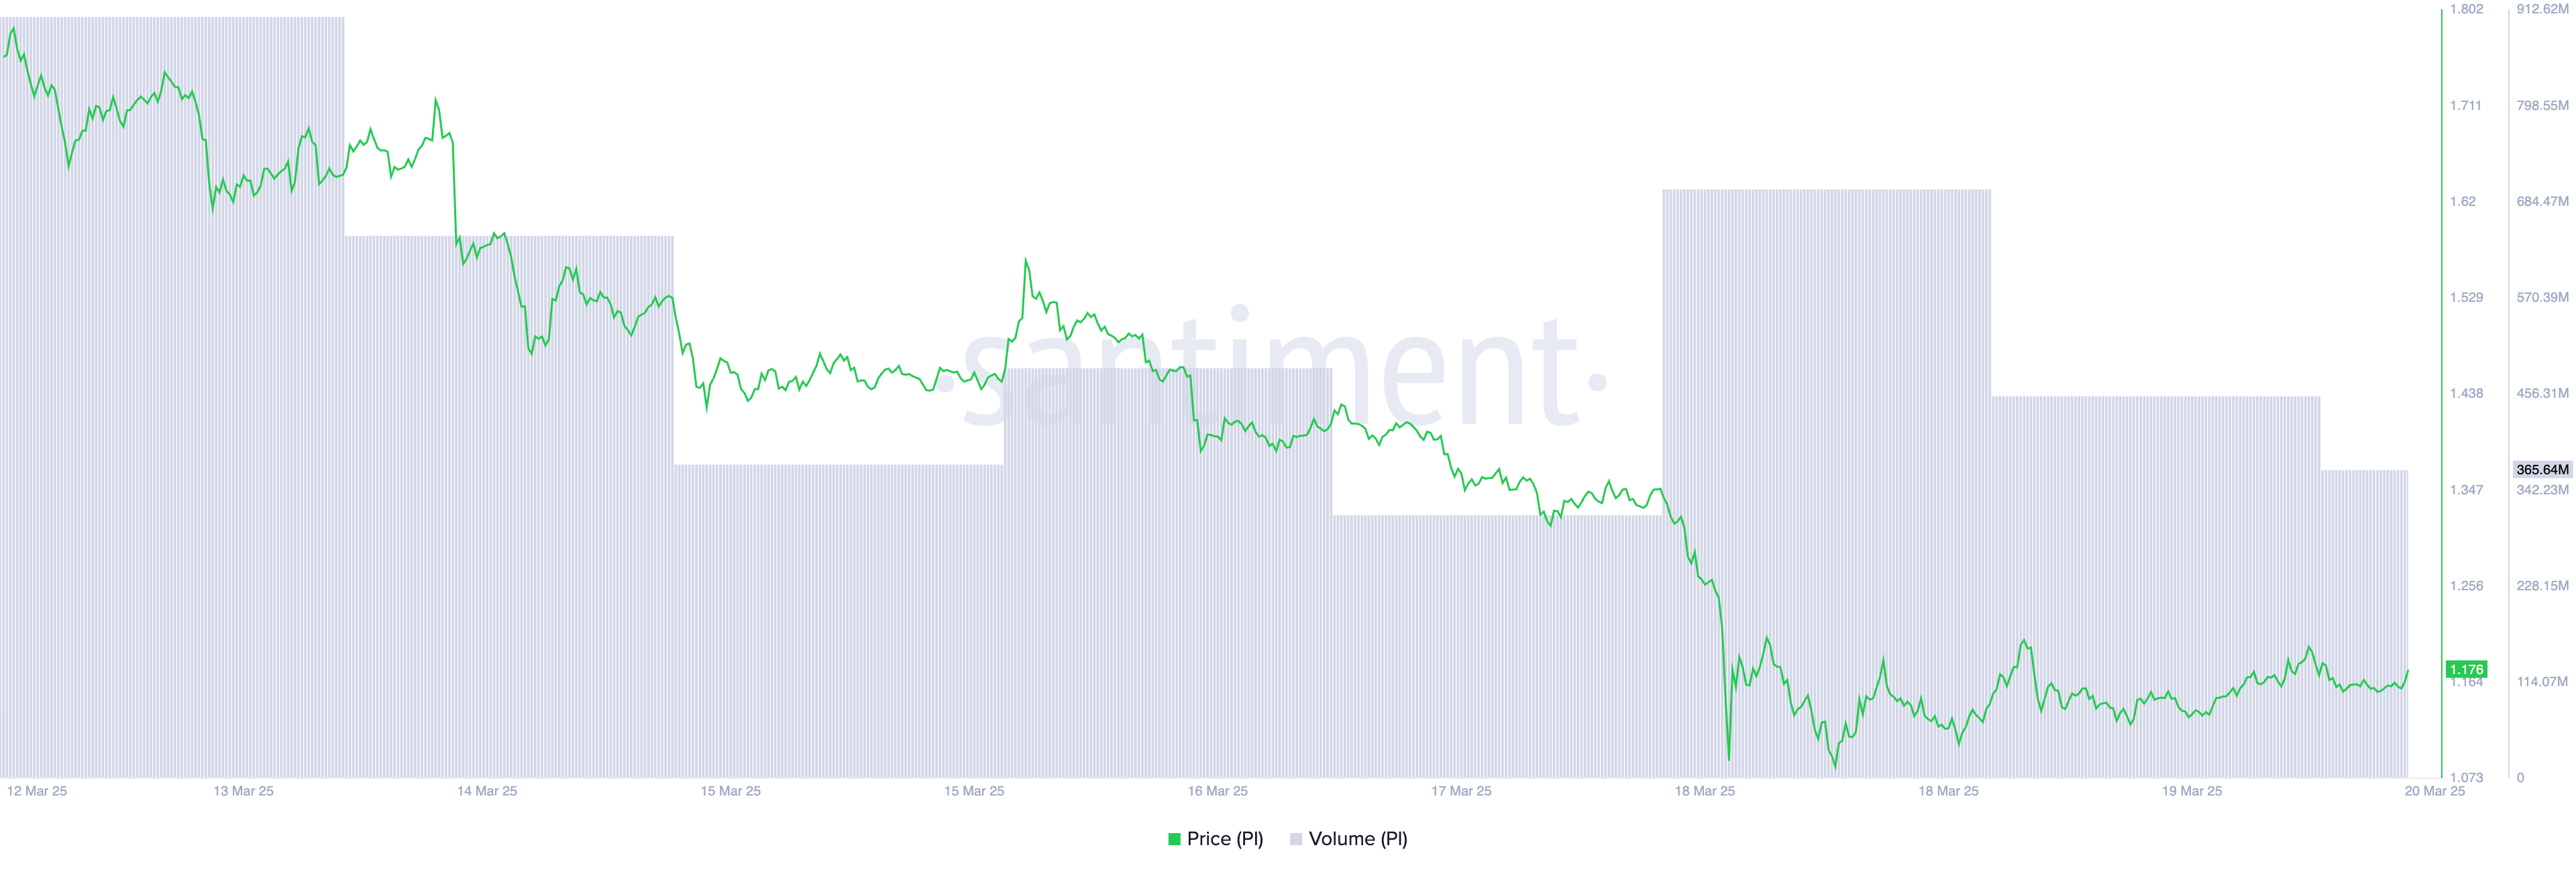
This indicates reduced market interest, as fewer PI traders are supporting the increase. If volume does not pick up, the token’s price may struggle to maintain its gains and could resume its decline.
Further reinforcing the negative outlook, PI’s BBTrend remains in the red, confirming that bearish forces are firmly in control. Observed on a four-hour chart, the momentum indicator is at -32.45, the lowest it has ever been since PI launched.
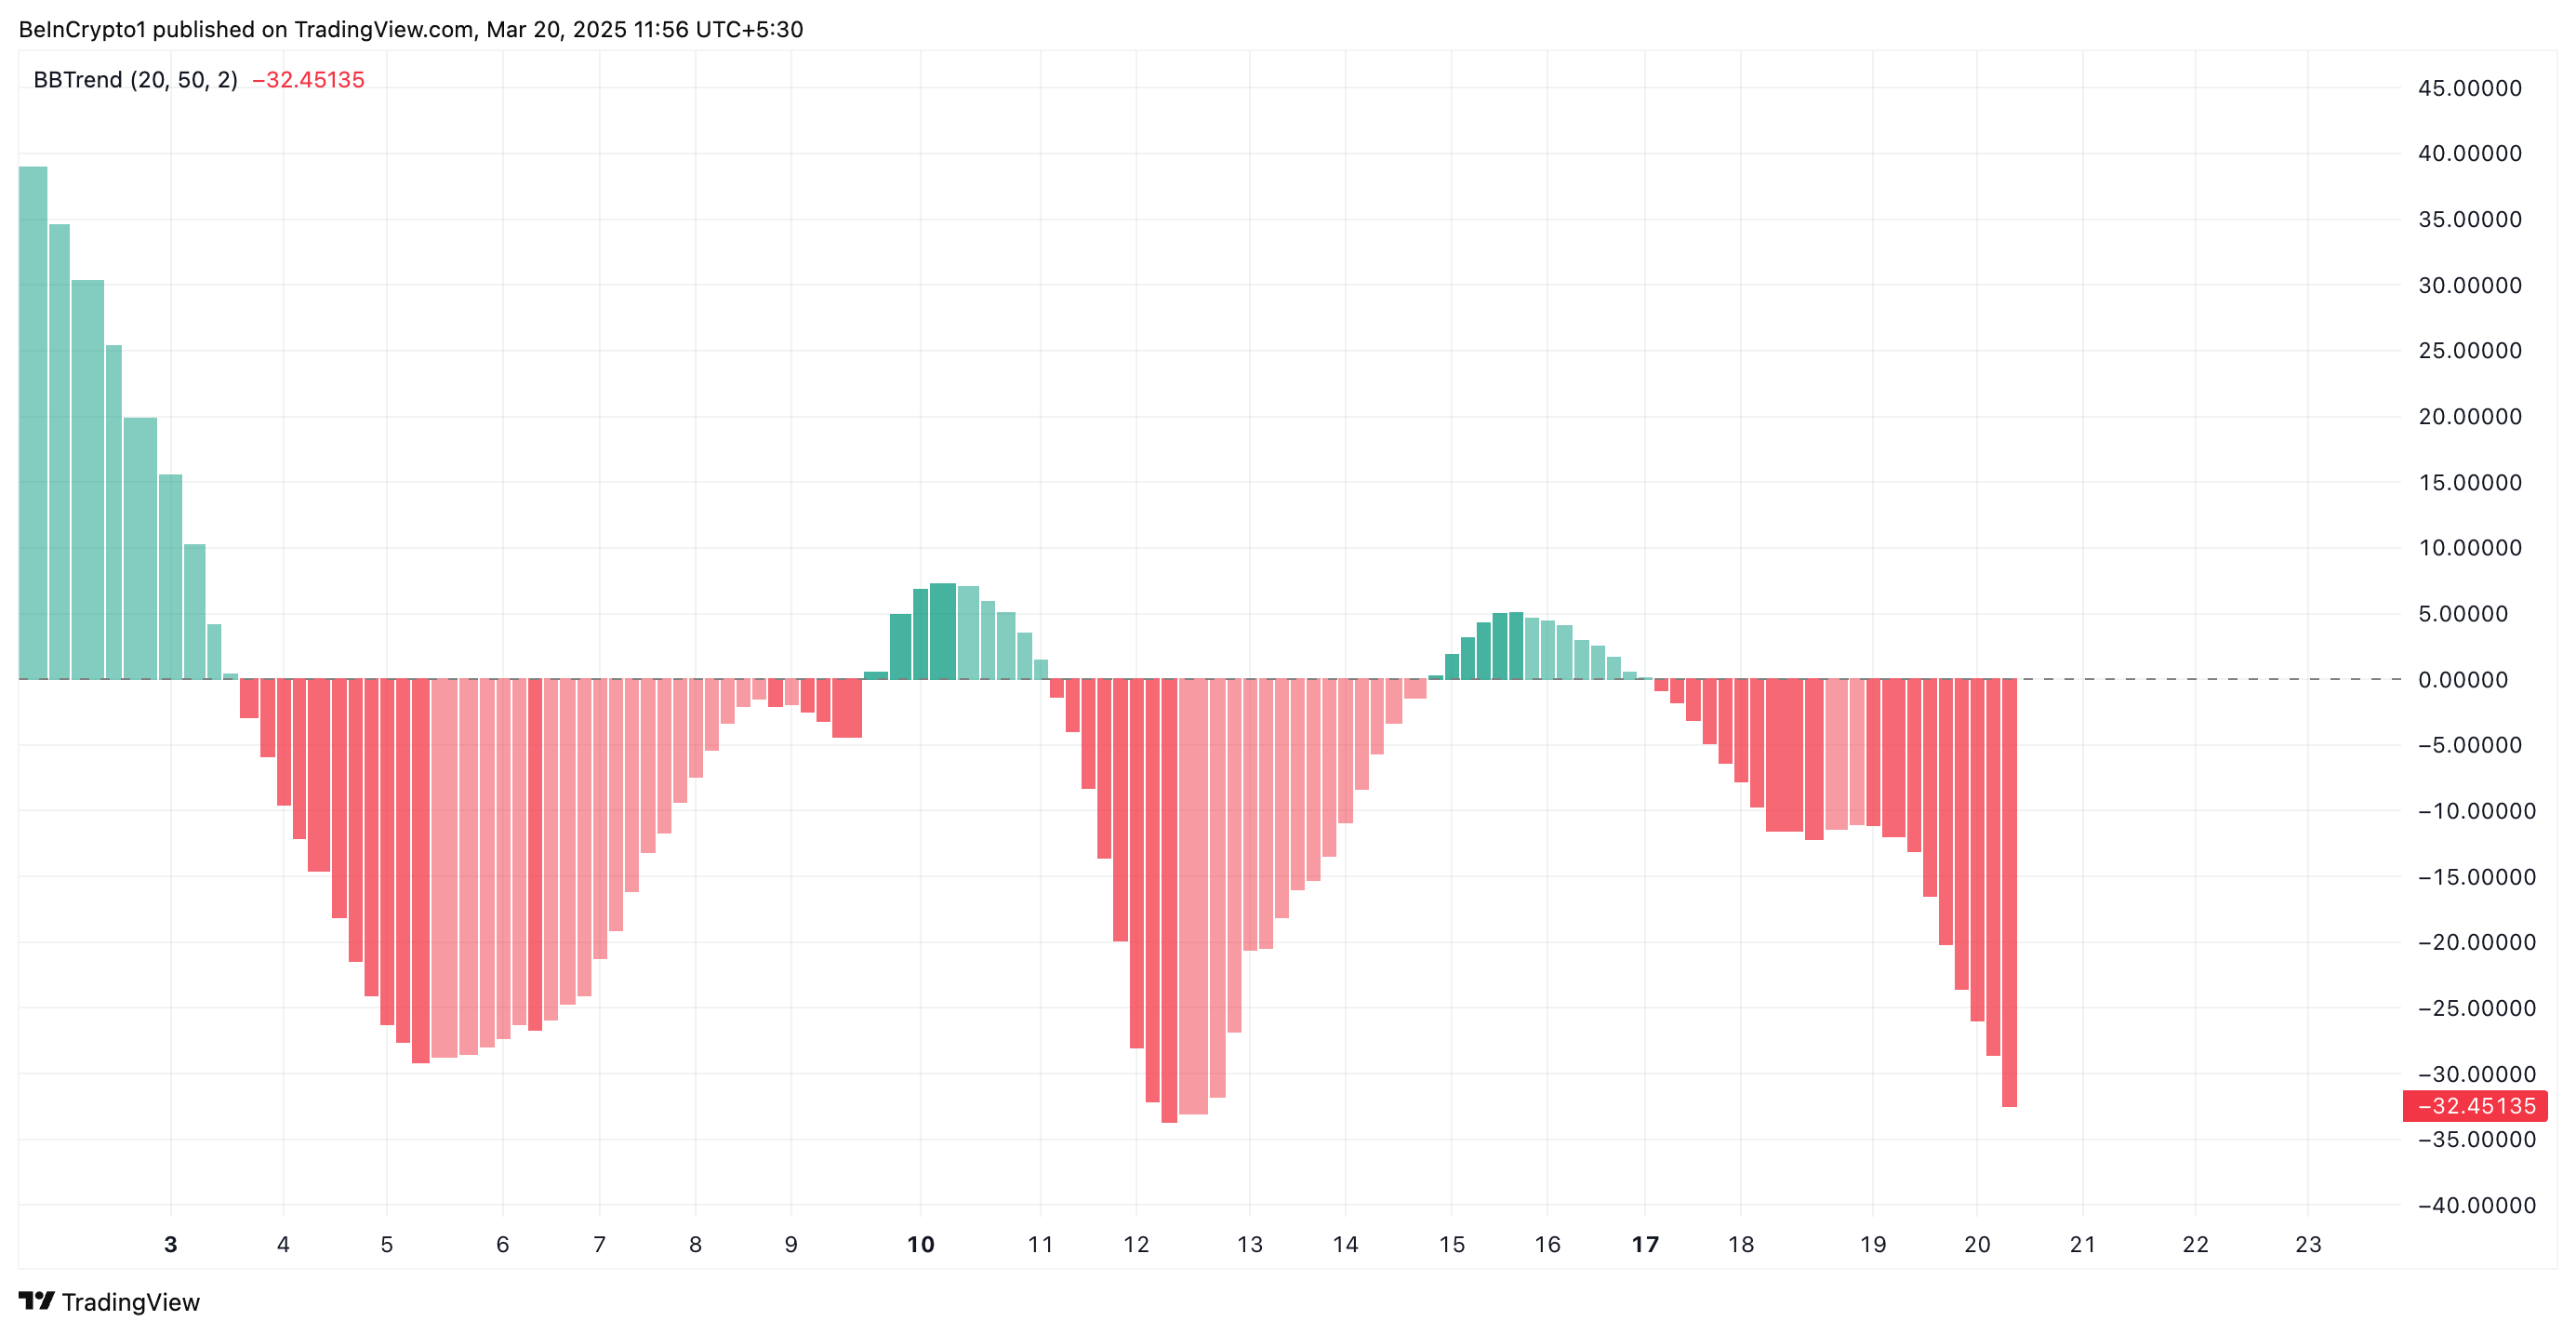
The BBTrend indicator measures the strength and direction of an asset’s price movement in relation to the Bollinger Bands. A positive BBTrend value signals an uptrend, indicating that prices are pushing toward the upper band with strong momentum.
Conversely, a negative BBTrend value indicates a downtrend, suggesting that the asset is trading closer to the lower band, with bearish pressure prevailing.
When an asset’s BBTrend is deep in negative territory like PI’s, it indicates a strong and persistent downtrend, with sellers firmly in control. This suggests that PI’s price declines are not just short-term corrections but part of a broader bearish trend accompanied by significant volatility.
PI Holds Critical $1.11 Support—Will Bulls Prevent a Drop to $0.87?
PI currently holds above the support formed at $1.11. If selloffs intensify, the bulls might be unable to defend this support floor, causing the token’s price to plummet to $0.87.
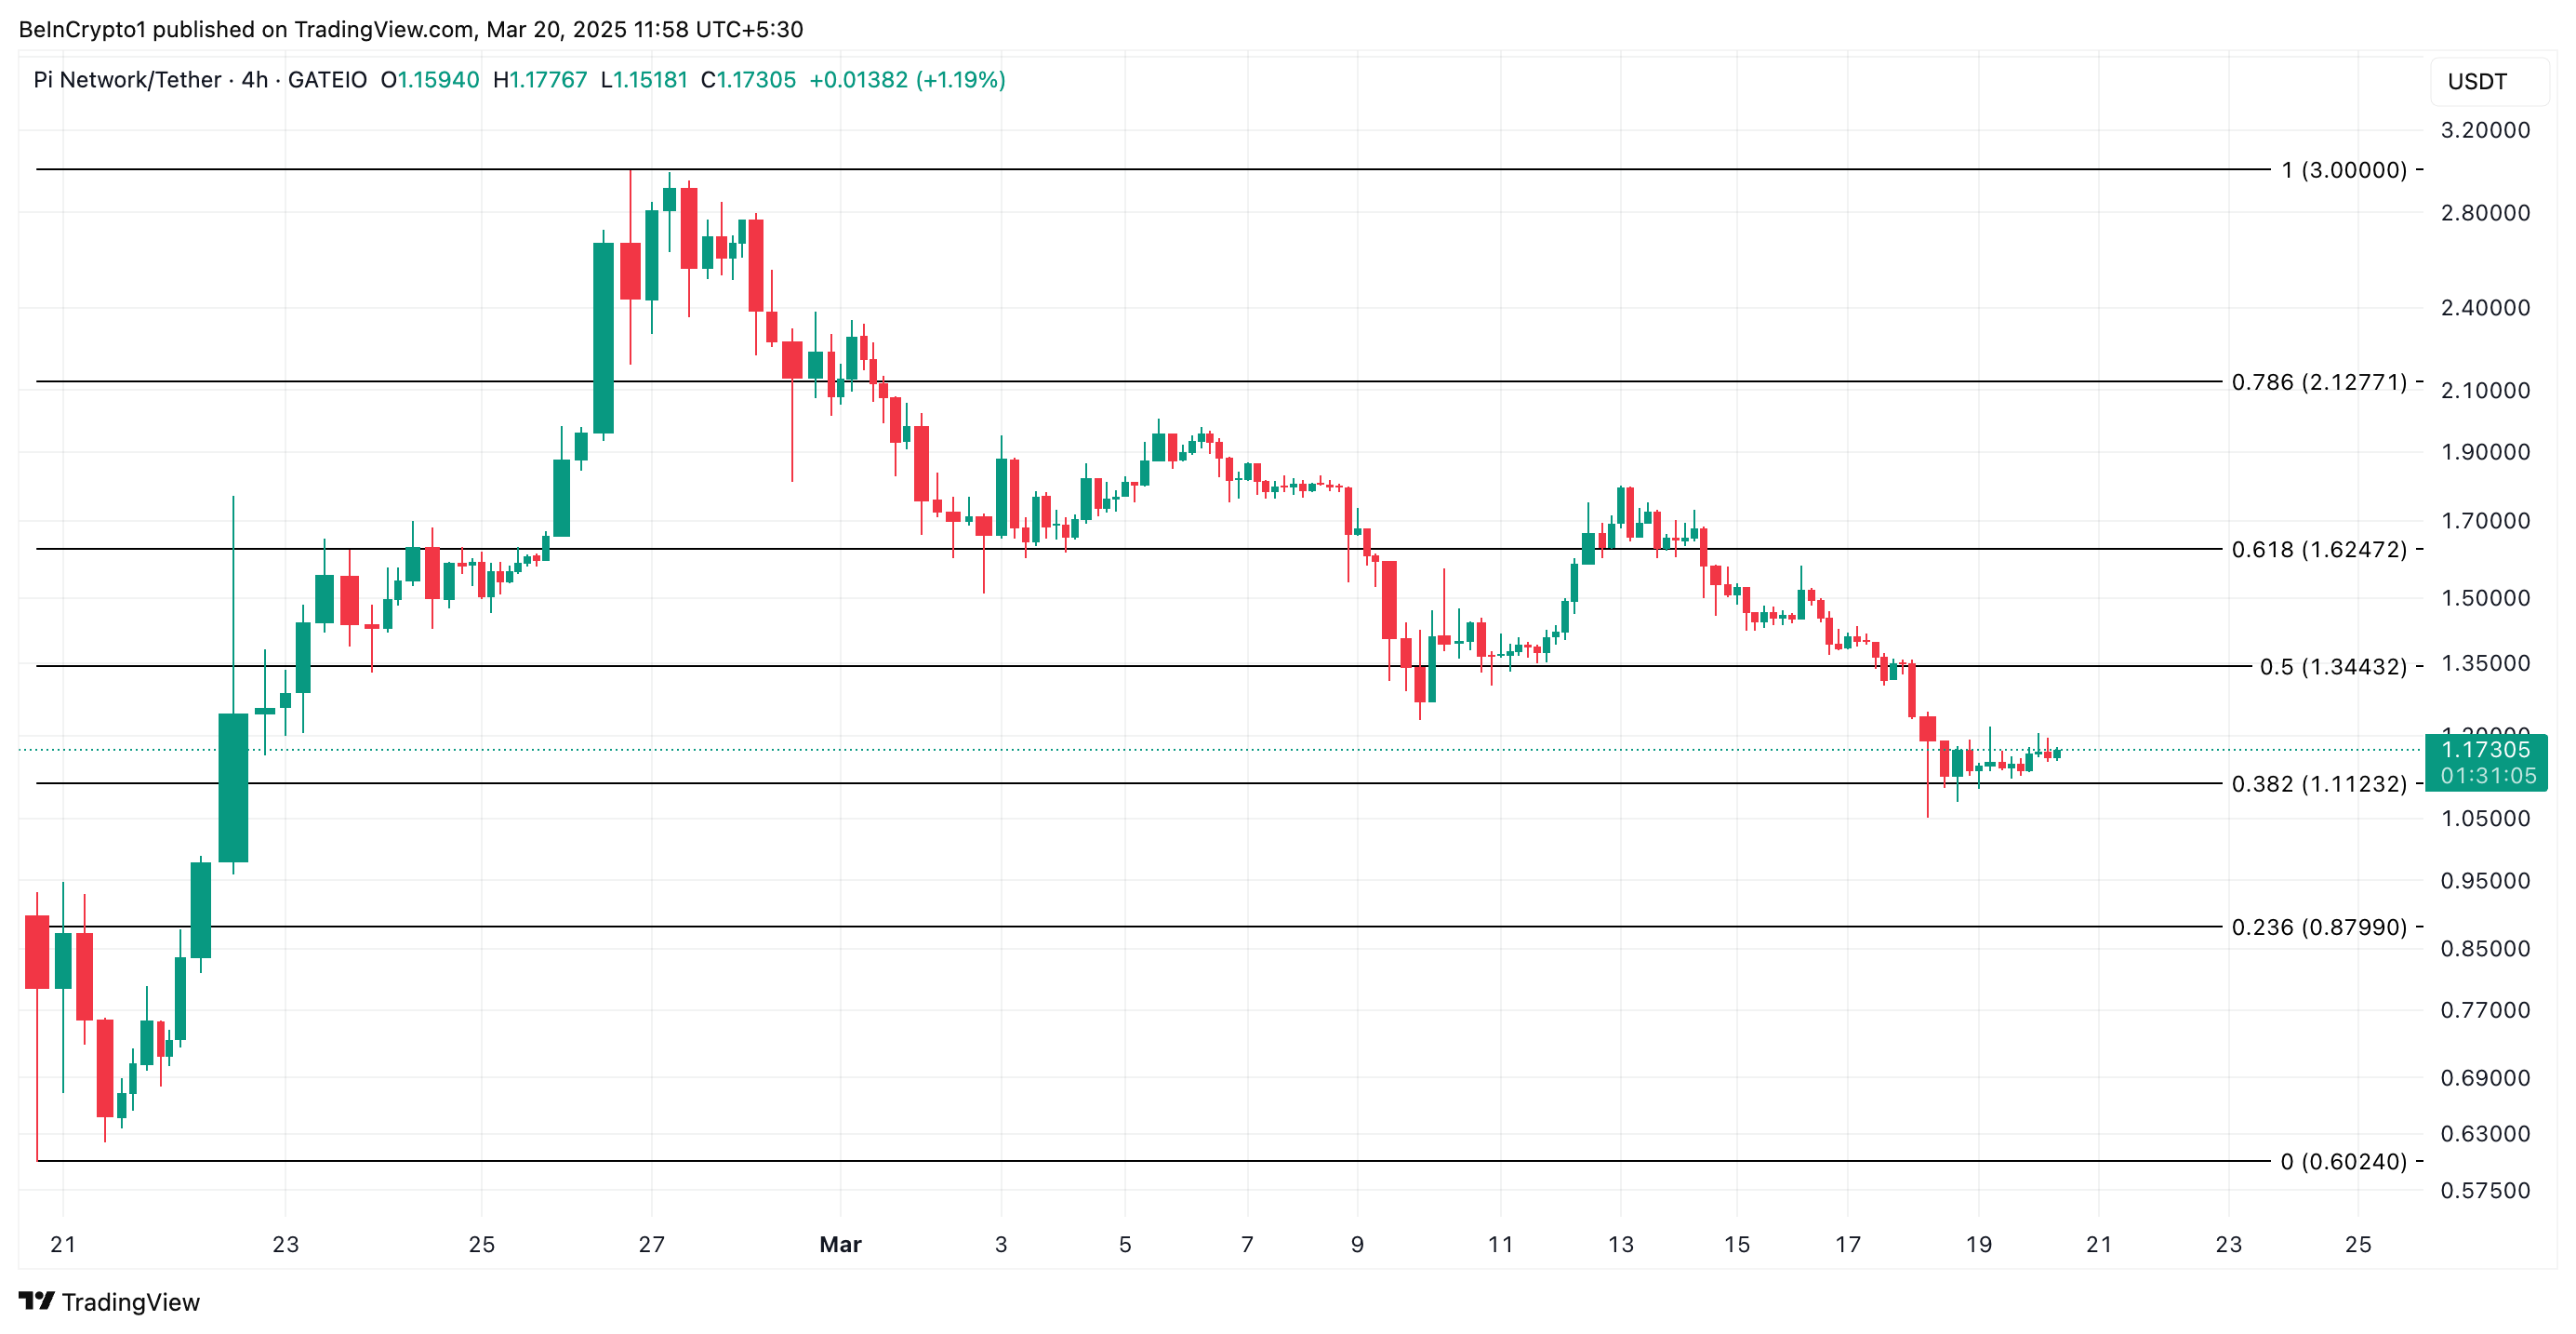
On the other hand, a positive shift in market sentiment and a resurgence in new demand for PI would invalidate this bullish projection. In that scenario, the token’s price could resume its rally and climb toward $1.34.
Disclaimer
In line with the Trust Project guidelines, this price analysis article is for informational purposes only and should not be considered financial or investment advice. BeInCrypto is committed to accurate, unbiased reporting, but market conditions are subject to change without notice. Always conduct your own research and consult with a professional before making any financial decisions. Please note that our Terms and Conditions, Privacy Policy, and Disclaimers have been updated.

The introduction of DEX integration features by centralized exchanges (CEX), transforming them into hybrid platforms, reflects a growing trend of blending centralization and decentralization to attract both traditional users and DeFi enthusiasts.
With increasing regulatory pressure on CEX, like KYC and AML requirements, decentralized exchanges (DEX) have become a more appealing option due to their anonymity and decentralized nature. Integrating DEX functionalities allows CEX to retain users while still complying with regulations.
CEX-DEX Integration for Growth
CEX and DEX represent the two primary exchange models in the crypto market. The boundaries between the two types of exchanges are increasingly blurred in today’s evolving market. Both models are beginning to adopt and integrate each other’s strengths to meet users’ growing and diverse demands.
Recently, several centralized exchanges have launched hybrid platforms. For example, Binance introduced Binance Alpha 2.0 (another updated version of Binance Alpha), enabling CEX users to purchase DEX tokens without withdrawals, combining CEX convenience with access to decentralized tokens.
Similarly, MEXC launched DEX+, blending on-chain and off-chain trading for a seamless experience. This reflects a trend of integrating centralization and decentralization to appeal to traditional users and DeFi participants.
“This is a brilliant move. Allowing CEX users to buy any DEX tokens directly from the CEX, no withdrawals needed.” said former Binance CEO CZ.
Interestingly, DEXs started gaining prominence in 2020. They slightly surpassed CEX in on-chain trading volume in 2020, and peaked in 2021. The rise of platforms like Solana contributed to this sudden growth. But DEXs slowly started losing momentum in 2022 and 2023.
According to a report by OAK Research, at the beginning of 2024, DEXs accounted for just 9.3% of the trading volume market share compared to CEXs. However, in January 2025, DEXs surpassed $320 billion in monthly trading volume as they captured over 20% of the spot trading volume for the first time in crypto history.
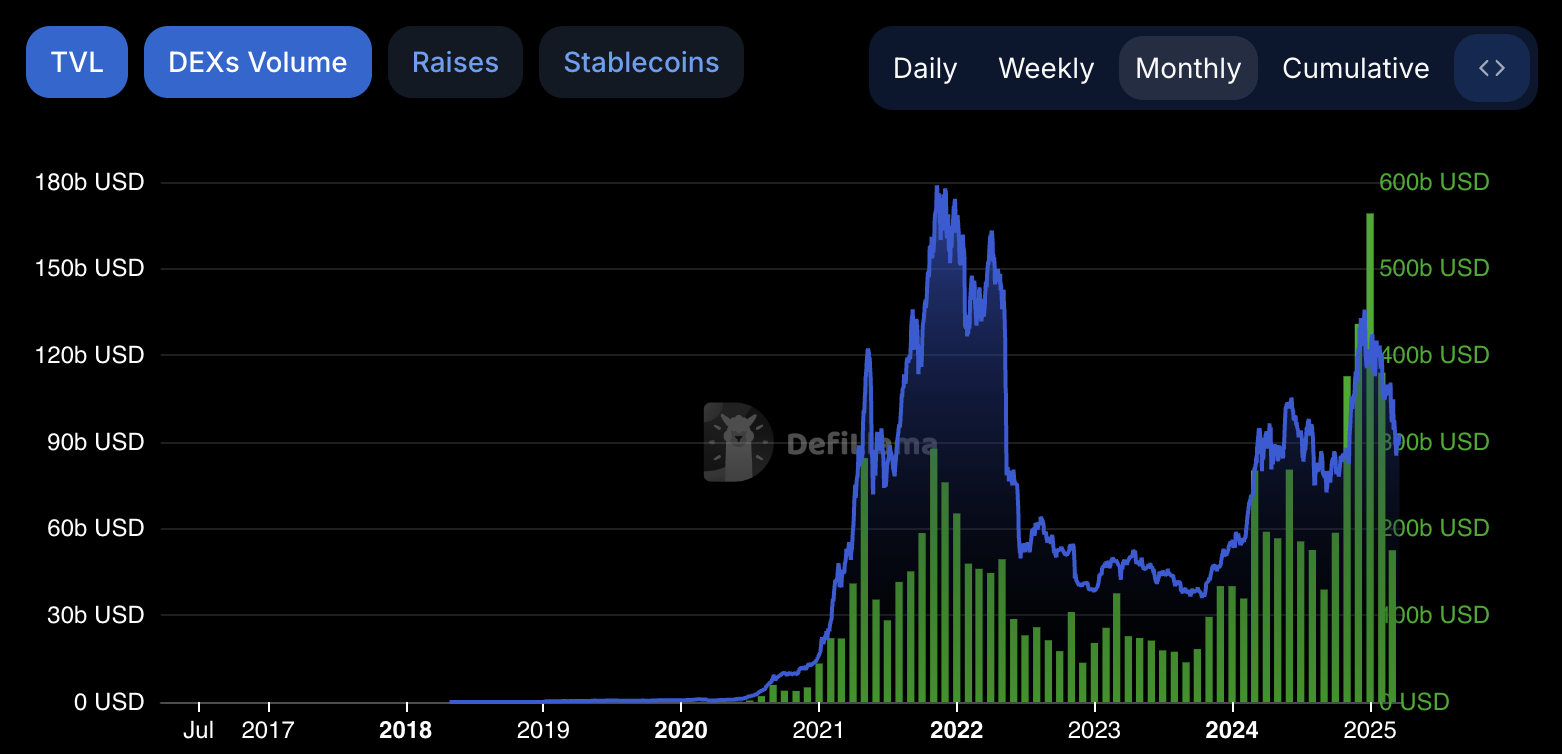
Similaryly, according to data from DeFiLlama, Total Value Locked (TVL) in DEX was approximately $163.6 billion at the beginning of 2022. In 2023, the TVL dropped to around $52 billion and stayed around the same figure for most of 2024.
Nevertheless, by December 2024, this figure had surged to around $140 billion, marking an increase of nearly 160% since the beginning of the year. This shows the rising preference for DEXs among crypto traders.
According to CoinGecko, around 959 DEX platforms are now active in 2025, compared to 217 CEXs.
Benefits and Challenges of CEX-DEX Integration
The current differences between CEX and DEX creates disadvantages for users. As a result, users seek to combine the strengths of both models: the speed and liquidity of CEX with the control and transparency of DEX. The launches of Binance Alpha 2.0 and MEXC DEX+ demonstrate how major exchanges are addressing this need.
Moroever, DEXs led innovation in the current cycle with AMMs and liquidity pools, forcing CEXs to adapt to avoid falling behind.
With mounting regulatory pressure on CEXs, the anonymity and decentralization of DEXs make it more attractive. DEX integration enables CEX to retain users while navigating compliance.
However, creating hybrid platforms comes with challenges. Integrating on-chain and off-chain systems requires complex infrastructure, potentially leading to errors or high gas fees for DEX users. Additionally, hybrid platforms may face stricter regulatory scrutiny, especially when combining CEX’s fiat-to-crypto trading with decentralized tokens.
Despite these hurdles, given the advantages outlined, hybrid platforms like Binance Alpha 2.0 and MEXC DEX+ will continue to emerge.
Disclaimer
In adherence to the Trust Project guidelines, BeInCrypto is committed to unbiased, transparent reporting. This news article aims to provide accurate, timely information. However, readers are advised to verify facts independently and consult with a professional before making any decisions based on this content. Please note that our Terms and Conditions, Privacy Policy, and Disclaimers have been updated.

The US Dollar Index (DXY) fell following the latest Federal Open Market Committee (FOMC) meeting. This turnout triggered discussions about its implications for Bitcoin (BTC) and broader liquidity conditions.
Meanwhile, Bitcoin price reclaimed the $85,000 range. However, prospects for more gains remain debatable as the pioneer crypto continues in a horizontal chop.
Fed Revises Economic Projections Amid Growth Concerns
Market analysts and crypto experts suggest the declining dollar could create a more favorable environment for Bitcoin’s price recovery. This optimism comes despite lingering macroeconomic concerns.
On one hand, President Donald Trump is putting political pressure on the Federal Reserve (Fed), urging it to cut rates.
“The Fed would be MUCH better off CUTTING RATES as US Tariffs start to transition (ease!) their way into the economy. Do the right thing,” Trump wrote on Truth Social.
These remarks indicate potential political battles over monetary policy, further affecting risk asset performance.
However, the FOMC rejected further interest rate cuts, and the Fed made significant downward revisions to its 2025 economic projections. This painted a picture of weaker growth and persistent inflation.
The Fed cut its GDP growth forecast from 2.1% to 1.7% while raising its unemployment projection to 4.4%. Inflation expectations also increased, with PCE inflation forecasted at 2.7% and core PCE inflation at 2.8%. Notably, both of these were higher than previous estimates.
These revisions suggest a more challenging economic environment, with the DXY dropping in the aftermath.
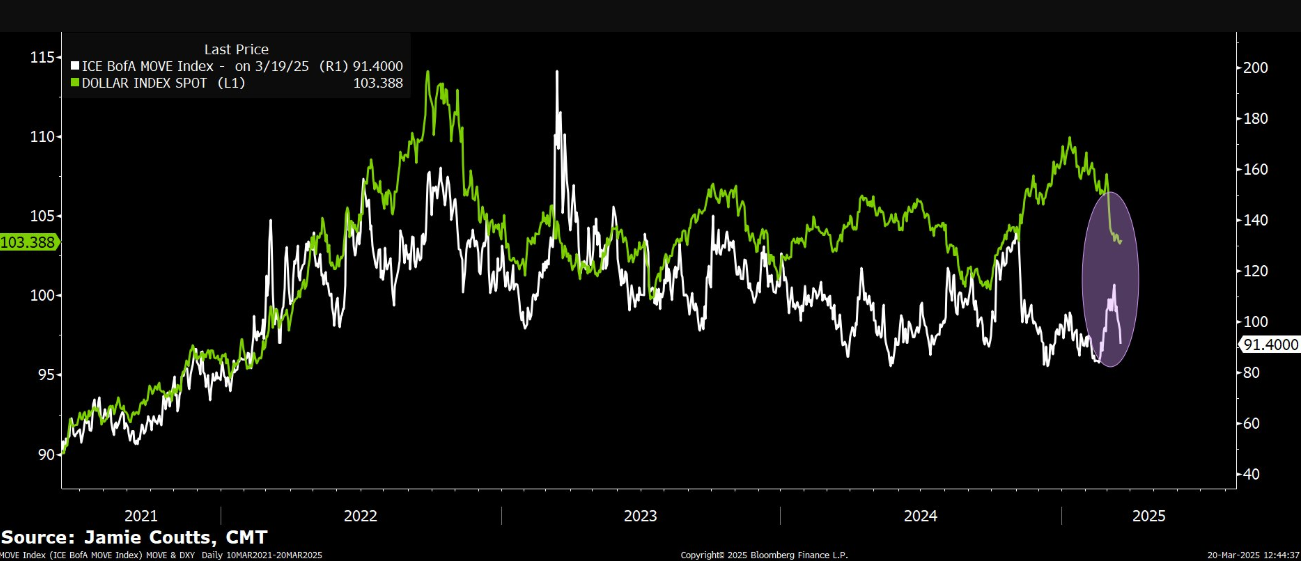
Real Vision’s chief crypto analyst, Jamie Coutts, who also built the crypto research product at Bloomberg Intelligence, commented on the turnout. In a post on X (Twitter), the analyst argued that quantitative tightening (QT) is effectively dead for the near future.
Coutts points to the decline in Treasury yield volatility and its correlation with the DXY downturn. He says these are key indicators of increased liquidity, which is generally bullish for Bitcoin.
“After last night, QT is effectively dead (for some time). Treasury volatility has backed right off and is now mirroring the decline in DXY from earlier this month. This is all extremely liquidity-positive,” Coutts noted.
However, not everyone agrees on the extent of QT’s slowdown. Analyst Benjamin Cowen cautions that QT is still ongoing, albeit at a reduced pace.
“QT is not ‘basically over’ on April 1st. They still have $35 billion per month coming off from mortgage-backed securities. They just slowed QT from $60 billion per month to $40 billion per month,” Cowen wrote.
Bitcoin and the Dollar: A Delayed Reaction?
One of the most compelling arguments for Bitcoin’s potential recovery comes from VanEck’s Head of Digital Assets Research, Mathew Sigel. He points out that Bitcoin has historically tracked an inverted DXY on a 10-week lag. This suggests that the current downturn in BTC prices could be a delayed reaction to the strong dollar in late 2024.
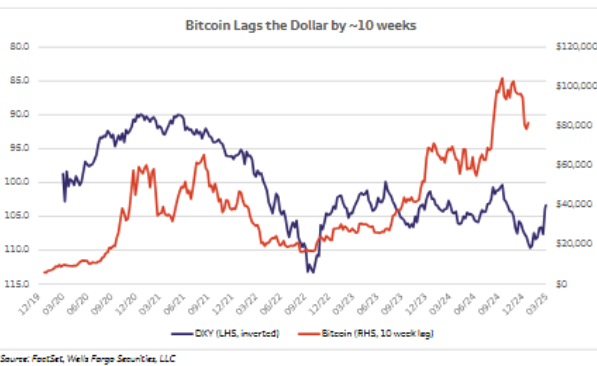
If the pattern holds, the recent weakness in DXY could set the stage for a bullish phase in Bitcoin over the coming months.
Meanwhile, BitMEX co-founder Arthur Hayes is more cautious about Bitcoin’s trajectory. While he acknowledges that QT is slowing, he questions whether liquidity injections in the European Union—driven by military spending—could overshadow the US’s financial shifts.
“Will the re-arming of the EU paid for with printed EUR overwhelm the near-term negative fiscal impulse of the US? That’s the big macro question. If yes, correction over. If no, hold on to your butts,” Hayes wrote.
Hayes also speculated that Bitcoin’s recent drop to $77,000 might have marked the bottom. However, he warned that traditional markets might face further downside, which could influence crypto in the short term.
Based on these, the post-FOMC environment presents a mixed outlook for Bitcoin. On the one hand, falling DXY, lower Treasury yield volatility, and slowing QT point to increasing liquidity, a historically positive signal for BTC.
On the other hand, macroeconomic risks—including rising corporate bond spreads and potential instability in traditional markets—could still create headwinds.
With Bitcoin’s historical lag behind DXY movements, the coming weeks will reveal if a delayed rally materializes. Meanwhile, global liquidity conditions and political developments remain key factors that could influence Bitcoin’s next major move.
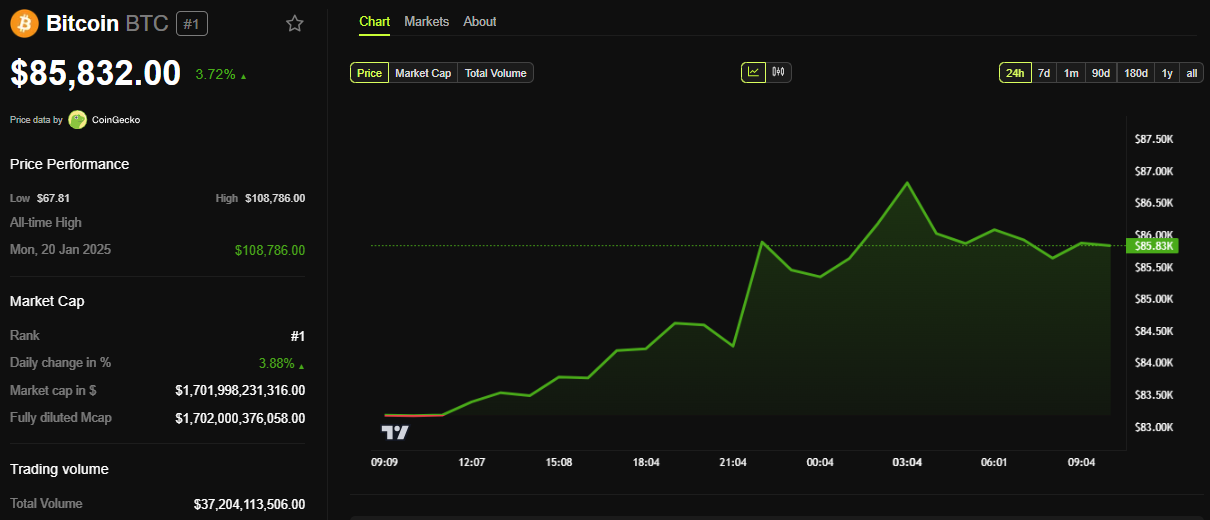
BeInCrypto data shows BTC was trading for $85,832 at press time. This represents a modest gain of almost 4% in the last 24 hours.
Disclaimer
In adherence to the Trust Project guidelines, BeInCrypto is committed to unbiased, transparent reporting. This news article aims to provide accurate, timely information. However, readers are advised to verify facts independently and consult with a professional before making any decisions based on this content. Please note that our Terms and Conditions, Privacy Policy, and Disclaimers have been updated.

32% Loss in a Week Amid Heavy Sell-Offs
Analyst Explains Why It Had to Happen

How CEXs Are Blending with DEXs

Will Bitcoin Benefit from DXY Decline After FOMC’s Latest Move?

Why Is Solana Price Up 6% Today?

NinjaTrader Could Become Part of Kraken in $1.5 Billion Deal

2.52 Million Altcoins Are Ruining Crypto’s Future

Animoca Brands Valuation Tanks 75% In Two Years, Here’s Why

Crypto exchange BingX hacked for $43 million

Are The Big Players Losing Interest?

Hong Kong’s Securities Association Tips Authorities On Crypto Self-Regulation

Coinbase cbBTC Set to go Live on Solana
2.52 Million Altcoins Are Ruining Crypto’s Future
Animoca Brands Valuation Tanks 75% In Two Years, Here’s Why
Crypto exchange BingX hacked for $43 million
Are The Big Players Losing Interest?
Hong Kong’s Securities Association Tips Authorities On Crypto Self-Regulation
Coinbase cbBTC Set to go Live on Solana
-

 Bitcoin22 hours ago
Is Strategy’s Bitcoin Gamble About to Backfire?
-

 Market22 hours ago
HBAR Price’s Recovery Set To Be Invalidated By Death Cross
-

 Ethereum23 hours ago
Is This A Bullish Signal?
-

 Market23 hours ago
AI Coins Lose Steam Despite Nvidia’s Blackwell Ultra Debut
-
 Regulation22 hours ago
US SEC Drops Ripple Lawsuit
-

 Market21 hours ago
Massive Outflows Spark 15% Drop in Pi Network Price
-

 Market18 hours ago
Russian Crypto Exchange Garantex Is Back Under a New Name
-

 Regulation18 hours ago
Ripple CLO Reveals What Next With Cross Appeal Against SEC