
Market
Solana Death Cross Forms, Pointing to Potential Breakdown

A week ago, a death cross appeared on Solana’s (SOL) one-day chart, signaling a growing bearish momentum.
While the coin’s price has since consolidated within a range, rising selling pressure suggests a potential breakdown in the near term.
Solana’s Death Cross and Bearish Momentum Fuel Fears
BeInCrypto’s assessment of the SOL/USD one-day chart reveals that a death cross emerged seven days ago. This is a bearish pattern formed when an asset’s short-term moving average (the 50-day) crosses below its long-term moving average ( the 200-day).
It confirms a shift from a bullish trend to a bearish one, indicating weakening momentum and increased downside risk. Since the pattern emerged, SOL’s price has traded within a narrow range. It has since oscillated between resistance formed at $136.92 and a support floor of $121.18.
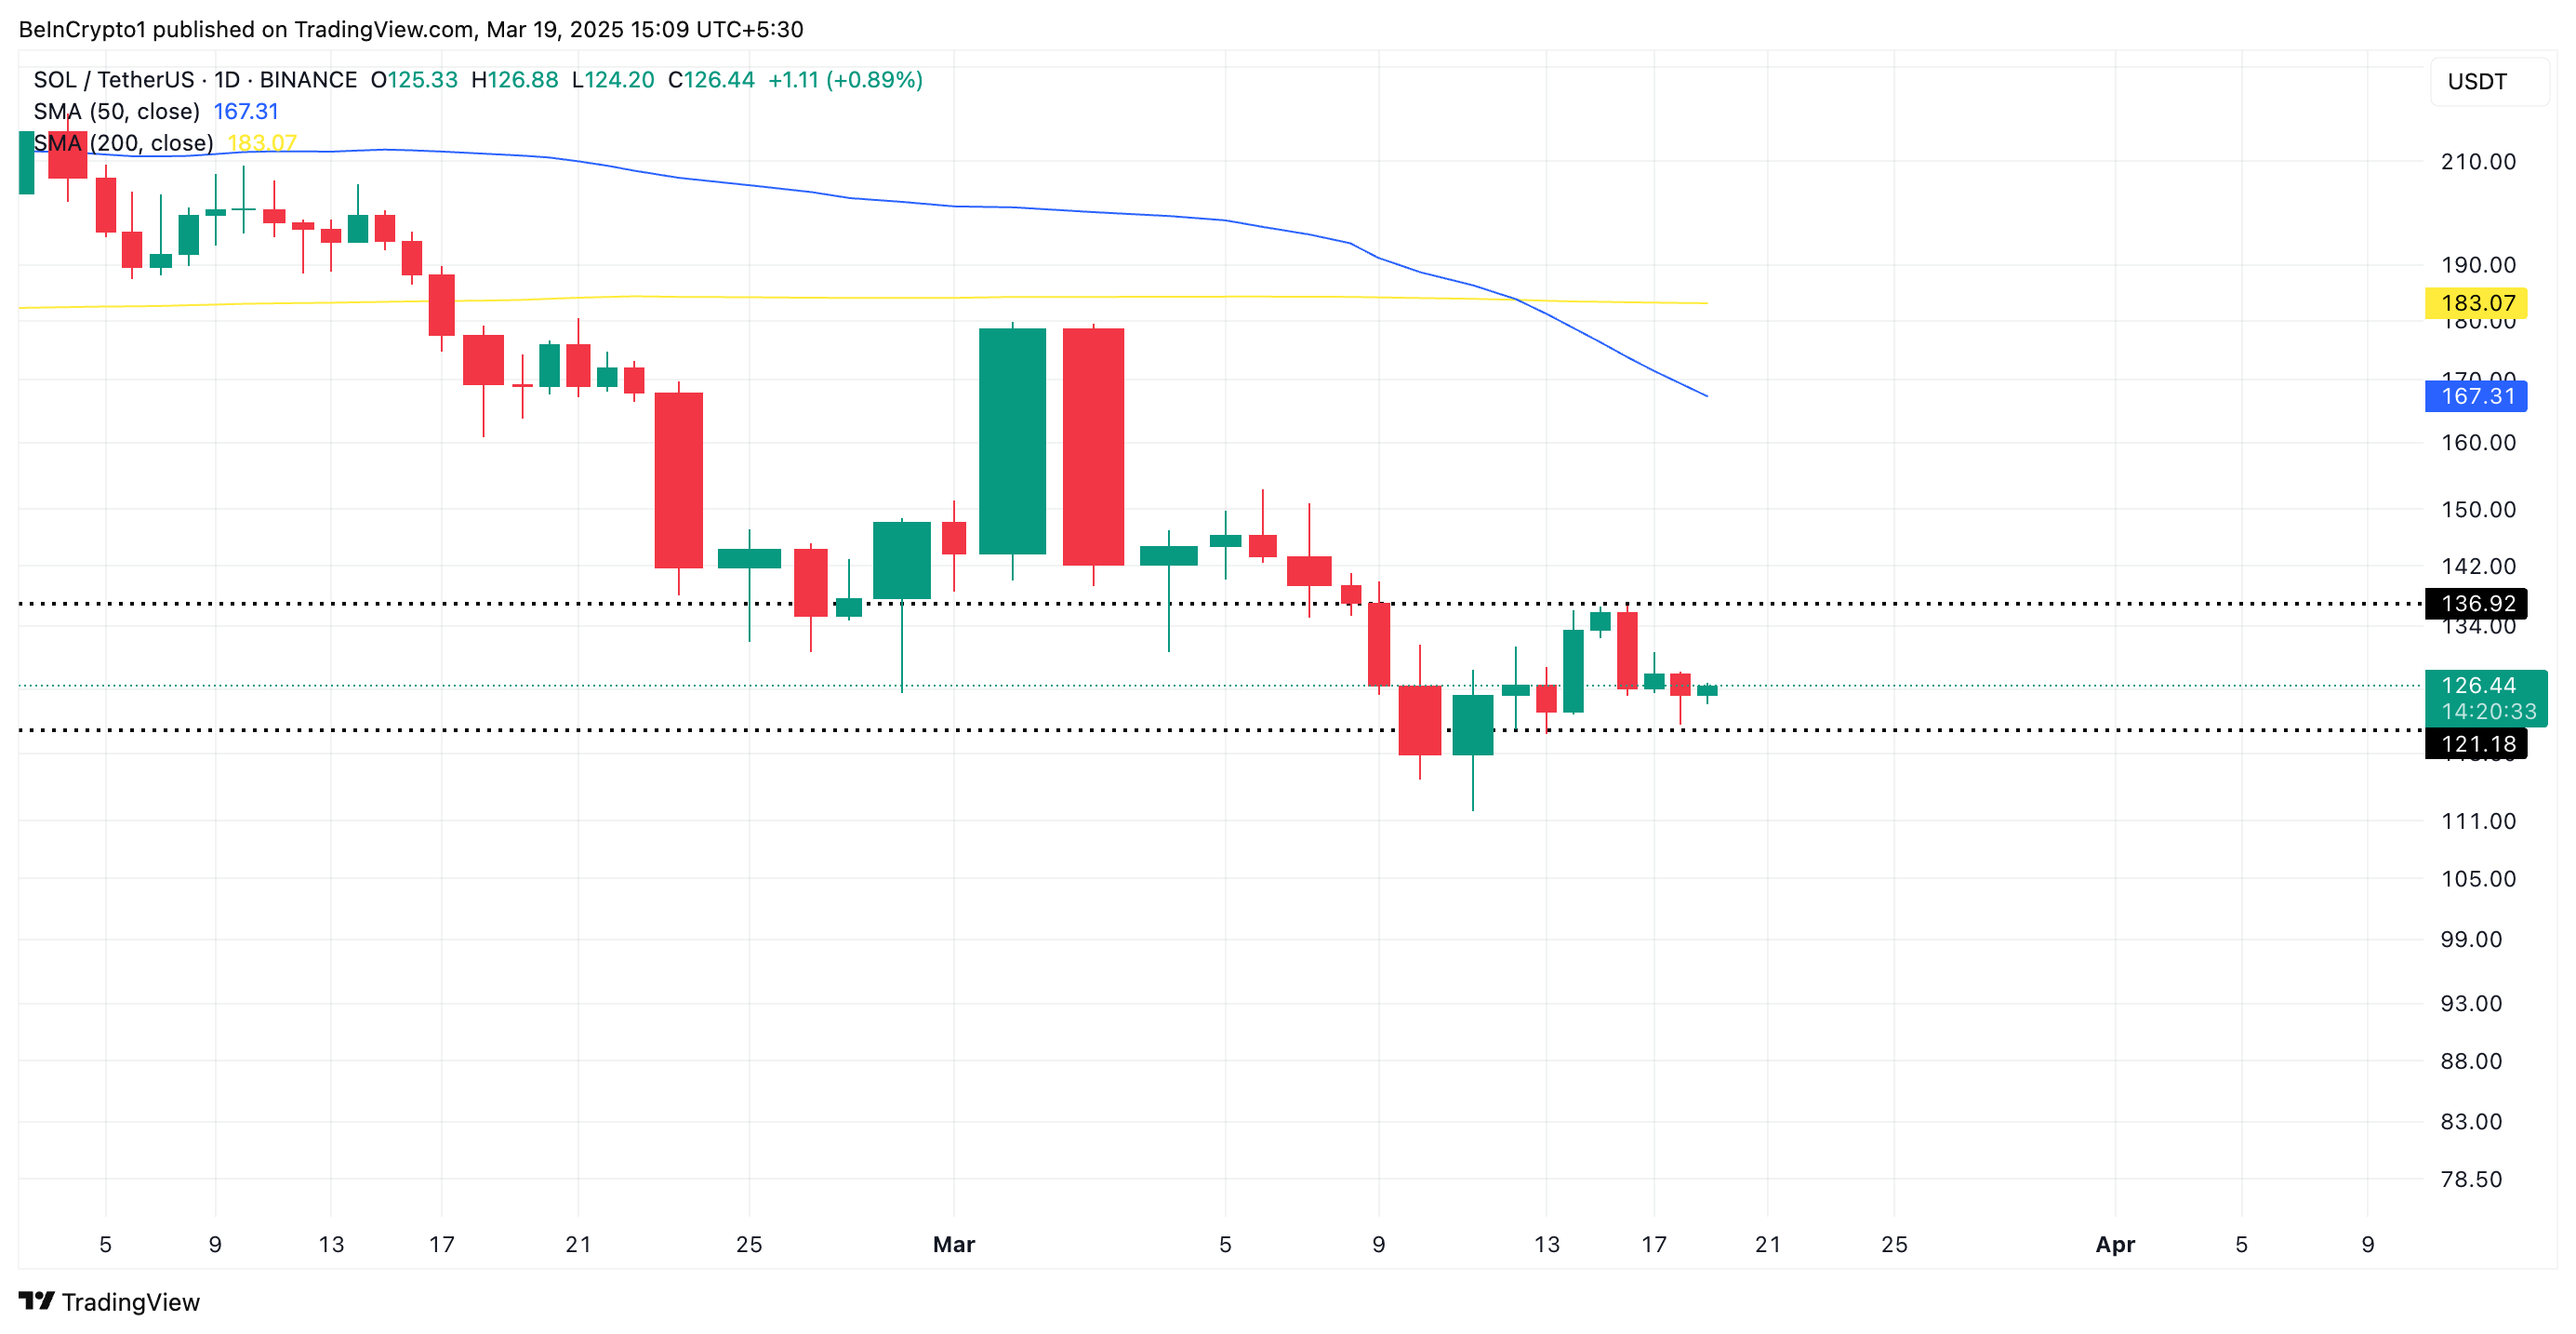
However, with selling pressure mounting, SOL appears poised for a breakdown below this support level. The widening gap between its 50-day and 200-day SMAs reinforces the likelihood of this happening in the near term.
Adding to this bearish outlook, SOL’s negative Elder-Ray Index indicates that sellers are gaining control. This indicator currently stands at -11.46 at press time.
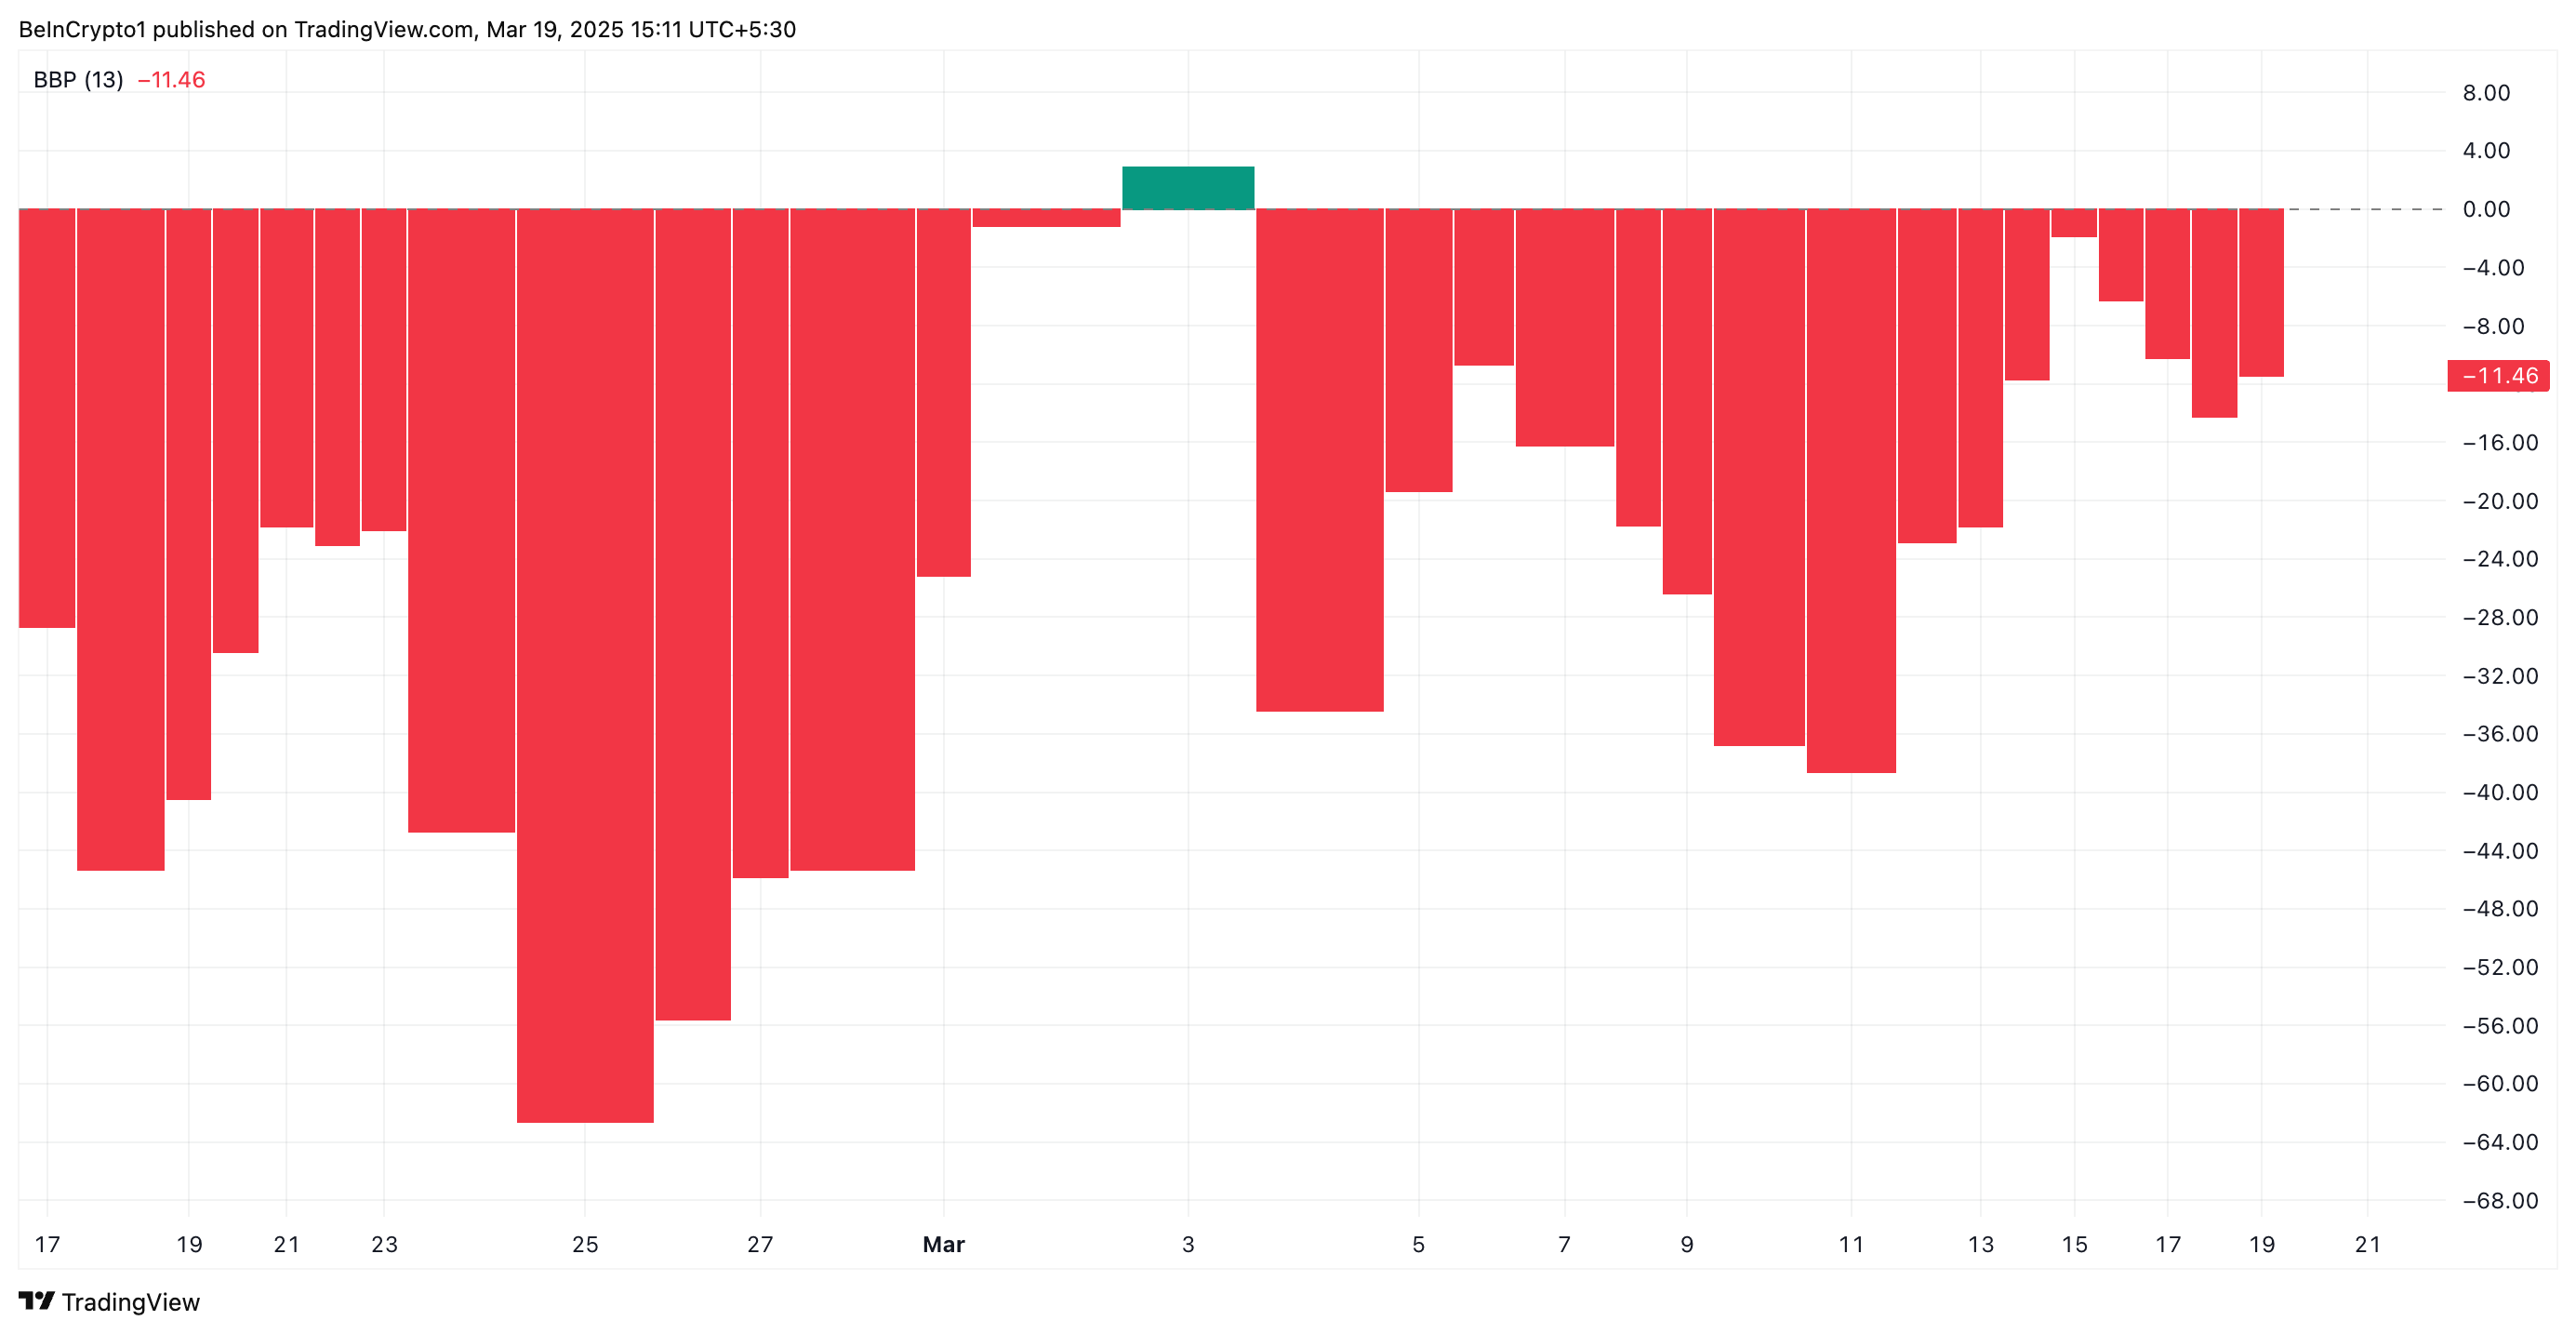
The Elder-Ray Index measures the strength of buyers (bull power) and sellers (bear power) by comparing an asset’s high and low prices to its exponential moving average (EMA). When the index is negative, it indicates that bear power is dominant.
This confirms the increased selling pressure among SOL traders and hints at the likelihood of a break below the support formed at $121.18.
SOL Bears Eye $110 as Selling Pressure Mounts—Will Support Hold?
SOL’s breakdown below the $121.18 support zone would exacerbate the downward pressure on its price. Such a breach would offer another confirmation of the bearish trend in the market and could cause the coin’s price to plummet toward $107.88.
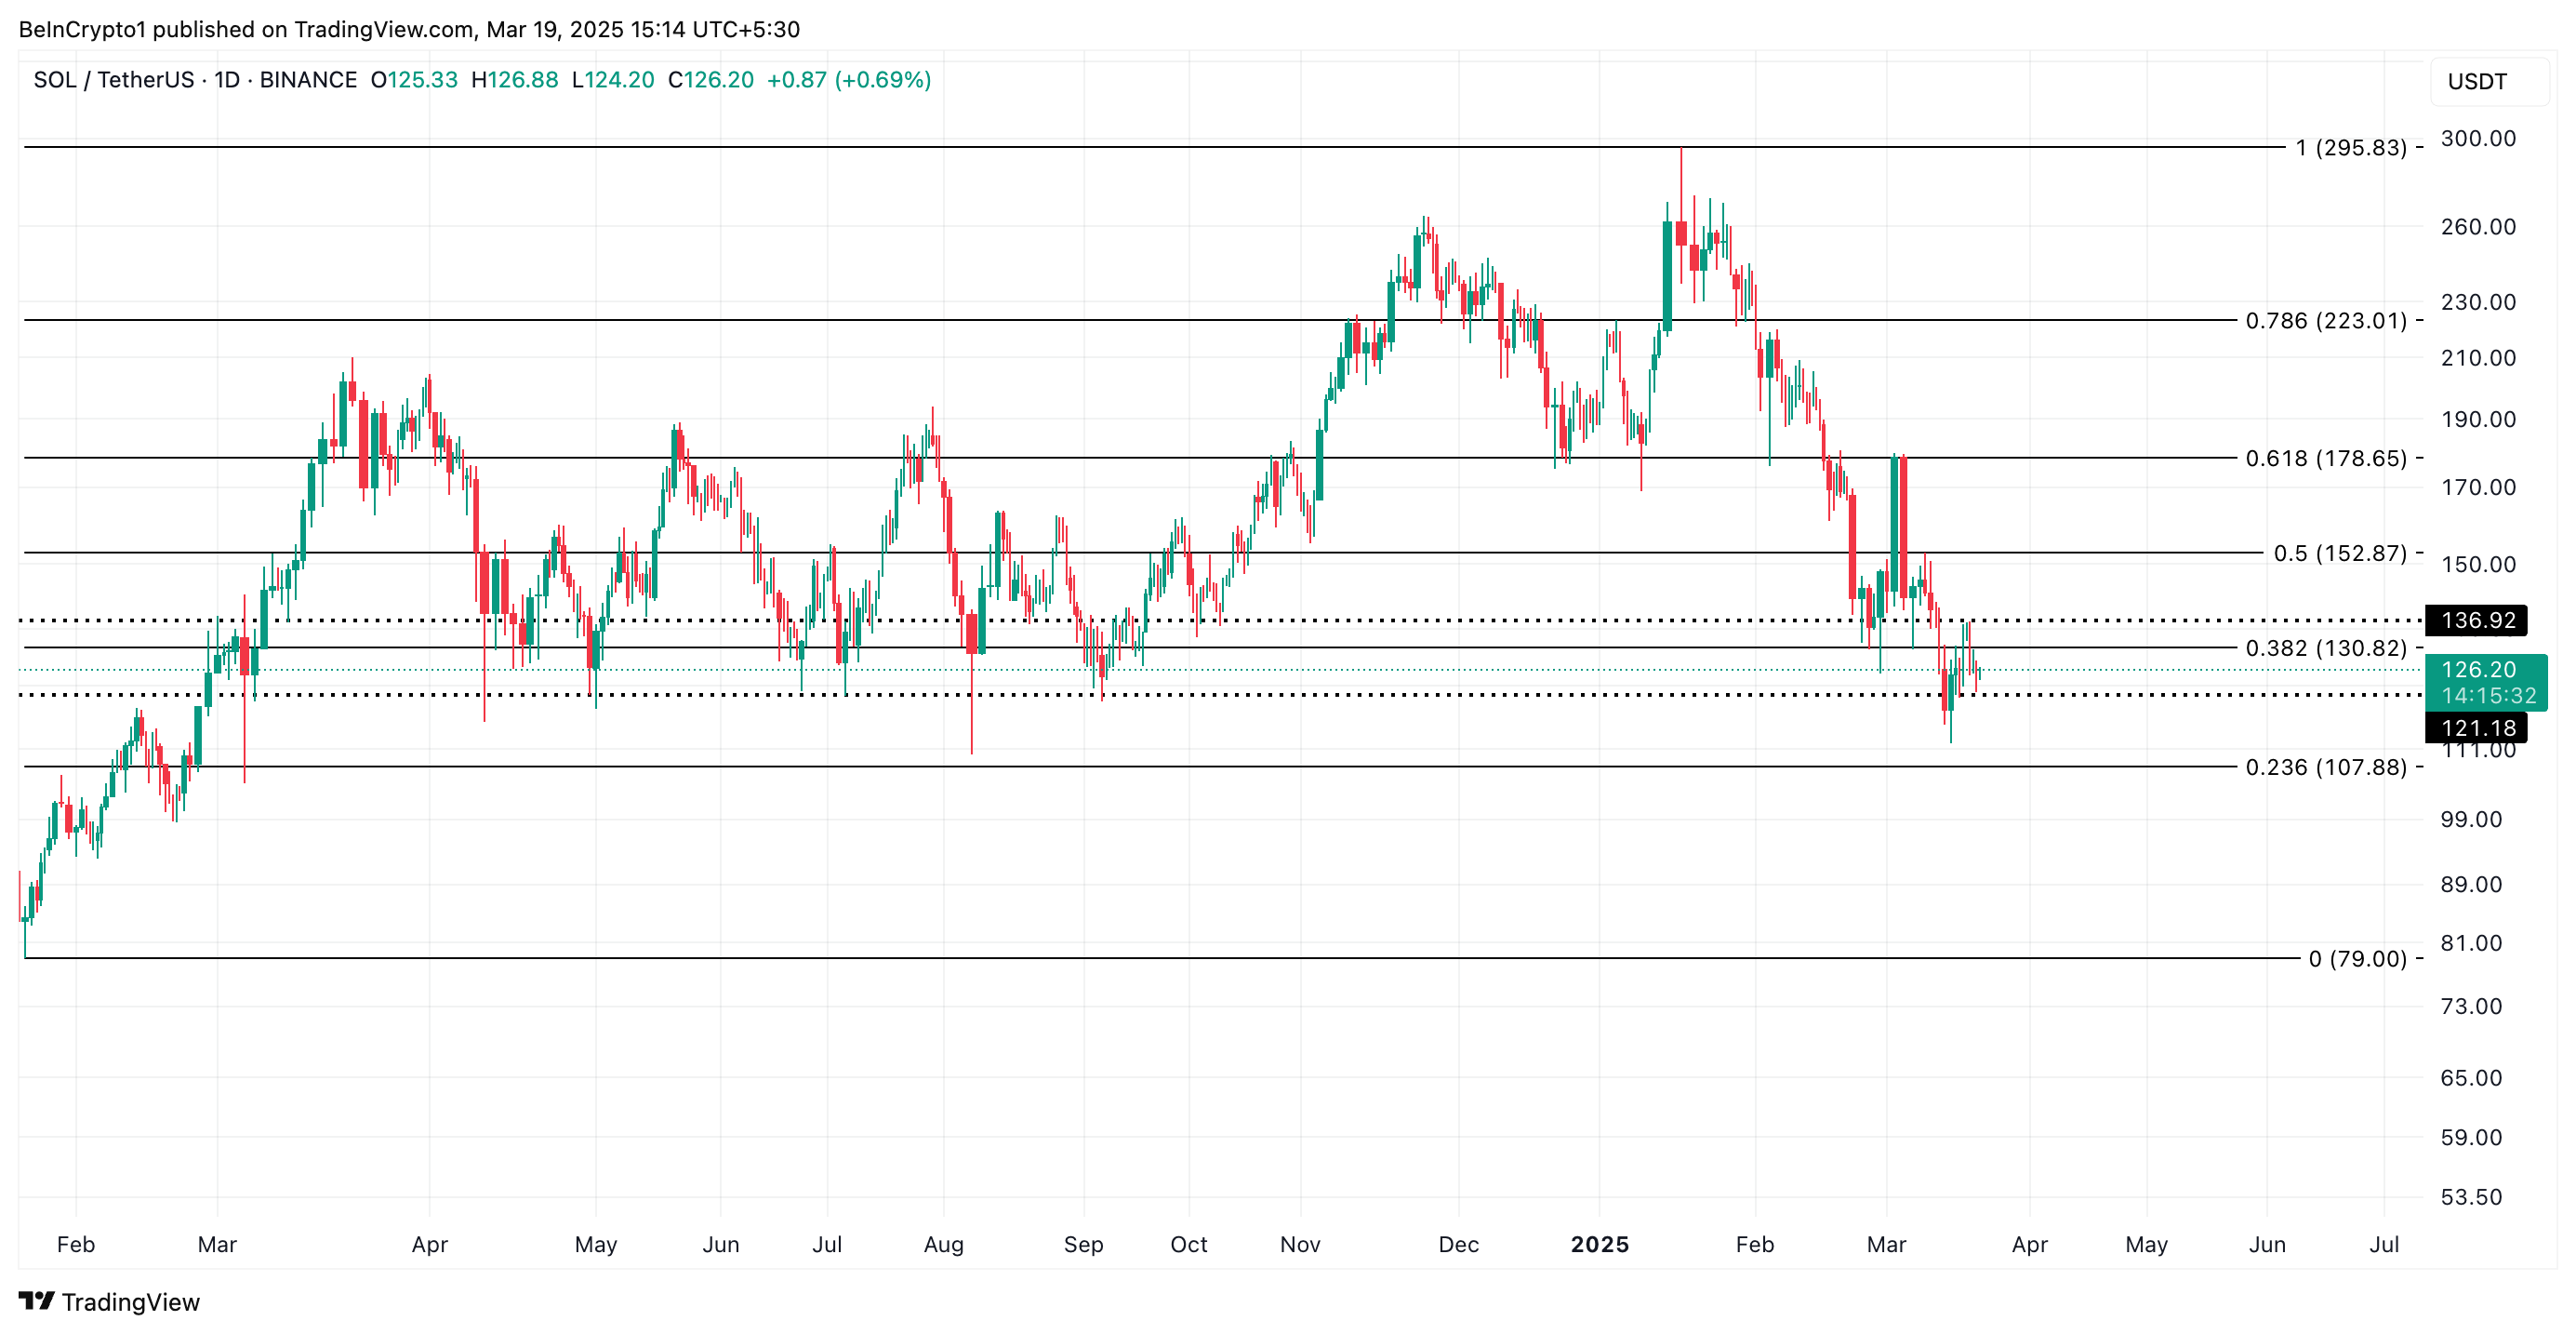
On the other hand, if market sentiment improves and SOL demand spikes, it could break above the resistance at $136.92 and soar to $152.87.
Disclaimer
In line with the Trust Project guidelines, this price analysis article is for informational purposes only and should not be considered financial or investment advice. BeInCrypto is committed to accurate, unbiased reporting, but market conditions are subject to change without notice. Always conduct your own research and consult with a professional before making any financial decisions. Please note that our Terms and Conditions, Privacy Policy, and Disclaimers have been updated.


XRP is rallying after the SEC officially dropped its lawsuit against Ripple, triggering a 13% price surge in the past 24 hours. Strong technical signals and growing market participation are supporting the bullish momentum.
XRP’s network activity is also hitting record levels, with active addresses soaring to new highs. As traders digest the legal victory and positive market signals, XRP’s outlook is strengthening, increasing the chances of further upside in the near term.
XRP DMI Shows Buyers Are In Full Control
XRP’s DMI chart reveals a notable shift in momentum, with its ADX (Average Directional Index) rising to 20.4 from 15.64 following the news that the SEC is dropping its lawsuit against Ripple.
This increase signals a strengthening market trend, as the ADX tracks the overall strength of a trend without specifying its direction.
The recent surge suggests that the price action is gaining conviction, especially as the market digests the positive legal developments surrounding Ripple.
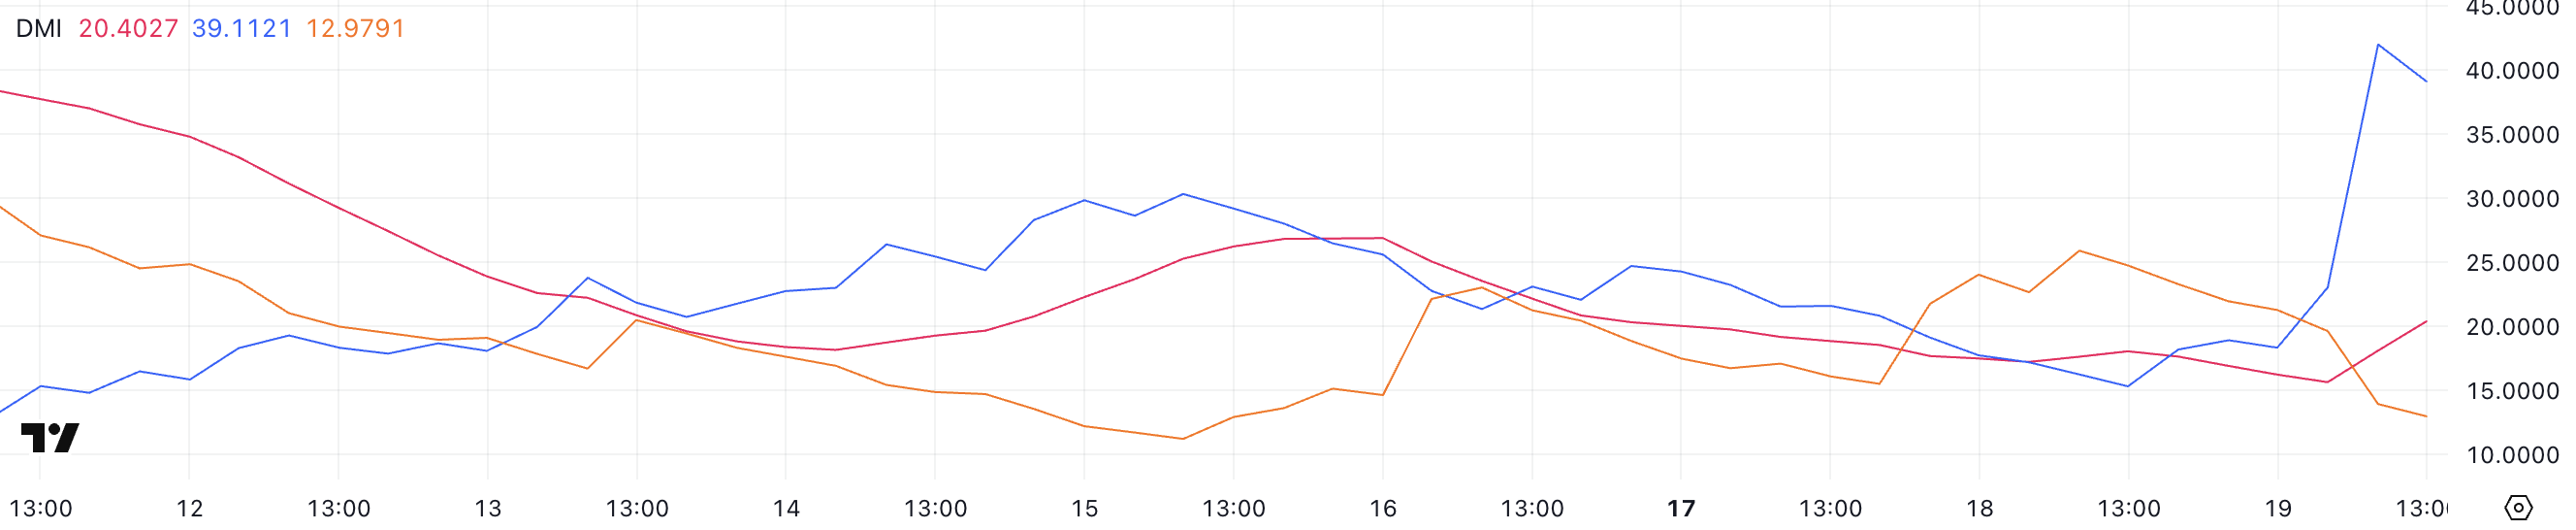
The ADX is often used alongside the +DI and -DI indicators, which help identify trend direction. Typically, an ADX above 25 confirms a strong trend, while values below 20 suggest a weak or range-bound market.
In XRP’s case, the +DI has jumped from 18.3 to 39, while the -DI has dropped from 19.63 to 12.97, indicating a clear bullish divergence.
This sharp rise in buying strength (+DI) combined with a weakening bearish signal (-DI) supports the idea that XRP is attempting to maintain and possibly extend its uptrend. If this dynamic continues, it could see further upside in the short term as bullish momentum builds.
XRP Active Addresses Are Reaching New Records
XRP’s network activity has been surging, with the number of 7-day Active Addresses reaching an all-time high of 1.19 million. This is a massive increase from the 237,000 recorded on February 27, marking an almost fivefold rise in just a few weeks.
The spike in active addresses signals that XRP’s blockchain is seeing heightened participation, whether from retail traders, institutional players, or speculative interest.
Such elevated levels of activity are rarely seen and could indicate growing attention and usage of the network.
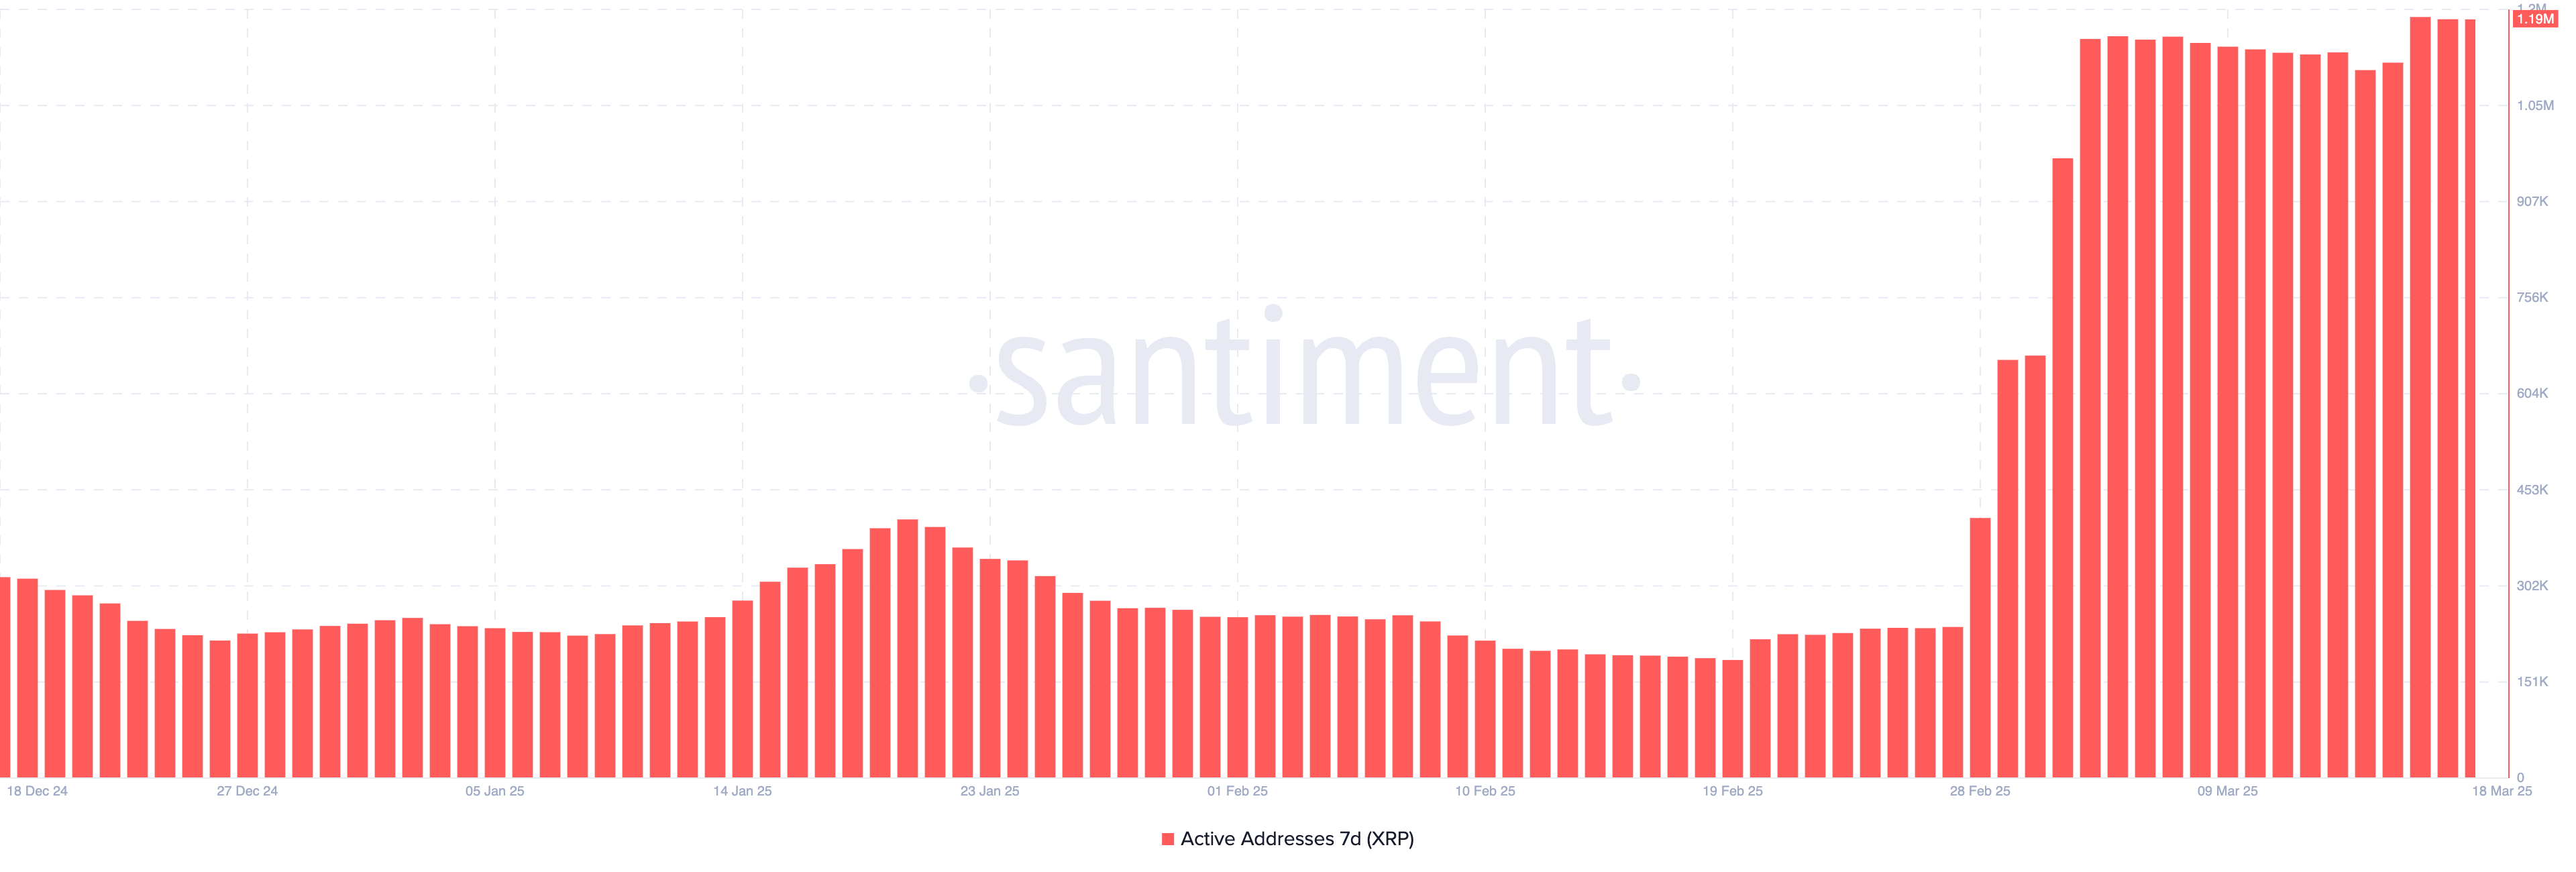
Tracking the number of active addresses is crucial as it offers insight into the level of user engagement and real demand on the blockchain.
Generally, an increase in active addresses can suggest that more participants are transacting or interacting with the network, which often correlates with stronger liquidity and potentially higher price volatility. In XRP’s case, this record-breaking surge in activity could act as a bullish signal, hinting at growing interest and possibly renewed capital inflows.
While it doesn’t guarantee immediate price appreciation, such strong network participation could help support XRP’s price and reduce downside risk, especially if coupled with other bullish technical or fundamental factors.
Can XRP Reach $3 Soon?
Its EMA lines are currently pointing to a potential new golden cross forming soon.
Should this scenario unfold, XRP price may first challenge the resistance at $2.648. If buying momentum strengthens further, the price might push toward $2.99, potentially breaking above the barrier at $3.
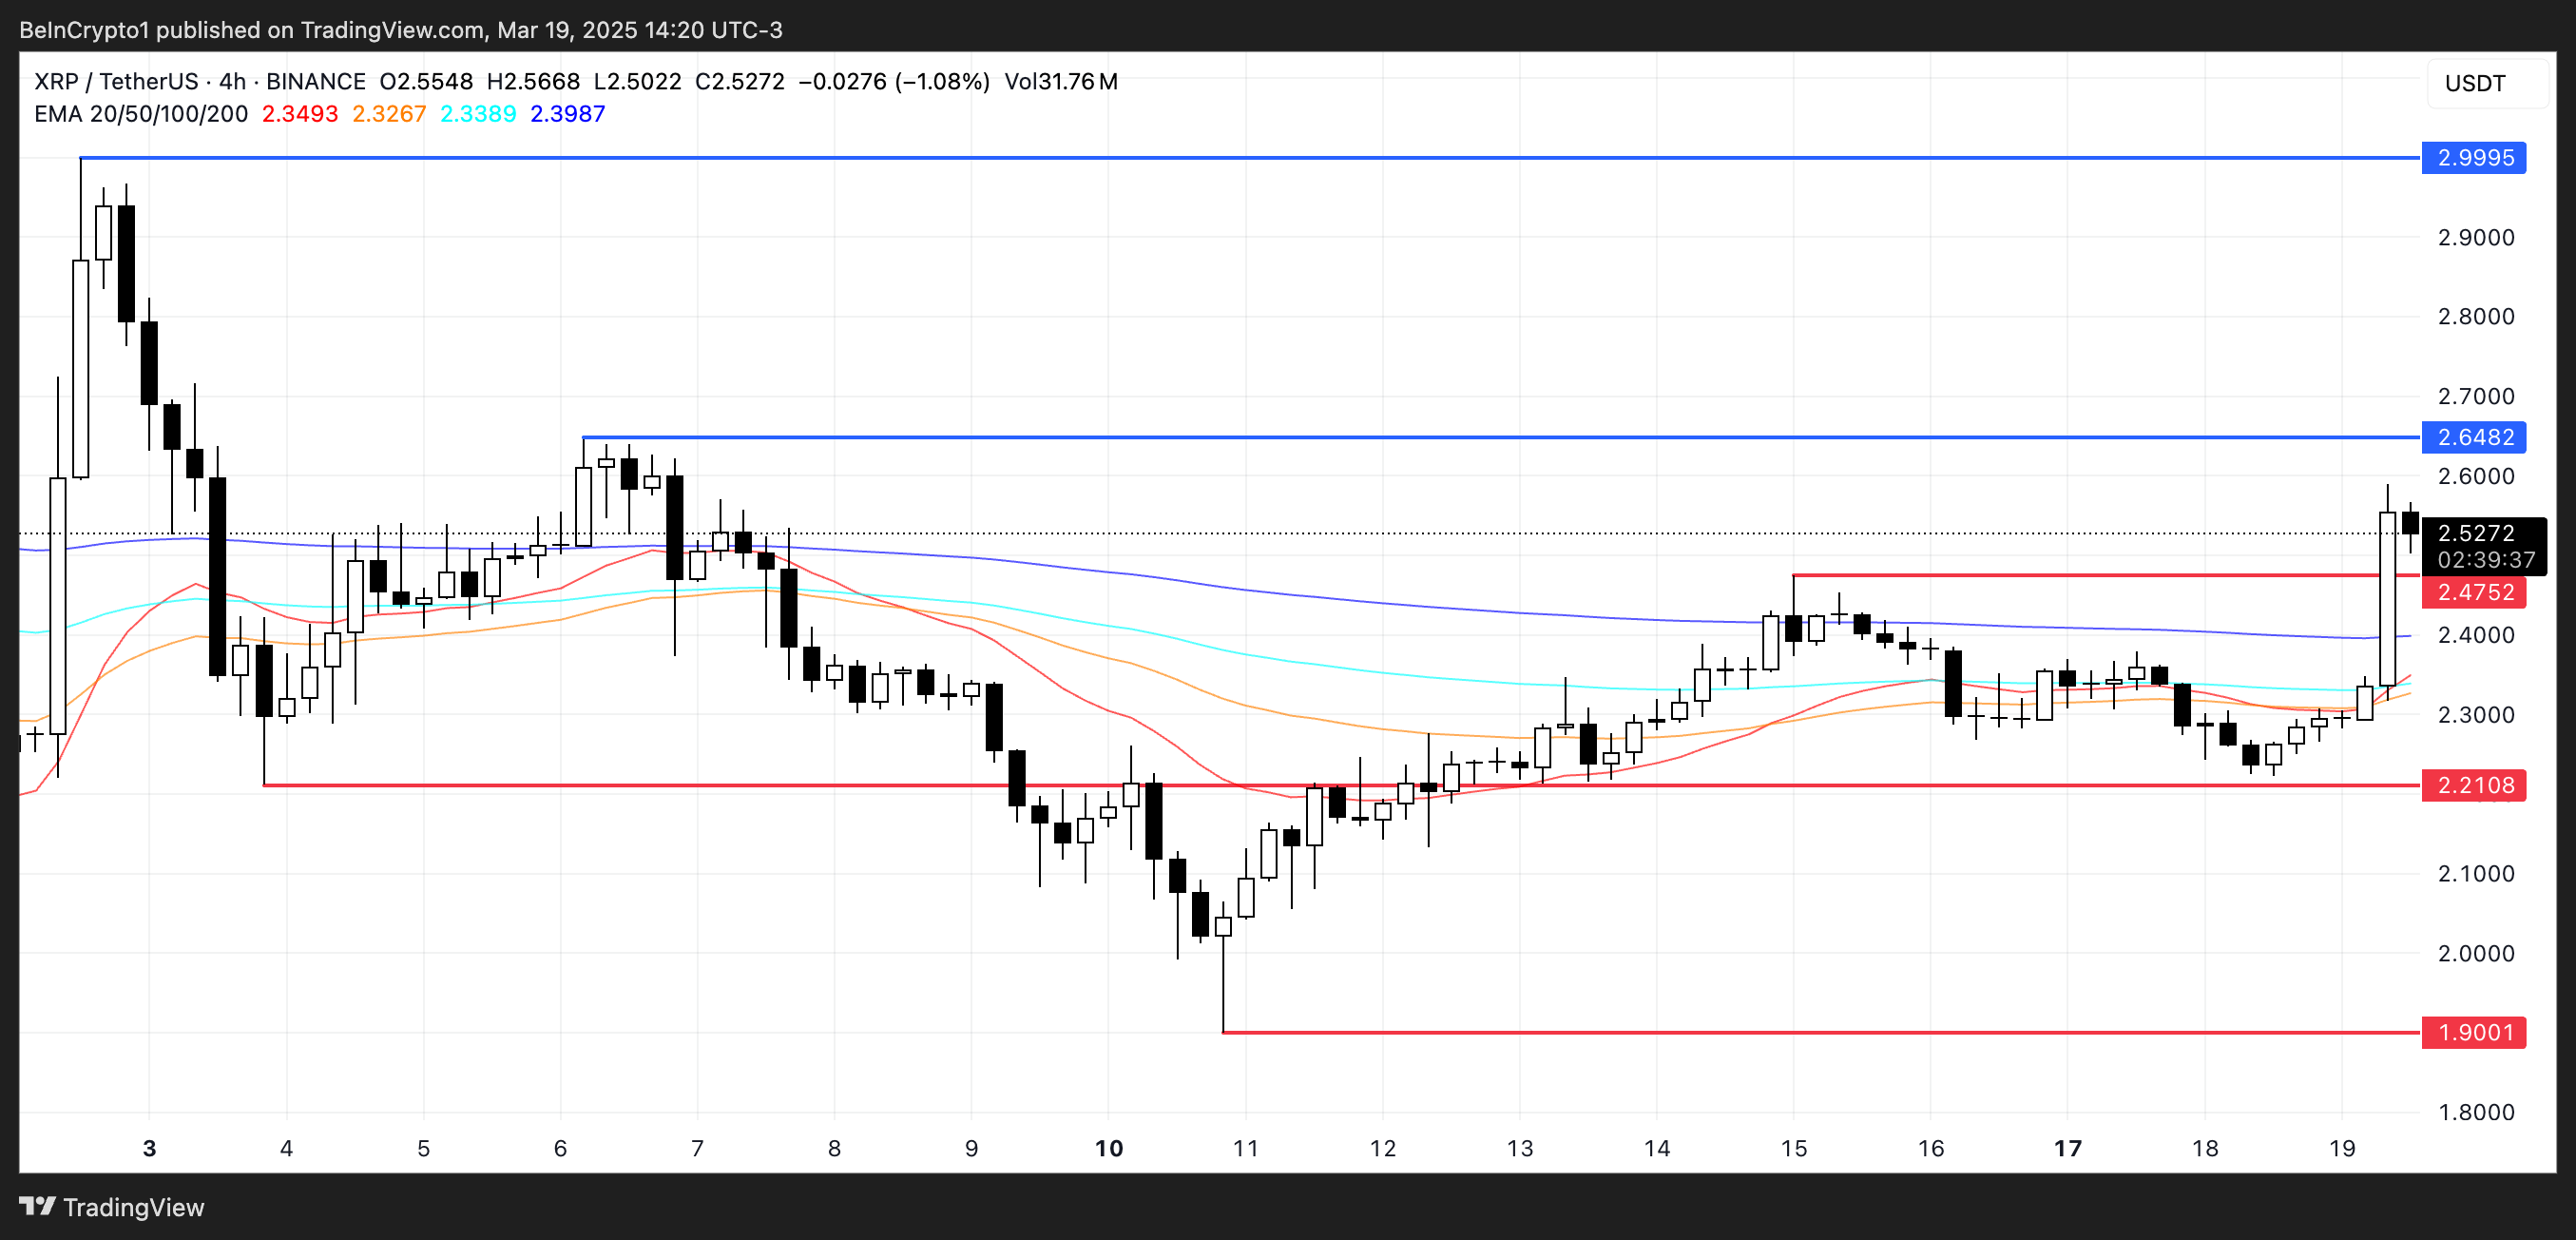
Conversely, a renewed downtrend could take shape if the bullish momentum fails to materialize and XRP’s price struggles to hold above its current range.
In this case, the key support level at $2.47 would become clear. A breakdown below this threshold could expose XRP to further downside risk, testing $2.21 and possibly driving it down to as low as $1.90.
Disclaimer
In line with the Trust Project guidelines, this price analysis article is for informational purposes only and should not be considered financial or investment advice. BeInCrypto is committed to accurate, unbiased reporting, but market conditions are subject to change without notice. Always conduct your own research and consult with a professional before making any financial decisions. Please note that our Terms and Conditions, Privacy Policy, and Disclaimers have been updated.

Reason to trust
![]()
Strict editorial policy that focuses on accuracy, relevance, and impartiality
Created by industry experts and meticulously reviewed
The highest standards in reporting and publishing
Strict editorial policy that focuses on accuracy, relevance, and impartiality
Morbi pretium leo et nisl aliquam mollis. Quisque arcu lorem, ultricies quis pellentesque nec, ullamcorper eu odio.
Crypto analyst CoinsKid has predicted that the XRP price could soon rally to $4, which represents a new all-time high (ATH) for the altcoin. He also warned that XRP bulls must hold the line to avoid a potential drop to as low as $1.64.
Analyst Predicts XRP Price Could Rebound To $4
In an X post, CoinsKid predicted that the XRP price could rebound to as high as $4 if the altcoin takes out the local January 2025 high, when it rallied to its current ATH at around $3.4. He added that XRP may go beyond this $4 target on the bull run in the crypto market. In the meantime, the analyst warned that XRP bulls must hold the line to avoid a significant correction.
Related Reading
CoinsKid said that failure to hold the 20 Weighted Moving Average could spark a deeper correction for the altcoin, sending the altcoin to a minimal target of $1.64. The analyst went further to discuss XRP’s current price action. He noted that the altcoin is missing a 5th wave from the July 2024 bottom.
The analyst further opined that the XRP price has been in a wave 4 irregular expanded flat ABC correction since December 2024. He revealed that XRP is currently holding the 20 Weighted Moving Average, which is a sign of strength from the bulls. However, he warned that they must continue to hold the line to avoid a drop to as low as $1.64.
Meanwhile, he mentioned that the RSI and the retail top were the key data points that pointed to an XRP price correction back in December. As to what could spark this price rebound to $4, CoinsKid alluded to the global money supply, which shows that liquidity is entering the market soon after leaving in December.
$5 Is Also In Sight For The Asset
Crypto analyst Dark Defender has also predicted that the XRP price could rally to as high as $5.85, although it would face significant resistance at $3.39, around its current all-time high. The analyst also highlighted $2.30 and $2.22 as the support levels that XRP needs to hold above as it eyes a rally to this $5 target.
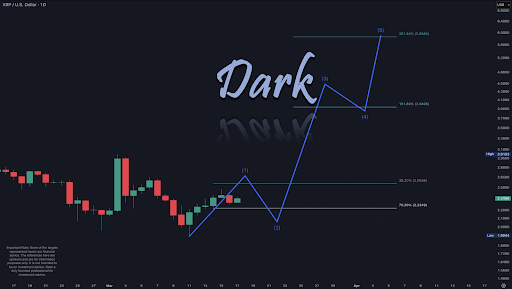
Meanwhile, the analyst also revealed that the primary correction for the price on the weekly, daily, and 4-hour structure is over. He noted that there will be more minor ups and downs. However, Dark Defender suggested XRP was well primed for a bullish reversal. He added that the altcoin has started wave 1 with the aim of rallying to this $5 target.
Related Reading: Crypto Pundit Reignites $100 XRP Price Target, What You Should Know
At the time of writing, the XRP price is trading at around $2.28, up in the last 24 hours, according to data from CoinMarketCap.
Featured image from Adobe Stock, chart from Tradingview.com
Bitcoin (BTC) is showing signs of a potential turnaround despite recent volatility, as key on-chain indicators and institutional flows point to improving sentiment. The Mayer Multiple remains below 1, hinting at undervaluation.
Meanwhile, institutional confidence appears to be returning, with BlackRock’s recent 2,660 BTC purchase marking the largest inflow into its Bitcoin ETF in six weeks. As the market stabilizes and adapts to macroeconomic pressures, Bitcoin’s path to new highs is beginning to take shape.
BTC Mayer Multiple Is Still Below 1
Bitcoin’s Mayer Multiple is currently sitting at 0.98, slightly above its recent low of 0.94 recorded on March 10.
This reading suggests that Bitcoin is still undervalued relative to its historical norms, as it continues to trade below its 200-day moving average.
The indicator has been hovering below the 1.0 mark for much of the recent consolidation period, raising questions about when BTC might regain enough momentum to push toward new highs.
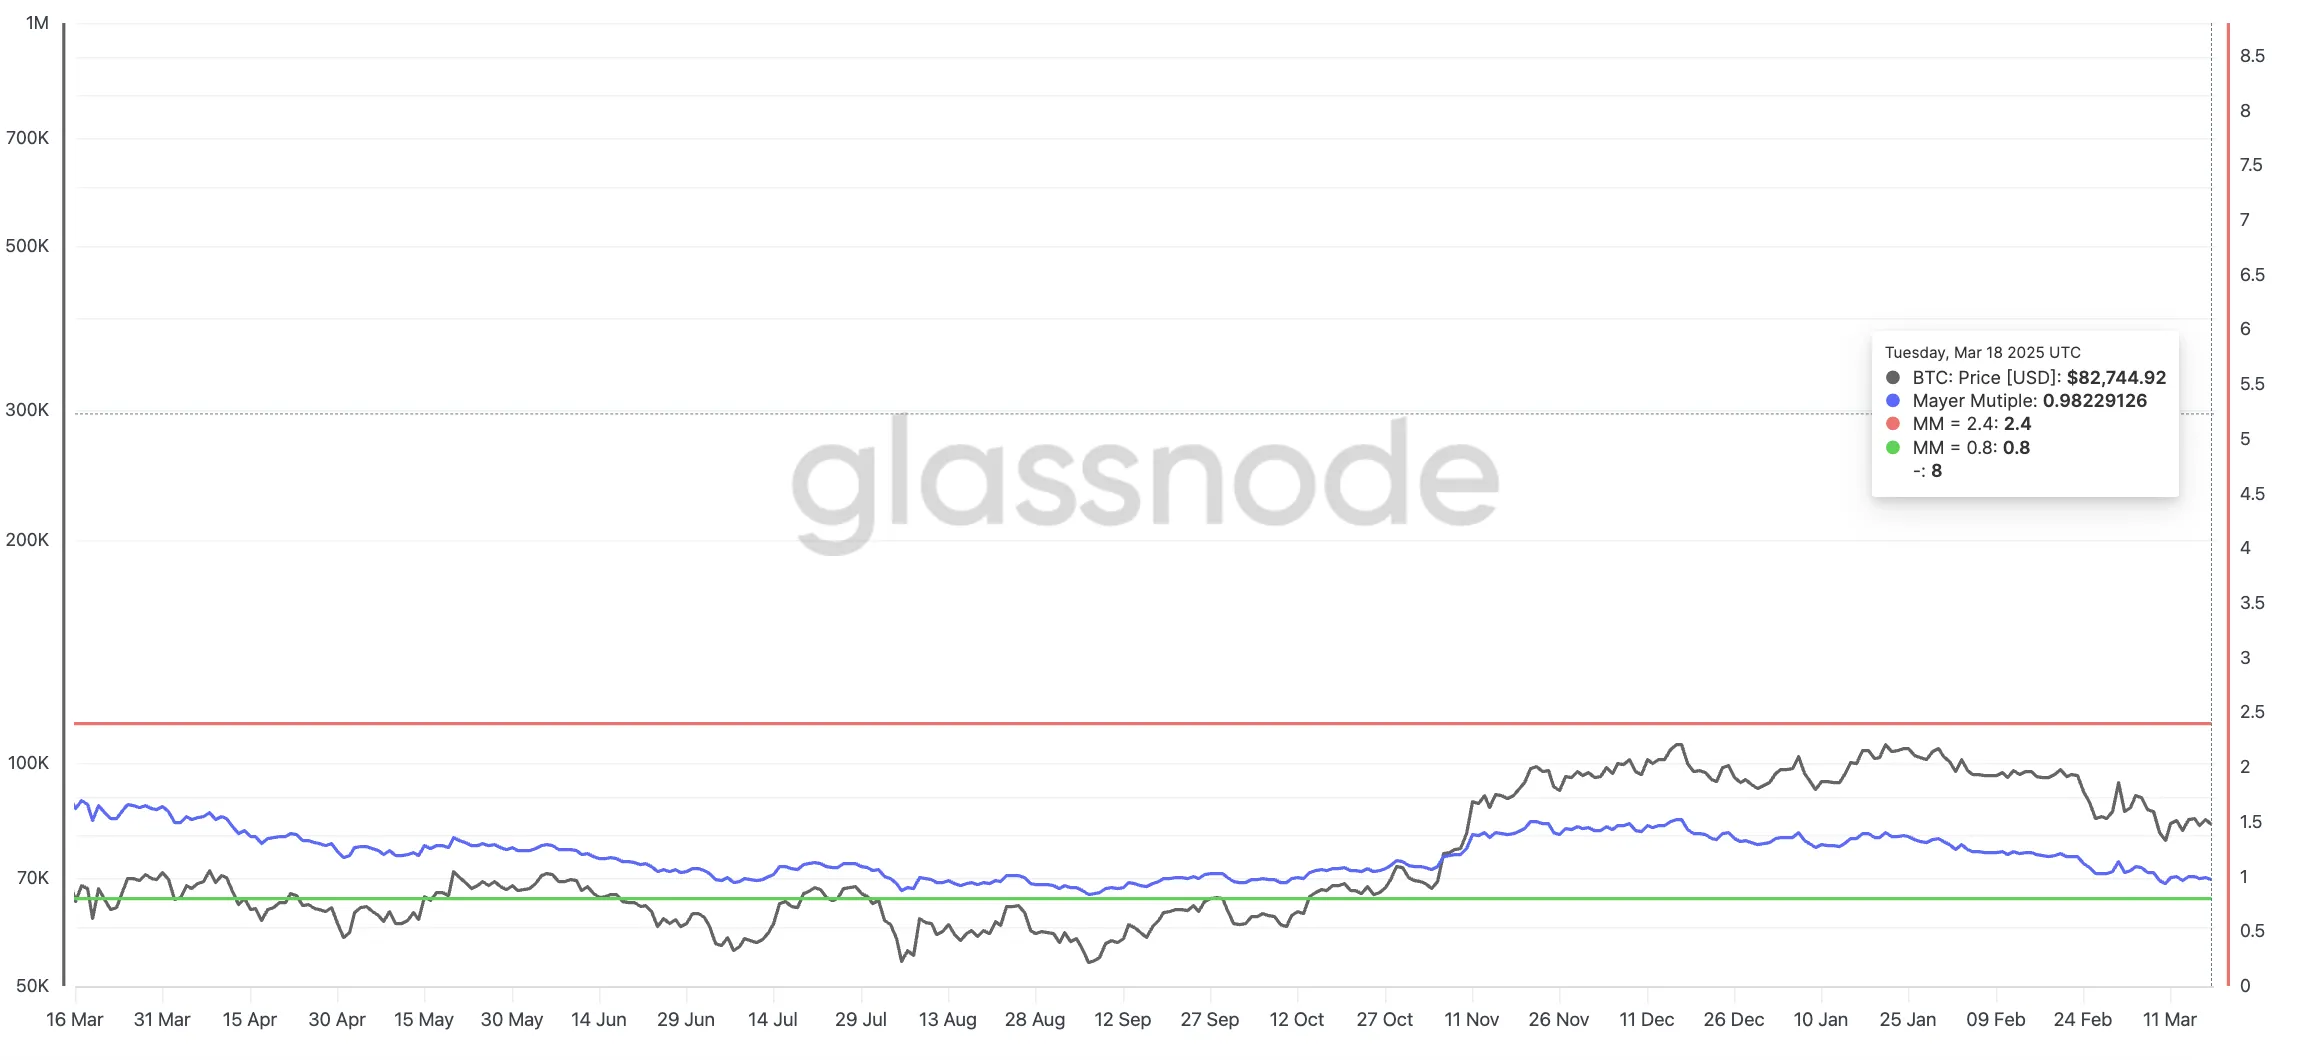
The Mayer Multiple measures the ratio of Bitcoin’s current price to its 200-day moving average, providing insights into whether the asset is overextended or undervalued.
Historically, values below 0.8 tend to signal that Bitcoin is heavily discounted and could be in a long-term accumulation zone, while levels above 2.4 often indicate overheated, euphoric conditions.
With the current reading at 0.98, Bitcoin is approaching a neutral-to-bullish threshold.
The last time the Mayer Multiple dipped to 0.84, Bitcoin quickly rallied from $54,000 to $65,000 in just two weeks. It later stabilized between 1.2 and 1.4 before ultimately surging past $100,000 for the first time.
While history doesn’t always repeat, this current setup could be an early sign that Bitcoin is building the foundation for its next major leg higher.
Bitcoin MVRV Brings An Important Threshold
Bitcoin’s 7-day MVRV (Market Value to Realized Value) ratio has climbed to 2.38%, recovering from a recent low of -8.44% on March 8.
This rebound signals that short-term holders are beginning to see modest profits, but historical patterns suggest that stronger price momentum usually follows once the 7D MVRV crosses above the 5% mark.
At its current level, BTC still appears to be in a transition phase. Sentiment is shifting, but it hasn’t fully flipped into a bullish breakout scenario.
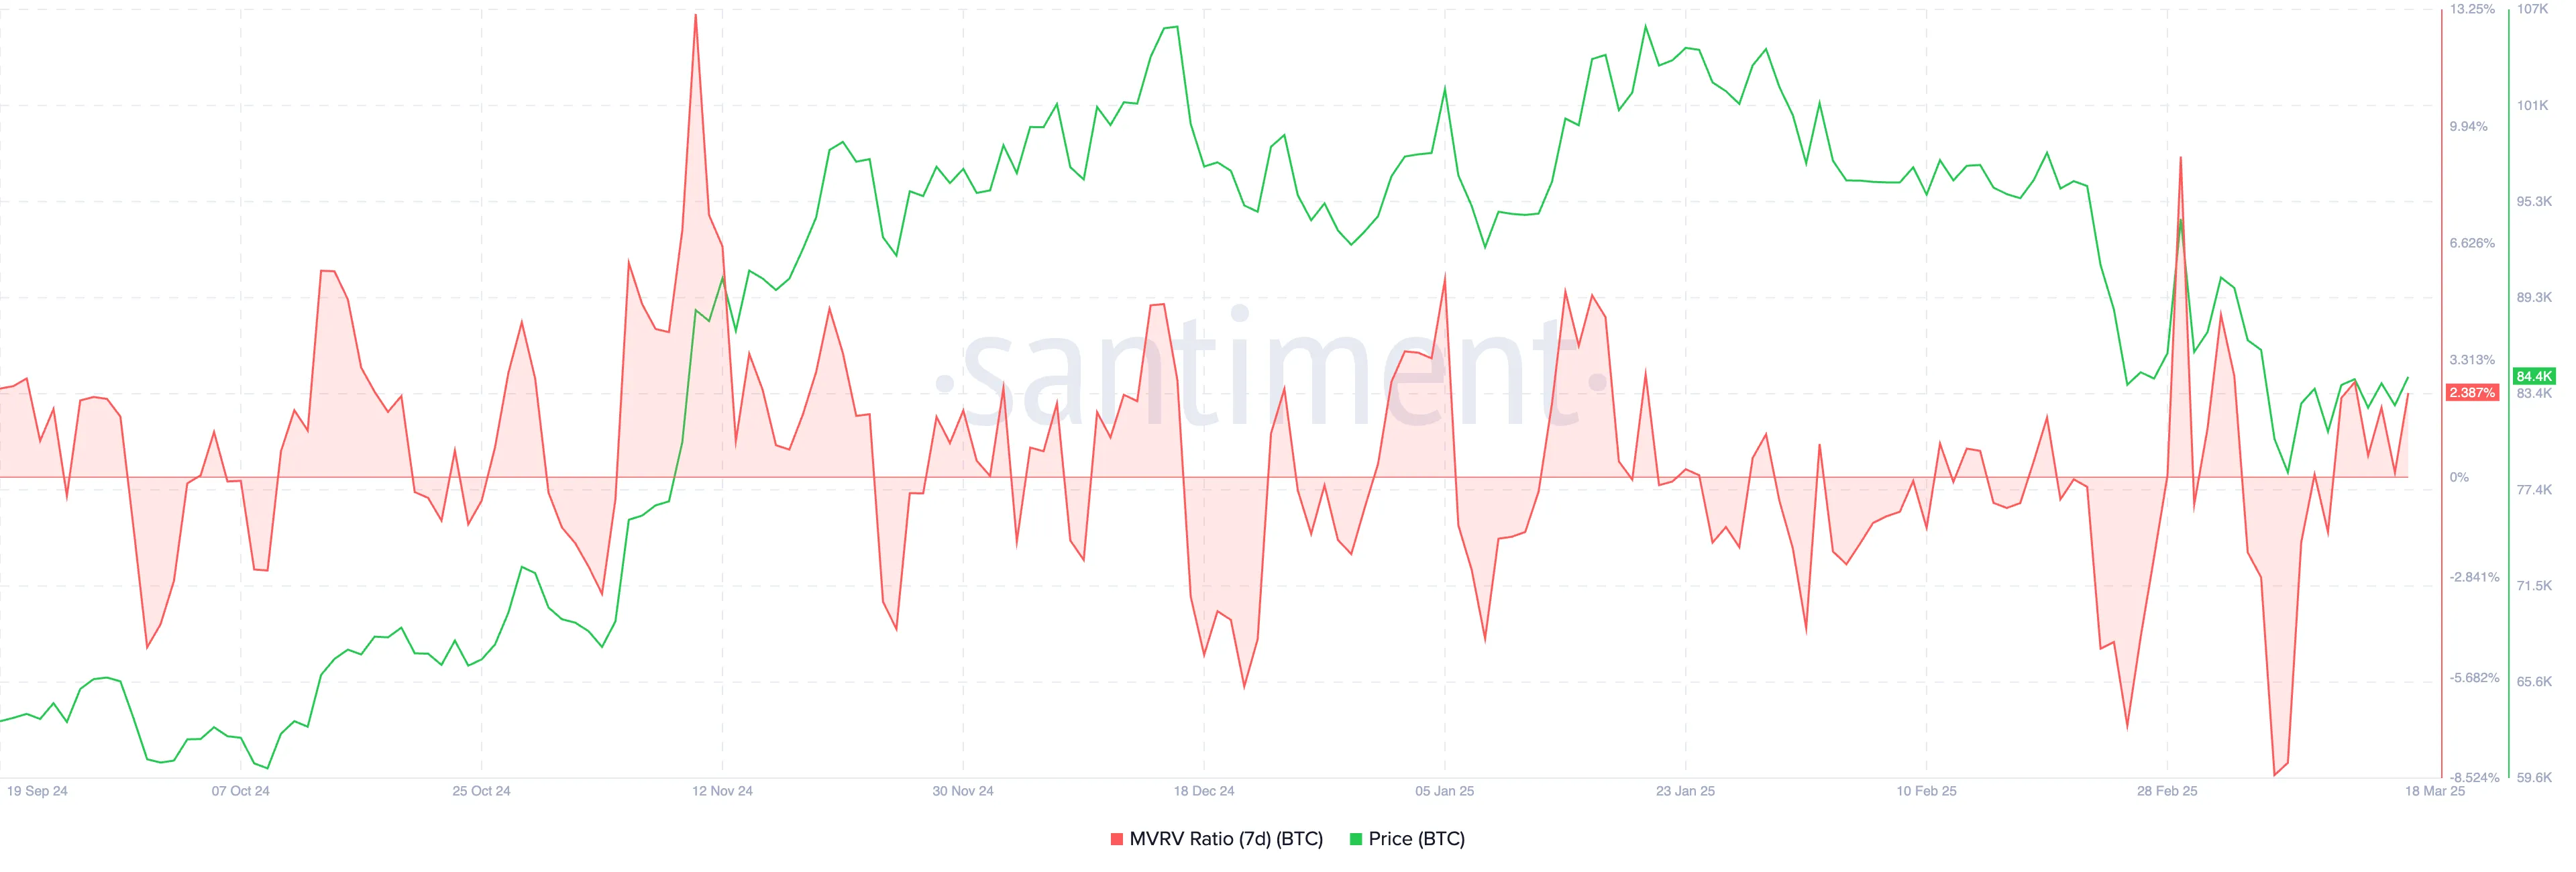
The 7D MVRV measures the ratio between Bitcoin’s market value and the average price paid by short-term holders (typically those who acquired BTC in the last 7 days). When the ratio is negative, it indicates these holders are underwater, while positive readings imply they are sitting on profits.
Historically, BTC tends to gain upward momentum when the 7D MVRV moves beyond +5%, as it suggests confidence among short-term participants is returning. Given that BTC is still below this threshold, it may need further accumulation or consolidation before it can convincingly push toward creating new highs.
If the ratio continues to climb and surpass 5%, that could trigger renewed bullish activity and a potential breakout toward fresh all-time highs.
Will Bitcoin (BTC) Create New Highs Soon?
Despite Bitcoin’s 11.4% decline over the past 30 days, institutional bullish sentiment appears to be back, with BlackRock signaling renewed confidence in BTC.
The world’s largest asset manager recently added 2,660 Bitcoin to its iShares Bitcoin Trust (IBIT), marking the biggest inflow into the fund in the past six weeks.
This significant buy comes after a period of uncertainty in IBIT flows since early February, suggesting that institutions are once again positioning for potential upside as market conditions evolve.
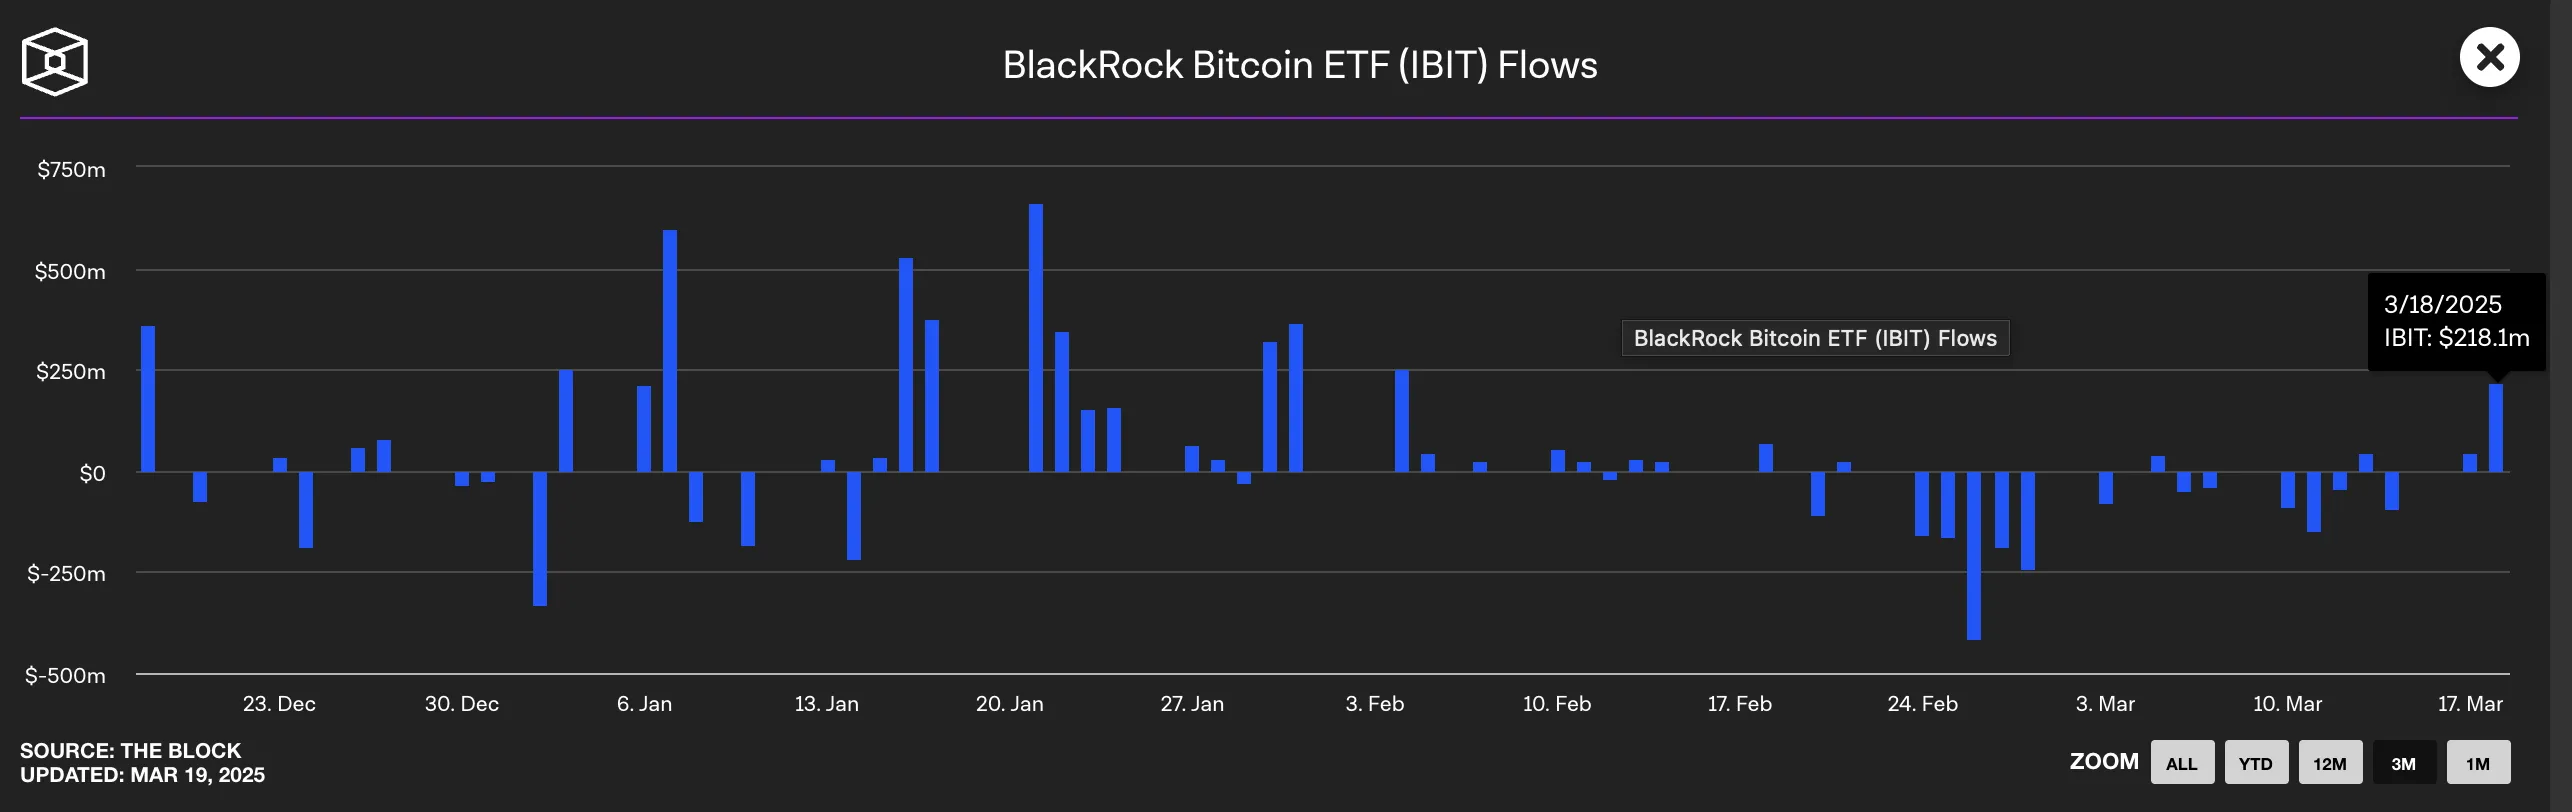
BlackRock’s latest buy could signal a broader shift in sentiment as big players overlook short-term volatility and refocus on Bitcoin’s long-term value.
Institutional interest is picking up again while the market slowly adapts to macro pressures like Trump’s proposed tariffs.
Despite the lingering uncertainty, Bitcoin price setup for new highs is growing stronger as confidence returns. If macro conditions stabilize, Bitcoin could be ready for another push higher soon.
Disclaimer
In line with the Trust Project guidelines, this price analysis article is for informational purposes only and should not be considered financial or investment advice. BeInCrypto is committed to accurate, unbiased reporting, but market conditions are subject to change without notice. Always conduct your own research and consult with a professional before making any financial decisions. Please note that our Terms and Conditions, Privacy Policy, and Disclaimers have been updated.

Ethereum’s Price Action Paints One Of Its Worst Charts Ever, What Comes Next For ETH?

What to Expect from XRP Price After the Ripple Lawsuit

President Trump To Address Crypto Summit Amid Bitcoin Reserve Strategy

Analyst Predicts XRP Price Could Rebound To $4, But Bulls Must Hold This Line

Brad Garlinghouse Predicts XRP Will Be Included In Digital Asset Stockpile
When Will Bitcoin (BTC) Break to New All-Time Highs?

2.52 Million Altcoins Are Ruining Crypto’s Future

Animoca Brands Valuation Tanks 75% In Two Years, Here’s Why

Crypto exchange BingX hacked for $43 million

Are The Big Players Losing Interest?

Hong Kong’s Securities Association Tips Authorities On Crypto Self-Regulation

Coinbase cbBTC Set to go Live on Solana
2.52 Million Altcoins Are Ruining Crypto’s Future
Animoca Brands Valuation Tanks 75% In Two Years, Here’s Why
Crypto exchange BingX hacked for $43 million
Are The Big Players Losing Interest?
Hong Kong’s Securities Association Tips Authorities On Crypto Self-Regulation
Coinbase cbBTC Set to go Live on Solana
-

 Ethereum20 hours ago
Ethereum To $800? Ascending Triangle Breakdown Signals Potential ETH Crash
-
 Altcoin15 hours ago
Binance Expands Support For StraitsX (XUSD) This Crypto, Here’s All
-

 Ethereum23 hours ago
Bullish Breakout On The Ethereum 4-Hour Chart Says Price Is Headed For $2,500
-

 Bitcoin12 hours ago
Is Strategy’s Bitcoin Gamble About to Backfire?
-

 Market23 hours ago
Solana Risks Falling to $120 Amid Weak TVL and Whale Activity
-

 Market12 hours ago
HBAR Price’s Recovery Set To Be Invalidated By Death Cross
-

 Ethereum22 hours ago
Ethereum Price: Analyst Predicts ‘Most Hated Rally In Crypto’
-

 Bitcoin22 hours ago
Schiff Predicts A Catastrophic 85% BTC Drop—Details