
Ethereum
Ethereum Is Retesting A 5-Year Long Trendline – Massive Rally Incoming?

Reason to trust
![]()
Strict editorial policy that focuses on accuracy, relevance, and impartiality
Created by industry experts and meticulously reviewed
The highest standards in reporting and publishing
Strict editorial policy that focuses on accuracy, relevance, and impartiality
Morbi pretium leo et nisl aliquam mollis. Quisque arcu lorem, ultricies quis pellentesque nec, ullamcorper eu odio.
Ethereum is currently consolidating below the $2,000 mark, trading within a narrow range between $1,800 and $1,900 as market uncertainty persists. Bulls have lost control, and speculation about a potential continuation of the bear trend is growing among analysts and investors. With macroeconomic instability, rising trade war fears, and erratic policy decisions from US President Trump, both crypto and U.S. stock markets remain highly volatile, adding to Ethereum’s struggles.
Related Reading
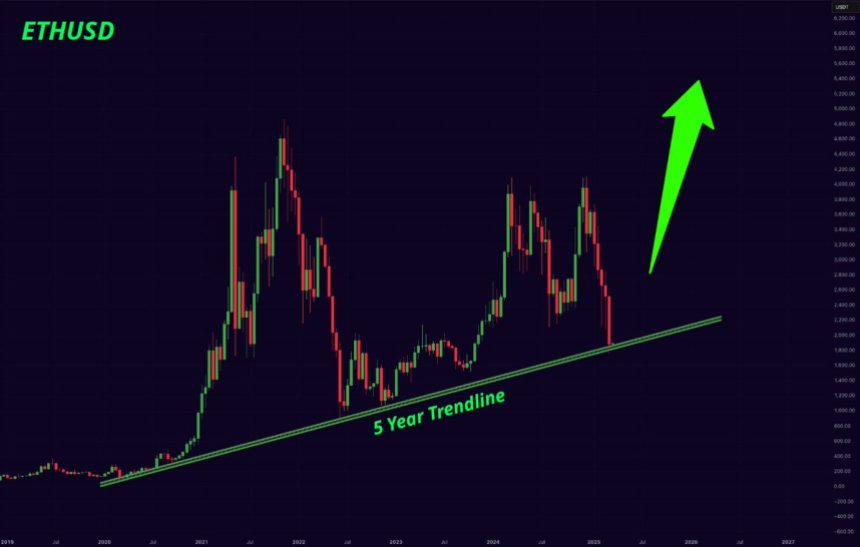
To highlight Ethereum’s fragile position, top analyst Mister Crypto shared a technical analysis revealing that ETH is currently testing a 5-year-long trendline, a crucial level that has historically acted as strong support during major corrections. If Ethereum fails to hold this trendline, the market could see a deeper decline, reinforcing bearish sentiment and potentially pushing ETH toward lower demand zones.
On the other hand, if Ethereum holds above this trendline, it could trigger a strong recovery, offering hope for bulls looking for a reversal. Over the coming days, Ethereum’s reaction at this level will determine its next major move, making this a pivotal moment for the second-largest cryptocurrency.
Ethereum Faces Crucial Test as It Trades Below Multi-Year Support
Ethereum has been under massive selling pressure, driven by macroeconomic uncertainty and trade war fears that have rattled both the crypto and U.S. stock markets. With risk assets struggling to find stability, ETH has lost key price levels and now trades below a critical multi-year support around $2,000, which could flip into strong resistance if bulls fail to reclaim it.
Related Reading
Analysts warn that Ethereum’s downtrend may continue as broader economic conditions show no signs of improvement. Investors remain cautious, with global trade tensions, inflation concerns, and U.S. regulatory uncertainties weighing on market sentiment. However, despite these bearish factors, some experts believe Ethereum could be preparing for a long-term recovery.
Mister Crypto’s technical analysis on X highlights that Ethereum is currently testing a 5-year-long support trendline, an even stronger level than the $2,000 demand zone. According to his insights, this trendline has historically held during major corrections and served as a key turning point for bullish reversals. If Ethereum maintains support above this level, it could trigger a significant recovery rally, pushing ETH back above $2,000 and beyond.
Over the coming weeks, Ethereum’s price reaction at this crucial trendline will determine whether a reversal is on the horizon or if the bearish trend will extend further.
ETH Bulls And Bears Battle For Control
Ethereum is now at a crucial crossroads, with bulls struggling to reclaim the $2,000 mark, while bears fail to push ETH below $1,800. This prolonged consolidation phase has left investors uncertain about the next major move for ETH.
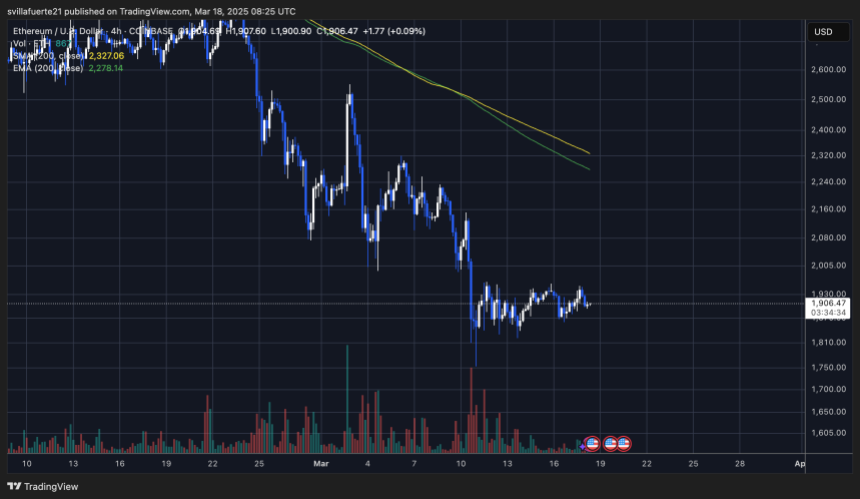
For a recovery rally to take shape, bulls must reclaim the $2,300 level, which aligns with the 4-hour 200 moving average (MA) and exponential moving average (EMA). Breaking above this level would signal a shift in momentum and pave the way for further upside toward key resistance zones.
However, failure to reclaim the $2,000 mark and hold above crucial moving averages could trigger another wave of selling pressure. A decisive drop below $1,800 would put Ethereum in dangerous territory, opening the door for a potential retest of lower demand zones around $1,600-$1,700.
Related Reading
With macroeconomic uncertainty and market-wide volatility still in play, ETH traders should watch for a breakout or breakdown from the current range, as the next few sessions will determine the short-term trend for Ethereum.
Featured image from Dall-E, chart from TradingView


According to a recent X post by seasoned crypto analyst Ali Martinez, Ethereum (ETH) price could face further decline as it risks breaking down from an ascending triangle pattern – potentially crashing to as low as $800.
Ethereum To Crash To $800?
Ethereum (ETH) has struggled over the past three years, failing to reclaim its all-time high (ATH) of $4,878 from November 2021. Meanwhile, other cryptocurrencies like Bitcoin (BTC) and Solana (SOL) have surged to new ATHs earlier this year.
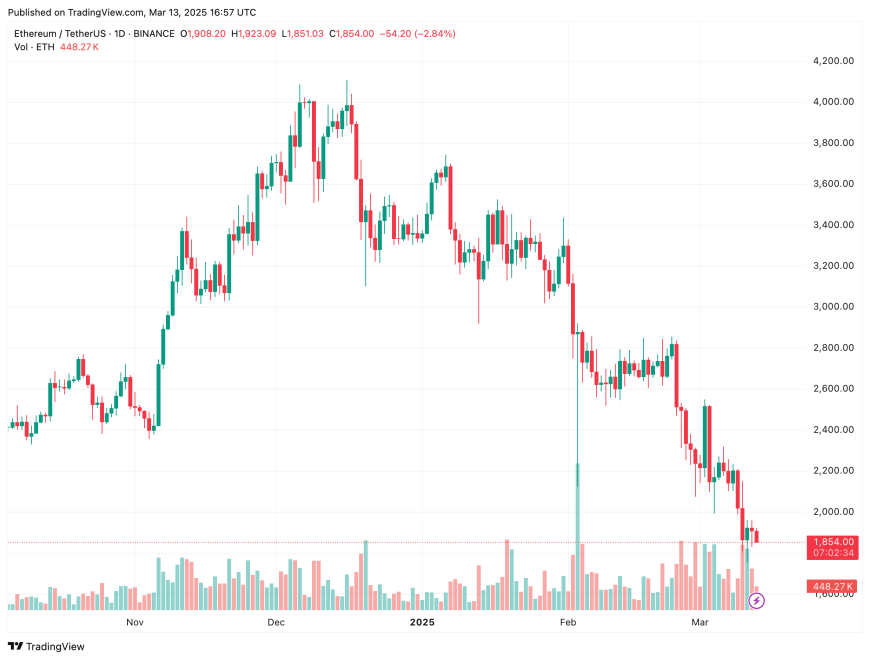
Amid a broader crypto market pullback driven by geopolitical tensions and tariff concerns, ETH has fallen 30% in the past month – dropping from $2,800 on February 13 to around $1,900 at the time of writing.
That said, Ethereum’s woes may still continue. Recent price analysis by Martinez highlights how ETH has been trading in an ascending triangle, and has so far failed to decisively break through the $4,000 resistance level.
The leading smart contract token has now broken down from the pattern, raising the possibility of a crash to as low as $800. The last time ETH traded at $800 was way back in December 2020.
Ethereum’s below average price performance relative to other digital assets is further hampered by the relentless selling it has witnessed over the past few months. A post by CryptoQuant CEO, Ki Young Ju, shows that since January 2020, ETH has faced the highest selling in the first three months of 2025.

Further, recent analysis by another crypto analyst, Ted, emphasizes the similarity between the current ETH price crash and the capitulation candle in March 2020 due to the COVID pandemic. The analyst said:
I wouldn’t be surprised if ETH goes a bit lower from here towards $1.4K-$1.6K level. But that doesn’t mean everything is over. $10K ETH will happen this cycle.
All May Not Be Lost For ETH
While there is considerable pessimism about ETH’s short-term price action, some analysts suggest that the digital asset may soon witness a swift price recovery.
For instance, crypto trader Merlijn The Trader brought attention to Ethereum’s 3-year Stochastic Relative Strength Index (RSI) level. The analyst noted that ETH’s Stochastic RSI is significantly oversold, raising optimism for a potential “massive rally.”
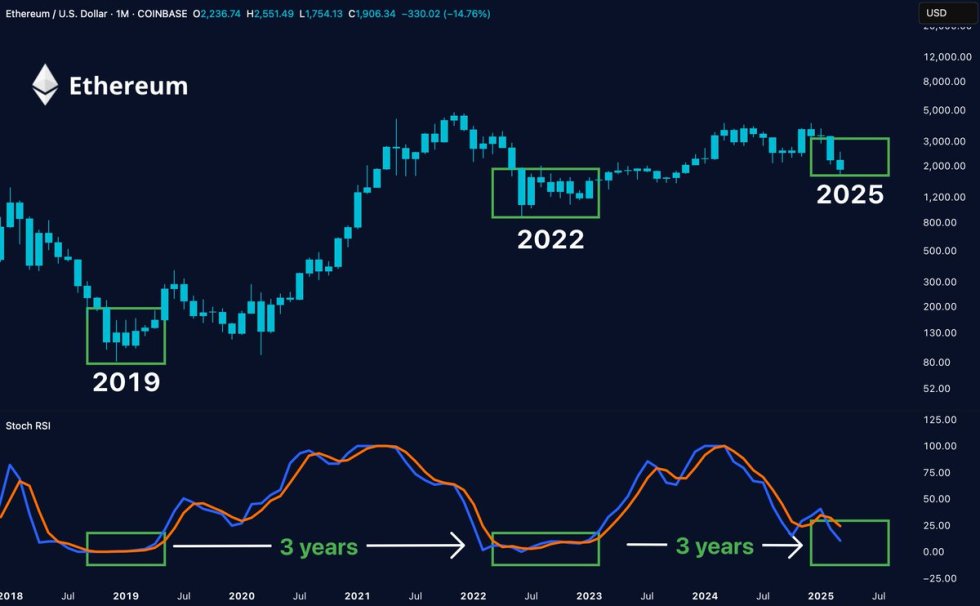
For the uninitiated, the Stochastic RSI is a momentum indicator that shows whether an asset is overbought or oversold by comparing the RSI to its recent range. It moves between 0 and 1, with values above 0.8 suggesting overbought and below 0.2 indicating oversold conditions.
In addition, recently crypto analyst Crypto Yoddha stated that ETH may have already hit the bottom for this market cycle. At press time, ETH trades at $1,854, down 1.2% in the past 24 hours.
Featured image from Unsplash, Charts from X and TradingView.com
Editorial Process for bitcoinist is centered on delivering thoroughly researched, accurate, and unbiased content. We uphold strict sourcing standards, and each page undergoes diligent review by our team of top technology experts and seasoned editors. This process ensures the integrity, relevance, and value of our content for our readers.

The Ethereum price action continues to stir controversy as market sentiment remains deeply bearish. Notably, a crypto analyst has predicted what they call “the most hated rally in crypto”, suggesting that ETH could defy expectations and surge higher, triggering intense skepticism from traders and investors.
Ethereum Price Surge To Spark Controversy
Using the Elliott Wave Theory as the basis for his Ethereum price prediction, X (formerly Twitter) crypto analyst Decode predicts a possible price reversal in the top altcoin.
The analyst shared a chart pinpointing Waves 1-5 of Ethereum’s Elliott Wave structure. Currently, the altcoin is in a Wave 4 correction, which has unfolded as a complex WXYXZ structure, a typical sideways corrective combination. Decode also highlights that the “1.236 Fibonacci extension of C vs A” has been reached, effectively completing Wave 4.
If Wave 4 is concluded, the analyst suggests that the Ethereum price should start Wave 5 soon, leading to a strong bullish rally toward $13,500 to $17,000. However, ETH’s present market sentiment is extremely bearish, implying that capitulation may be closer than a rally.

Since market reversals often occur when sentiment and demand are at their worst, this could indicate a potential bottom for the Ethereum price. The analyst predicts that the asset could stage a strong rally after its decline, triggering what he calls “the most hated rally ever seen in crypto.”
The reason Decode describes ETH’s next price rally so ominously is likely because he expects it to be met with extreme skepticism and disbelief. Right now, the crypto community is highly pessimistic about the Ethereum price outlook due to its prolonged sideways trading. This sentiment is seemingly justified, as ETH has failed to rally ETH has failed to rally significantly, unlike most altcoins in the crypto space.
While Bitcoin and altcoins like Solana, Cardano, and XRP have skyrocketed recently, Ethereum still trades at significant lows, even crashing by more than 30% in the last month. If the market remains hesitant toward ETH and avoids buying during price dips, frustration, and regret could grow once the altcoin surges unexpectedly, leaving investors watching from the sidelines as they miss out on potential gains.
Analyst Asserts ETH Is Staging A Comeback
Despite the broader market volatility and Ethereum’s slow price growth, market expert ‘Crypto Caeser’ remains optimistic about ETH’s rally potential. The analyst predicts that Ethereum could stage a comeback and rebound soon.
This bullish prediction is based on past cycles, during which ETH has faced similar periods of severe decline and consolidation. In his price chart, the analyst emphasized that after the COVID-19 crash and ETH’s local bottom, the cryptocurrency recorded a massive price rally in the following year.
According to the analyst, Ethereum has hit another local bottom following the Bybit hack attack. If history repeats, ETH could experience a strong recovery and trigger a surge toward $5,000 this bull cycle.
Featured image from Pexels, chart from Tradingview.com
Editorial Process for bitcoinist is centered on delivering thoroughly researched, accurate, and unbiased content. We uphold strict sourcing standards, and each page undergoes diligent review by our team of top technology experts and seasoned editors. This process ensures the integrity, relevance, and value of our content for our readers.

Reason to trust
![]()
Strict editorial policy that focuses on accuracy, relevance, and impartiality
Created by industry experts and meticulously reviewed
The highest standards in reporting and publishing
Strict editorial policy that focuses on accuracy, relevance, and impartiality
Morbi pretium leo et nisl aliquam mollis. Quisque arcu lorem, ultricies quis pellentesque nec, ullamcorper eu odio.
Ethereum has faced intense selling pressure over the past few weeks, with its price falling below the $2,000 threshold. This intense run of declines saw the cryptocurrency reach a low of $1,750 on March 11, marking its lowest point since November 2023. However, despite this steep drop, a new technical setup suggests Ethereum could be on the verge of a bullish turnaround, as it now retests a key resistance level on the 4-hour chart.
Ethereum Retests Critical Resistance After Rebound
Ethereum’s price action has been full of downtrends and many investors exiting their positions since the beginning of March. As such, Ethereum broke finally below $2,000 on March 10 after support failed to hold, and has spend the past week trading below this level.
Related Reading
Although after sinking to $1,750, Ethereum has shown signs of recovery and has now rebounded to around $1,900. This little price action of recovery has brought the cryptocurrency back to a downward-sloping resistance trendline, a level that has acted as a barrier to brief upward movements of accumulations during the recent downtrend.
The test of this resistance now presents a potential breakout scenario where bullish momentum flows into Ethereum. An analyst on TradingView highlighted this setup, noting that a breakout above the resistance trendline could open the doors for a significant rally above $2,000.
Analyst Sets Bullish Price Targets For ETH
Despite the prevailing bearish sentiment that continues to weigh heavily on the broader crypto market, a TradingView analyst has identified a bullish trade setup on Ethereum’s 4-hour candlestick chart. This suggests that despite the recent decline, there remains a degree of optimism among some analysts and investors who believe Ethereum could soon regain its bullish footing.
Related Reading
According to the analysis, a confirmed breakout above $1,885 could serve as an ideal entry point. At the time of writing, Ethereum is yet to break above the downward sloping resistance trendline, as the breakout point is currently set just below $2,000. If Ethereum were to eventually break above the resistance, the analyst noted a probable price target of $2,596.
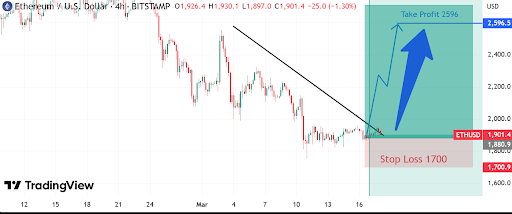
On the flip side, the analysis advices placing a stop loss at $1,700, meaning the setup is structured to manage risk while aiming for substantial gains. This is in case if the bearish momentum is too great to be overcome, and the Ethereum price gets rejected again at the resistance trendline. Given the high-risk reward ratio, the analyst advised watching for a surge in volume, which would provide confirmation that Ethereum is breaking out with momentum.
At the time of writing, Ethereum is trading at $1,895. Price action in the past 24 hours saw Ethereum reach an intra-day high of $1,950 before rejecting. However, the leading altcoin is still rolling around this resistance trendline, and there is a chance of a push upward again in the next 48 hours.
Featured image from Unsplash, chart from Tradingview.com

Ethereum To $800? Ascending Triangle Breakdown Signals Potential ETH Crash

The Web3 Solution to AI Copyright and Ownership

Coinbase Launches Verified Pools for Retail Users

Schiff Predicts A Catastrophic 85% BTC Drop—Details

Ethereum Price: Analyst Predicts ‘Most Hated Rally In Crypto’

Solana Risks Falling to $120 Amid Weak TVL and Whale Activity

2.52 Million Altcoins Are Ruining Crypto’s Future

Animoca Brands Valuation Tanks 75% In Two Years, Here’s Why

Crypto exchange BingX hacked for $43 million

Are The Big Players Losing Interest?

Hong Kong’s Securities Association Tips Authorities On Crypto Self-Regulation
Coinbase cbBTC Set to go Live on Solana
2.52 Million Altcoins Are Ruining Crypto’s Future
Animoca Brands Valuation Tanks 75% In Two Years, Here’s Why
Crypto exchange BingX hacked for $43 million
Are The Big Players Losing Interest?
Hong Kong’s Securities Association Tips Authorities On Crypto Self-Regulation
Coinbase cbBTC Set to go Live on Solana
-
 Market24 hours ago
Critical Exploit Hits BNB Chain’s four.meme: SlowMist Raises Alarm
-

 Market21 hours ago
Crypto.com Reverses 2021 Token Burn, Re-Mints 70B CRO
-

 Market23 hours ago
BSC DEX Volume Surpassed Solana Thanks to Meme coins
-
 Altcoin22 hours ago
Here’s Why Pi Coin Is Falling
-

 Market22 hours ago
Binance Alpha Listing and CZ Spark 200% Rally In MUBARAK Coin
-
 Altcoin21 hours ago
Pepe Coin Price Eyes 40X Breakout Amid Bull Run, Here’s All
-
 Bitcoin21 hours ago
Bitcoin’s Halving Cycle No Longer Drives Price Trends
-
 Market20 hours ago
Hyperliquid Surpasses $1 Trillion in Perps Trading Volume