
Market
Analyst Reveals Next Major Support
Reason to trust
![]()
Strict editorial policy that focuses on accuracy, relevance, and impartiality
Created by industry experts and meticulously reviewed
The highest standards in reporting and publishing
Strict editorial policy that focuses on accuracy, relevance, and impartiality
Morbi pretium leo et nisl aliquam mollis. Quisque arcu lorem, ultricies quis pellentesque nec, ullamcorper eu odio.
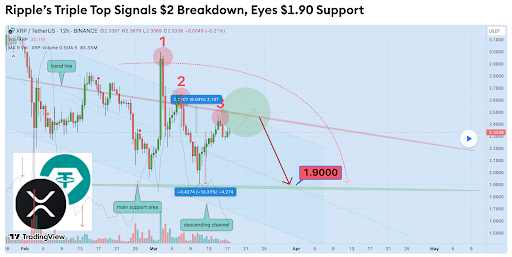
Crypto analyst MadWhale has raised the possibility of the XRP price experiencing a breakdown below the crucial $2 support level. The analyst also revealed the next major support if XRP drops below this support level.
XRP Price Could Drop To $1.90 If It Loses $2 Support
In a TradingView post, MadWhale predicted that the XRP price could drop to the major support at $1.90 if it loses the psychological $2 level. He noted that XRP has demonstrated a classic triple-top formation, with each successive peak showing weaker momentum. In line with this, the analyst asserted that a break below the 42 threshold appears imminent as XRP nears a formidable resistance zone.
Related Reading
MadWhale further stated that the downward move is expected to extend to at least $1.9, representing an 18% decline. The analyst added that such a price decline aligns with the primary target and a key daily support level. Crypto analyst Ali Martinez had also suggested that XRP could drop to as low as $1.2 if it loses the $2 support.
The analyst revealed that the XRP price was forming a head-and-shoulders pattern on the weekly chart, which puts the $2 support level in the spotlight. His accompanying chart showed that the crypto could drop to $1.2 if it breaks below $2. However, despite this bearish outlook, other crypto analysts, such as Egrag Crypto, have highlighted some positive aspects of the XRP price.
Egrag Crypto stated that the XRP price’s dominance was showing tremendous strength and predicted that if it successfully closed above Fib 0.5, it could soon rally to the Fib 0.888 level. Crypto analyst Dark Defender predicted that XRP could rally to a new all-time high (ATH) if it continues to hold the crucial support levels at $2.04 and $2.22.
The Altcoin Still In Waiting Mode
Crypto analyst CasiTrades stated that the XRP price is holding strong but is still in waiting mode. She added that the bullish structure remains intact, with the altcoin holding above $2.26, which is the key .382 retracement support. The analyst noted that XRP’s price has spent some time flipping the consolidation to support, indicating that markets are setting up for the next move.
Related Reading
The crypto analyst revealed the $2.70 and $3.05 resistance levels and $2.25 support level as the key levels to watch. She remarked that the XRP price needs to flip $2.70 and $3.05 to become support for the confirmation of the next wave up. Meanwhile, CasiTrades suggested that XRP risks dropping to as low as $1.54 if it loses the lower support support at $1.90.
The crypto analyst also mentioned that the price needs to break above $3.40, its current ATH, to confirm a new trend. Until then, the wait for signs of confirmation continues, which she claimed may not be obvious until wave 3 in the market cycle. CasiTrades asserted that key Fib levels have been breached, and the market is on the edge of a breakout.
At the time of writing, the XRP price is trading at around $2.29, down over 2% in the last 24 hours, according to data from CoinMarketCap.
Featured image from Medium, chart from Tradingview.com


Coinbase announced Verified Pools, a new service intended to attract institutional users. These liquidity pools will offer clients a secure way to take advantage of high efficiency and native on-chain infrastructure.
Liquidity pools, in general, offer many of the same advantages, but they do not have sufficient security assurances for major institutions. The exchange hopes to provide security and confidence with proactive measures like KYC and sanctions screening.
What are Coinbase’s Verified Pools?
Coinbase, one of the largest crypto exchanges in the US, has been actively expanding its services under the current pro-regulatory shift.
Today, the exchange announced the introduction of Verified Pools, an institutional-grade service to enhance on-chain trades and swaps.
“Verified Pools is a curated selection of liquidity pools available only with the Coinbase Verifications credential. Verified Pools is the next step in Coinbase’s commitment to advancing the onchain ecosystem and generating the next wave of onchain adoption,” the firm claimed via social media.
Coinbase’s Verified Pools hope to solve an important issue for institutional investors in the crypto space.
Specifically, how can retail users or traditional institutions participate in DeFi despite significant barriers around compliance, counterparty risk, and operational complexity?
Sketchy exchanges and business practices are epidemic in the industry, and these institutions need real assurances.
Through Verified Pools, Coinbase addresses several of these concerns. It ensures that all participants of a liquidity pool are identity-verified using Coinbase’s verification system
The whole platform is powered by Base, Coinbase’s Ethereum-centric L2 blockchain solution. This means that the service is natively on-chain and can benefit from smooth transactions while ensuring security, transparency, and accountability.
Verified Pools offer a few other attractive features for Coinbase’s institutional clients. For example, the pools are non-custodial, allowing users to maintain control over their assets.
In the main, however, the exchange is trying to offer liquidity pools with all their advantages to institutional traders, which is uncommon. The main benefits are inherent to pools in general.
In short, Coinbase’s Verified Pools can offer liquidity, efficiency, and transparency while prioritizing user security and confidence. Moving forward, the exchange plans to expand asset coverage and trading pairs, integrate more DEX aggregators, offer the service in more countries, and more.
Disclaimer
In adherence to the Trust Project guidelines, BeInCrypto is committed to unbiased, transparent reporting. This news article aims to provide accurate, timely information. However, readers are advised to verify facts independently and consult with a professional before making any decisions based on this content. Please note that our Terms and Conditions, Privacy Policy, and Disclaimers have been updated.
Solana (SOL) has been under pressure, struggling to remain above the $130 mark for the past seven days. Over the last 30 days, SOL has corrected by nearly 36%, reflecting broader market weakness.
The continued decline is being driven by Solana’s Total Value Locked (TVL) and whale activity, which show mixed signals. As SOL trades within a tight range, investors are closely watching key support and resistance levels to gauge where the next major move could unfold.
Solana TVL Struggles Below $9 Billion
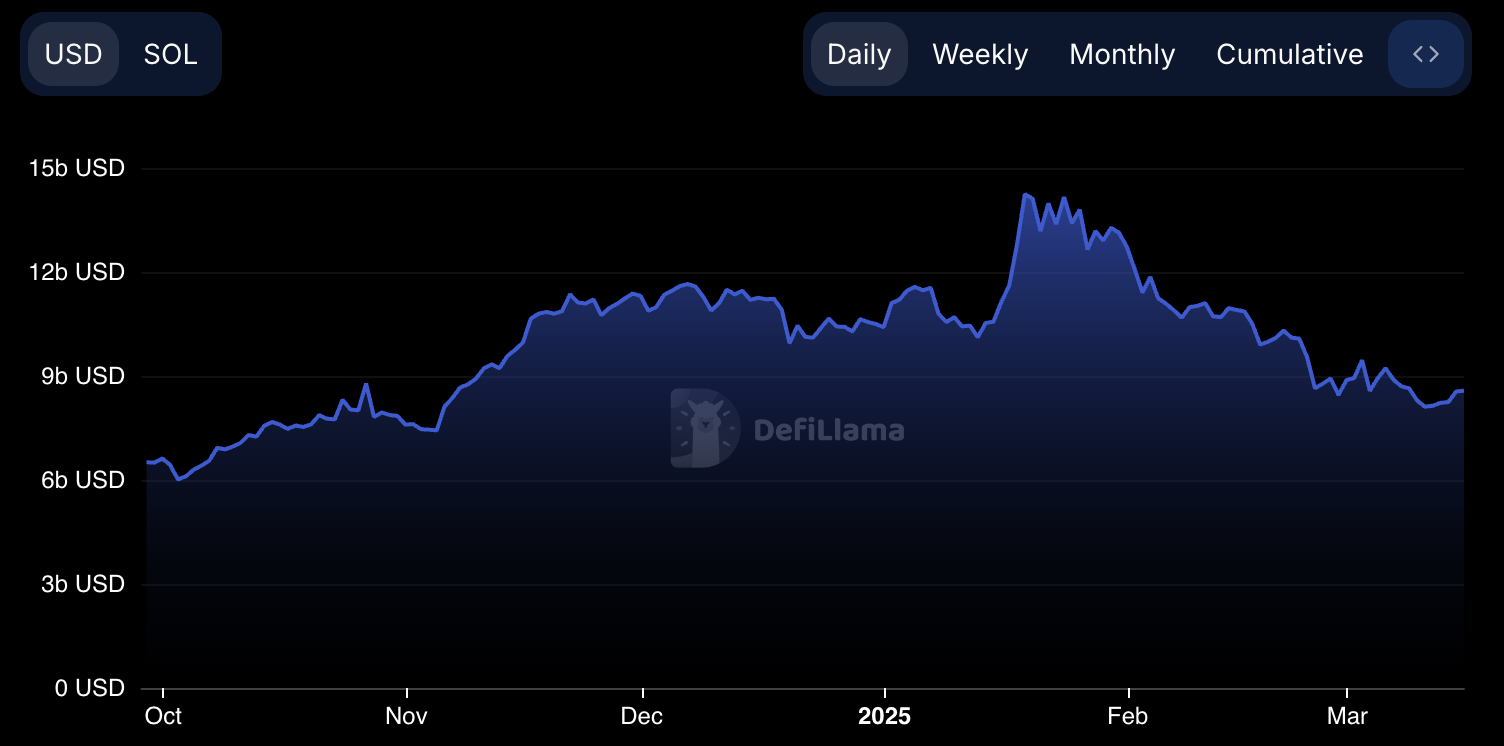
Solana’s Total Value Locked (TVL) is $8.57 billion, having remained below the $10 billion mark since February 23.
This recent trend highlights a period of constrained capital flow into the Solana ecosystem, suggesting that investors and protocols are adopting a more cautious stance.
Despite this, Solana continues to retain a significant share of the decentralized finance (DeFi) market, but the sub-$10 billion range reflects broader market sentiment and risk appetite within the ecosystem.
TVL, or Total Value Locked, measures the amount of capital deposited across a blockchain’s DeFi protocols, including lending, staking, liquidity pools, and other smart contract-based applications.
It is a key metric for gauging the health and activity within a blockchain ecosystem, as higher TVL generally reflects strong user participation, liquidity, and developer confidence.
Solana’s TVL reached an all-time high of $14.24 billion on January 18 but has since been in a steady decline, mirroring a more cautious market posture.
While TVL remains relatively low, it has shown signs of stabilization and a slight recovery, bouncing from a recent low of $8.11 billion on March 10 to its current level, signaling a potential shift in market sentiment.
Whales Are Buying SOL Again
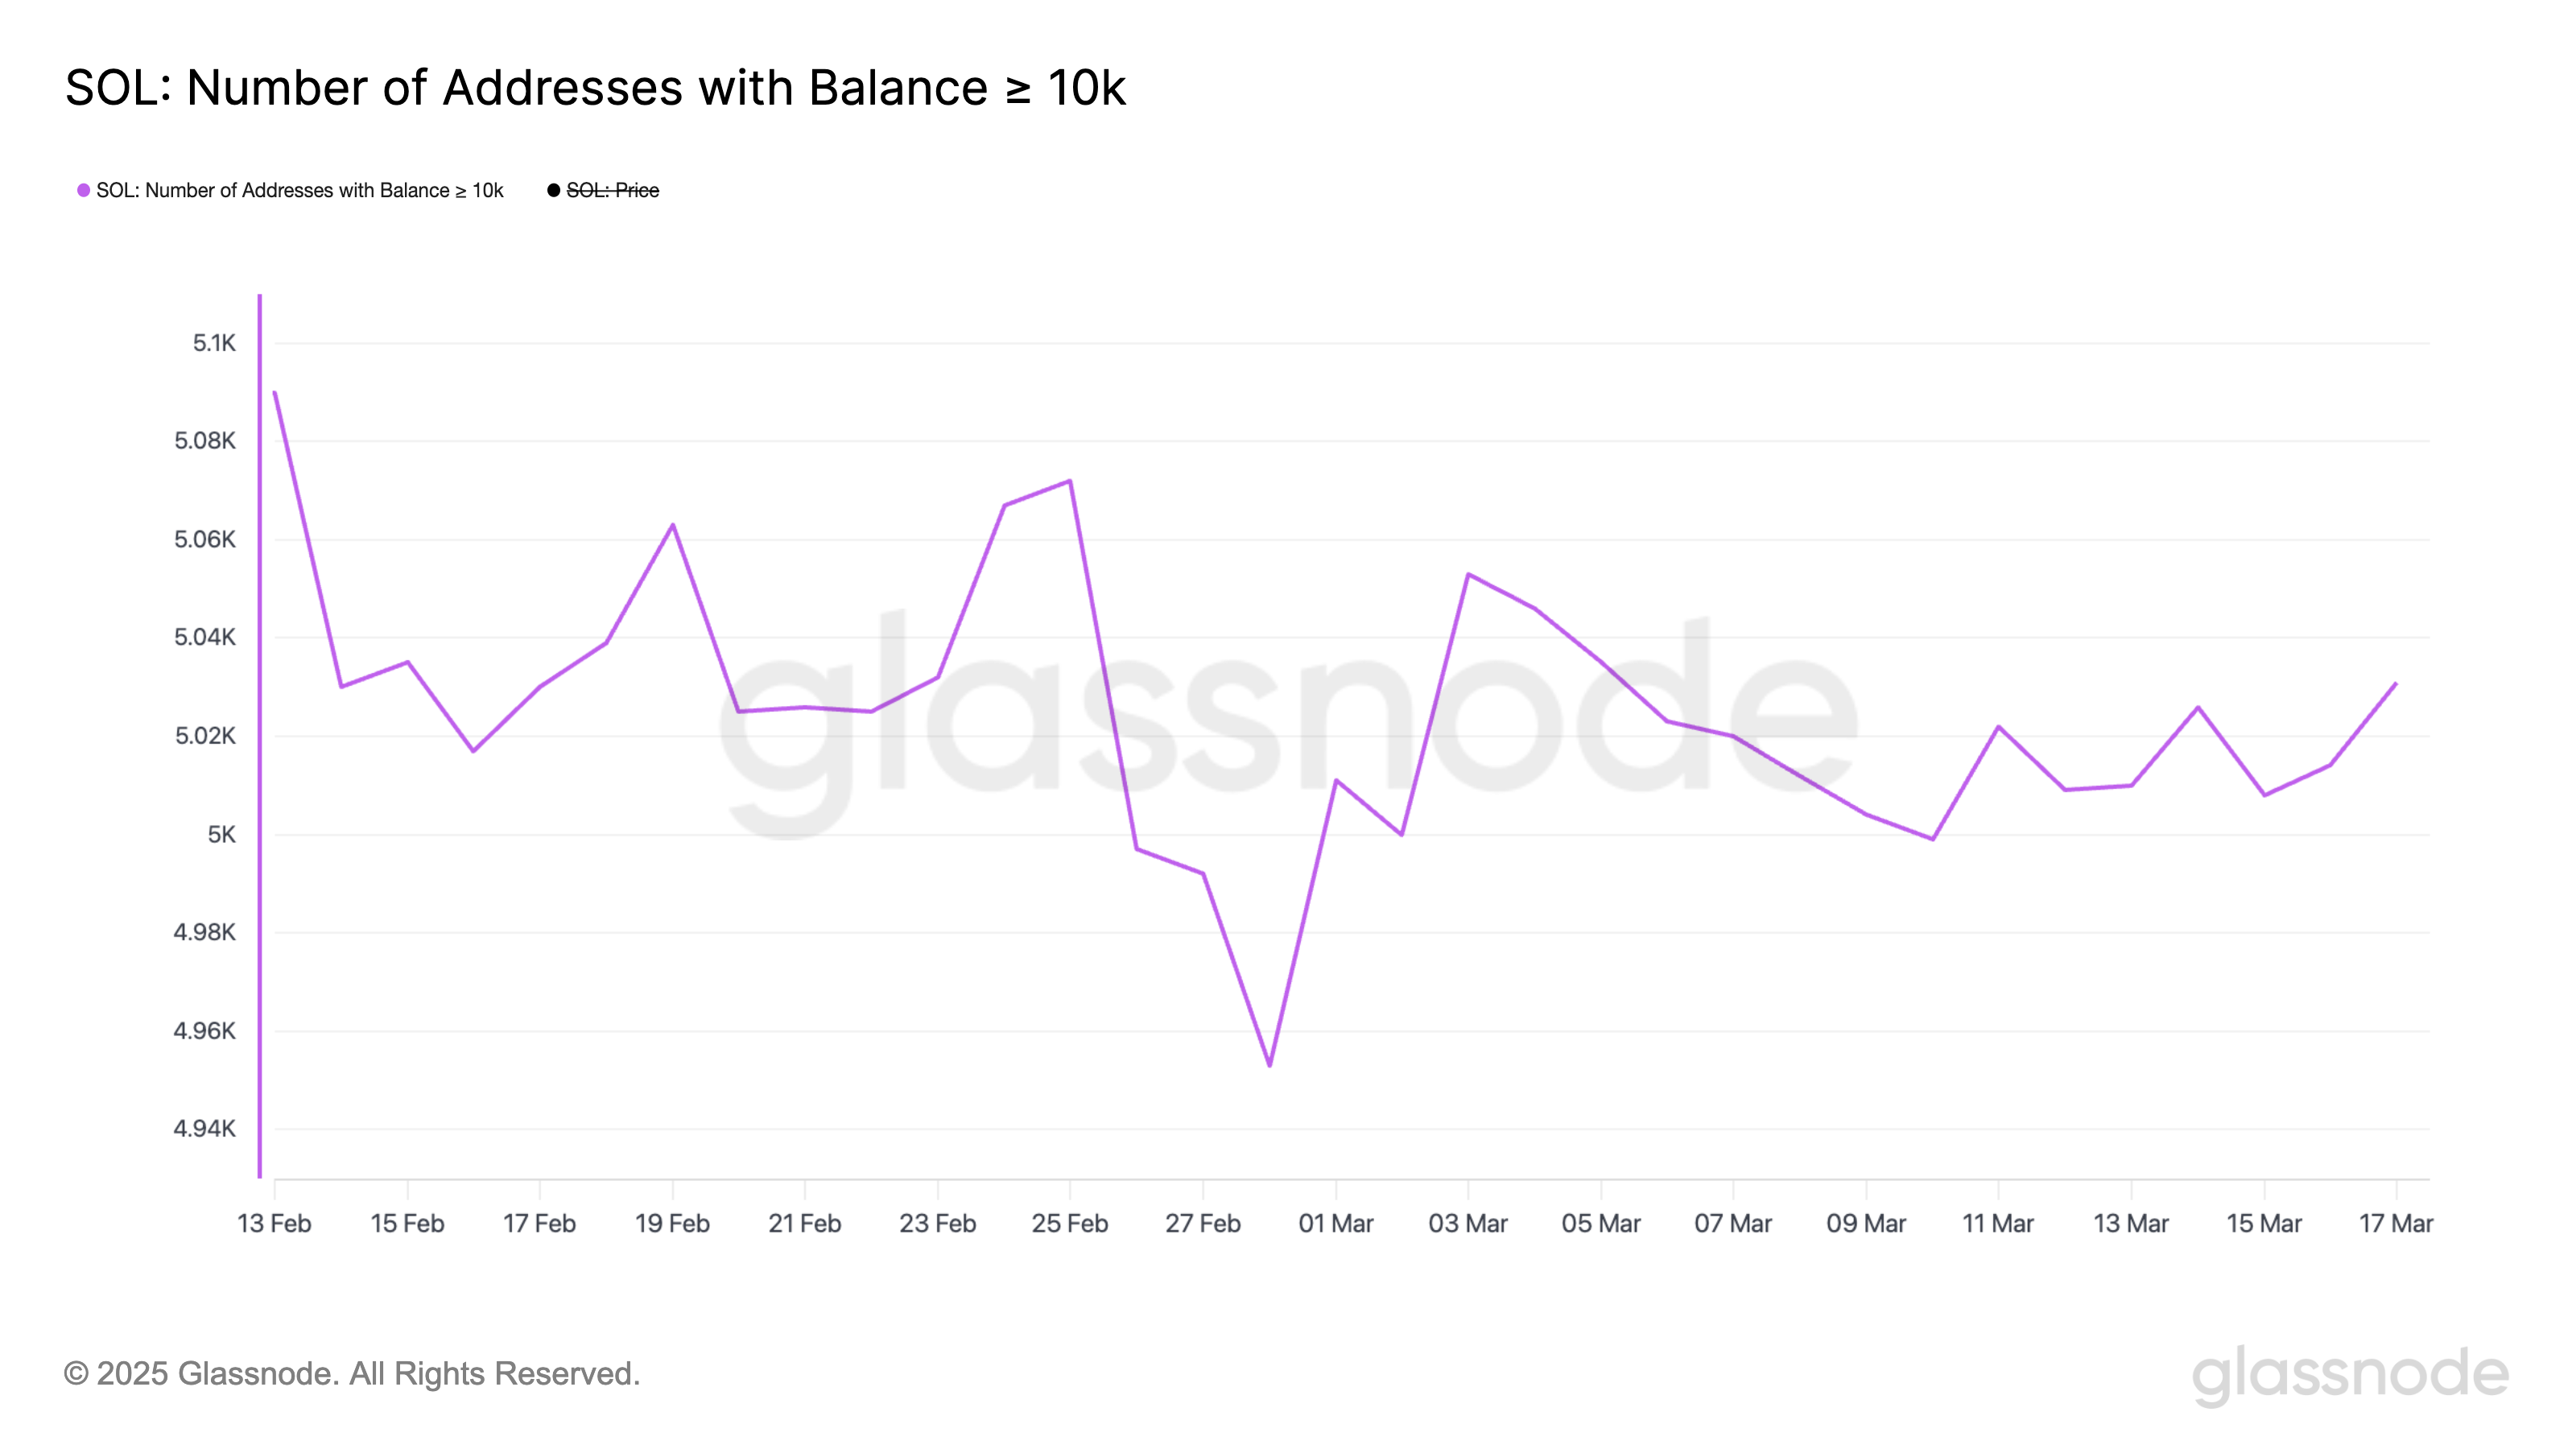
The number of Solana whales – addresses holding at least 10,000 SOL – is currently at 5,031, a slight increase from 5,008 just two days ago.
However, this figure remains below the 5,053 level observed on March 3, suggesting that while some accumulation is happening, the whale count has yet to recover from its recent highs fully.
This fluctuation in large holders indicates a market still in transition as key players reassess their positions within the Solana ecosystem.
Monitoring the number of whales is crucial because these large holders often have the ability to influence the market through significant buying or selling activity.
A rising whale count can signal increased confidence among sophisticated investors, potentially leading to more price stability or upward momentum. With the current whale figure climbing to 5,031, this modest uptick could be an early sign of renewed interest from major players, supporting the idea of gradual accumulation.
However, the number remaining below recent peaks suggests that while sentiment may be improving, some larger investors are still cautious, which could limit immediate upside pressure on SOL’s price.
Can Solana Fall To $112 Soon?
Solana price is currently trading within a range, finding support at $120.76 and facing resistance at $131.
With the market showing signs of a downtrend, there is a risk that SOL could retest the $120.76 support level.
Should this level fail to hold, the price could potentially decline further toward the next key support at $112, signaling a deeper correction within the current bearish momentum.
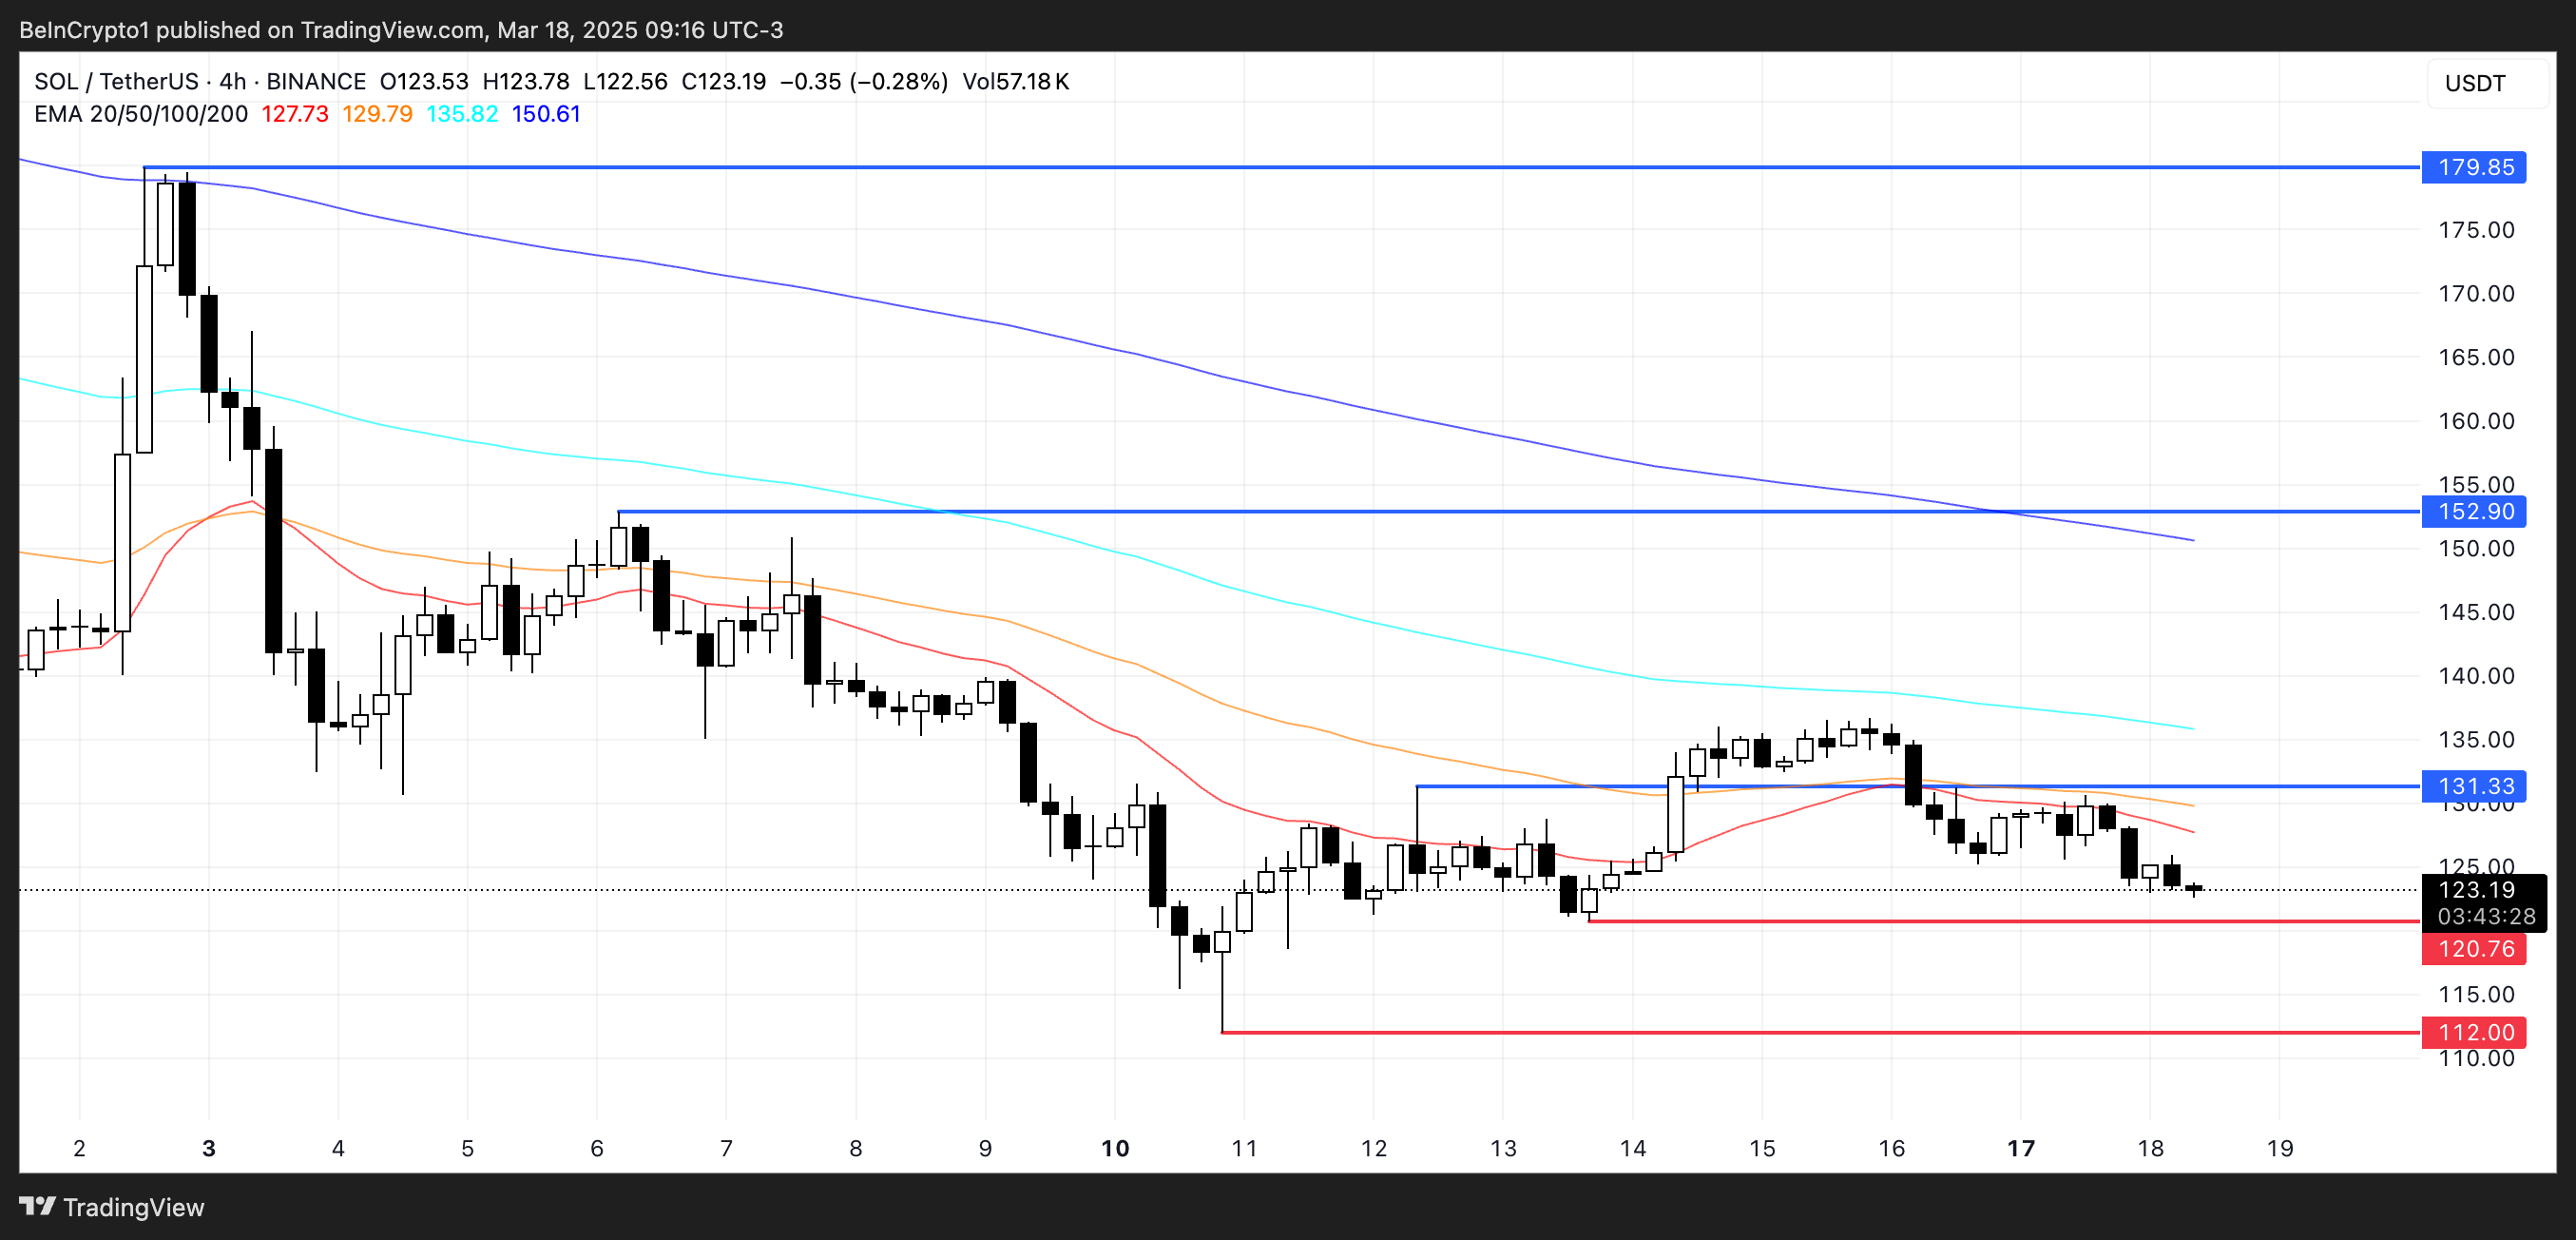
However, if SOL manages to regain positive momentum, it could challenge the immediate resistance at $131.
A successful breakout above this level could open the door for a move toward $152.9, with a further push to $179.85 if bullish sentiment strengthens significantly.
The current consolidation between $120.76 and $131 will be critical in determining whether SOL continues its downward pressure or transitions into a sustained uptrend.
Disclaimer
In line with the Trust Project guidelines, this price analysis article is for informational purposes only and should not be considered financial or investment advice. BeInCrypto is committed to accurate, unbiased reporting, but market conditions are subject to change without notice. Always conduct your own research and consult with a professional before making any financial decisions. Please note that our Terms and Conditions, Privacy Policy, and Disclaimers have been updated.

Ethereum (ETH) has been struggling, down nearly 30% over the past 30 days as bearish sentiment continues to weigh on the asset. Over the last week, ETH has remained stuck below the $2,000 mark, unable to regain key resistance levels.
While some indicators, like BBTrend, are showing early signs of stabilization, whale activity points to cautious behavior among large investors. As Ethereum trades near critical support zones, the market is watching closely to see if the downtrend will deepen or if bulls can stage a meaningful recovery.
BBTrend Is Now Positive After 6 Days, But Still At Modest Levels
Ethereum’s BBTrend indicator is currently sitting at 0.22, having just turned positive after spending six consecutive days in negative territory.
During that stretch, it reached a negative peak of -17.68 on March 13, reflecting strong bearish momentum.
This shift marks a potential early sign of stabilization for Ethereum. The indicator has crossed back above zero, signaling that sellers may be losing control in the short term, as Ethereum network activity recently hit yearly lows.
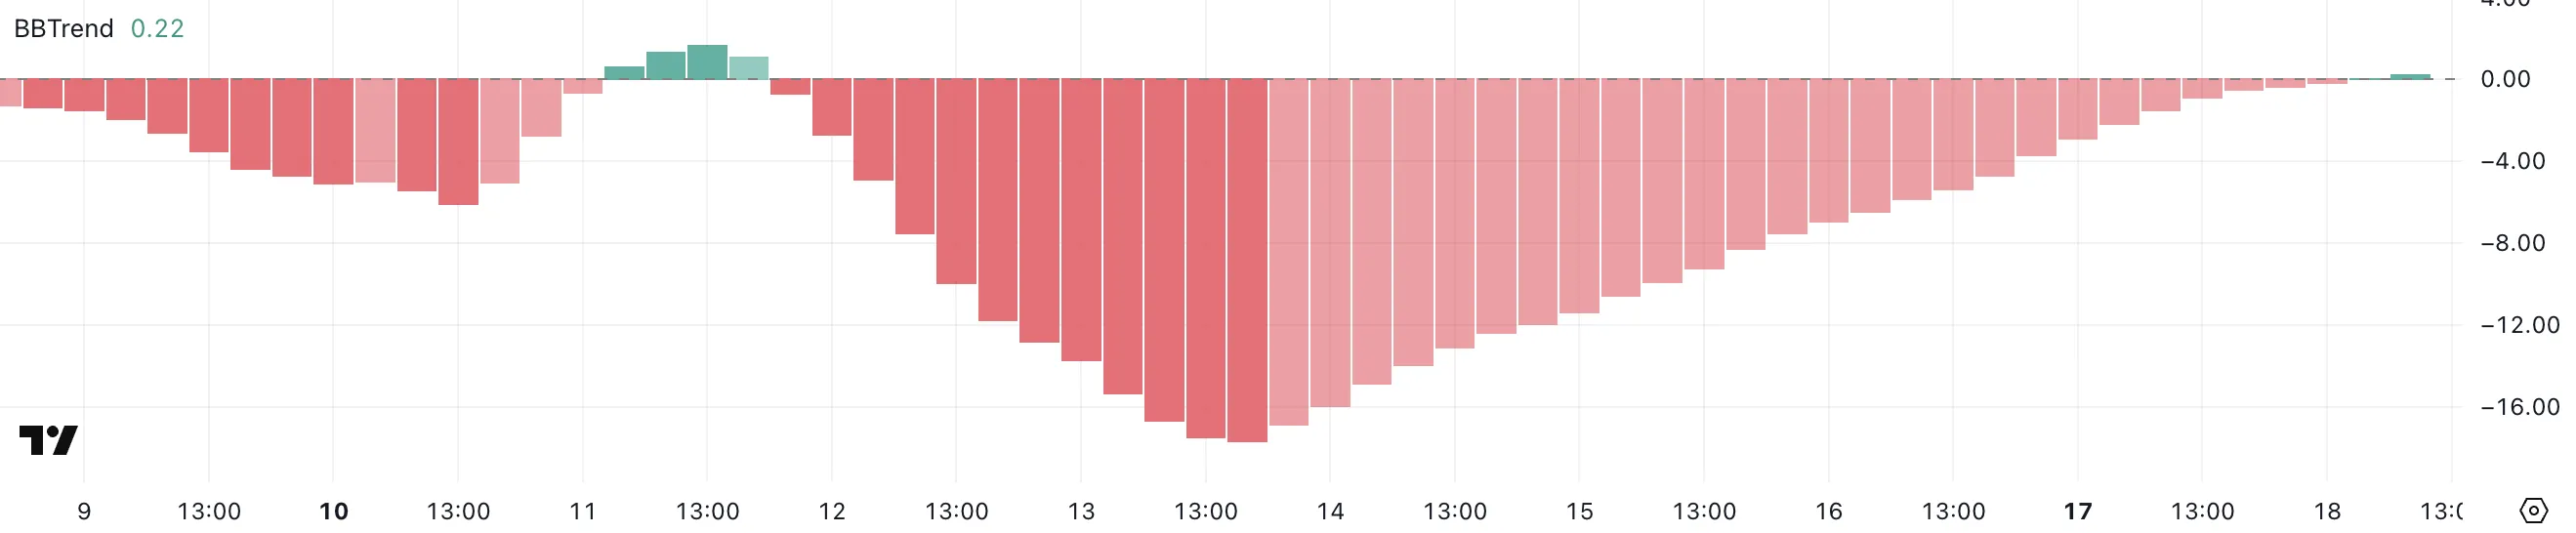
BBTrend, or Bollinger Band Trend, is a momentum-based indicator that measures the strength and direction of a price trend relative to its Bollinger Bands. Readings below 0 typically suggest bearish conditions, while readings above 0 indicate bullish momentum.
Thresholds around -10 or +10 often highlight periods of stronger trend conviction. Ethereum’s BBTrend is now back in positive territory after a prolonged bearish phase, suggesting that downward pressure is easing.
However, at just 0.22, the indicator is still at low levels, signaling that while the sell-off might be cooling, the market has yet to transition into a strong bullish trend fully.
Whales Are Not Accumulating Ethereum
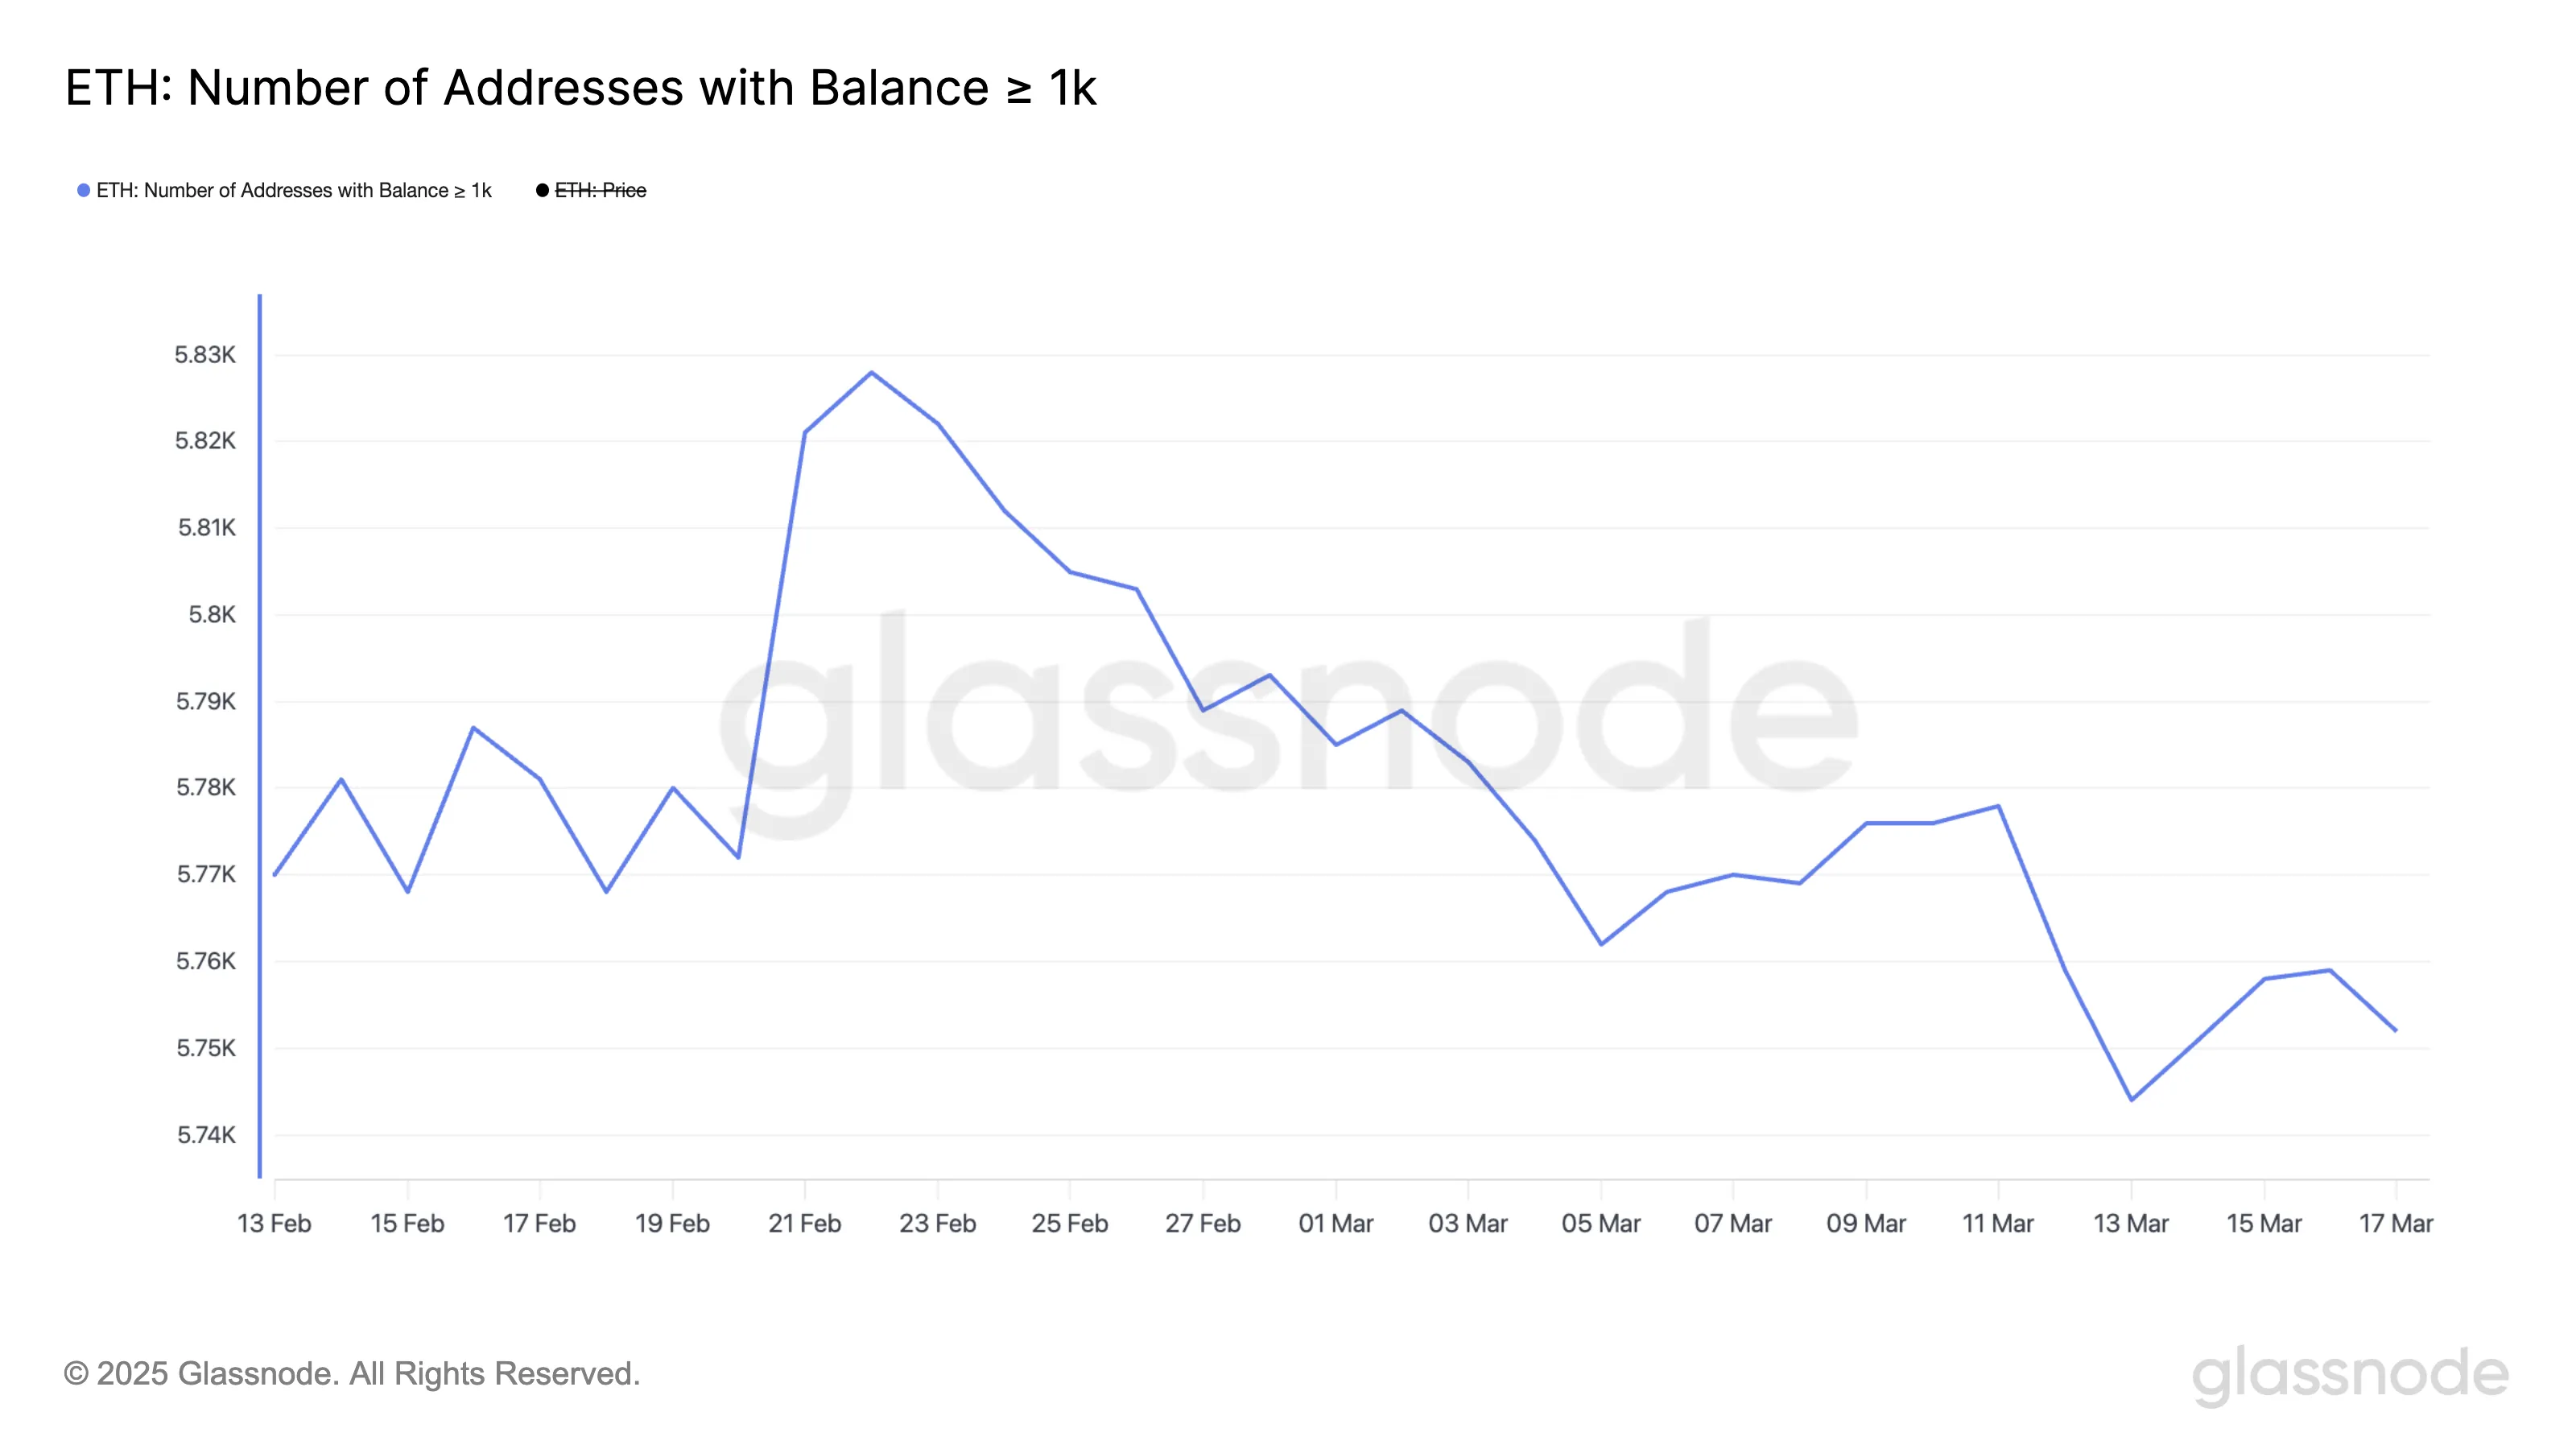
The number of Ethereum whales—wallets holding at least 1,000 ETH—has been steadily declining since February 22, after peaking at 5,828 addresses.
The current number of Ethereum whales stands at 5,752, despite a modest attempt at a rebound in recent days, with Ethereum market dominance hitting its lowest levels since 2020.
This gradual reduction in large holders points to a cautious approach among key players. Some whales are reducing their exposure or taking profits as Ethereum’s price action remains mixed.
Tracking whale behavior is crucial because these large addresses often act as market movers, capable of influencing price trends through their buying or selling activity.
A steady decline in Ethereum whale numbers may suggest waning confidence or a shift toward risk-off sentiment among institutional or high-net-worth investors.
This downward trend in whale accumulation could limit the strength of any potential rallies, as fewer large players are positioned to provide strong buying support in the short term.
Will Ethereum Fall Below $1,700 In March?
Ethereum has been under pressure, trading below the $2,000 mark for the past seven days. Sellers have kept the asset pinned beneath key resistance levels.
The current support stands at $1,823, and if this level is tested and broken, Ethereum could decline further toward $1,759 and potentially fall below $1,700 for the first time since October 2023, despite some experts defending its future echoes early Amazon and Microsoft.
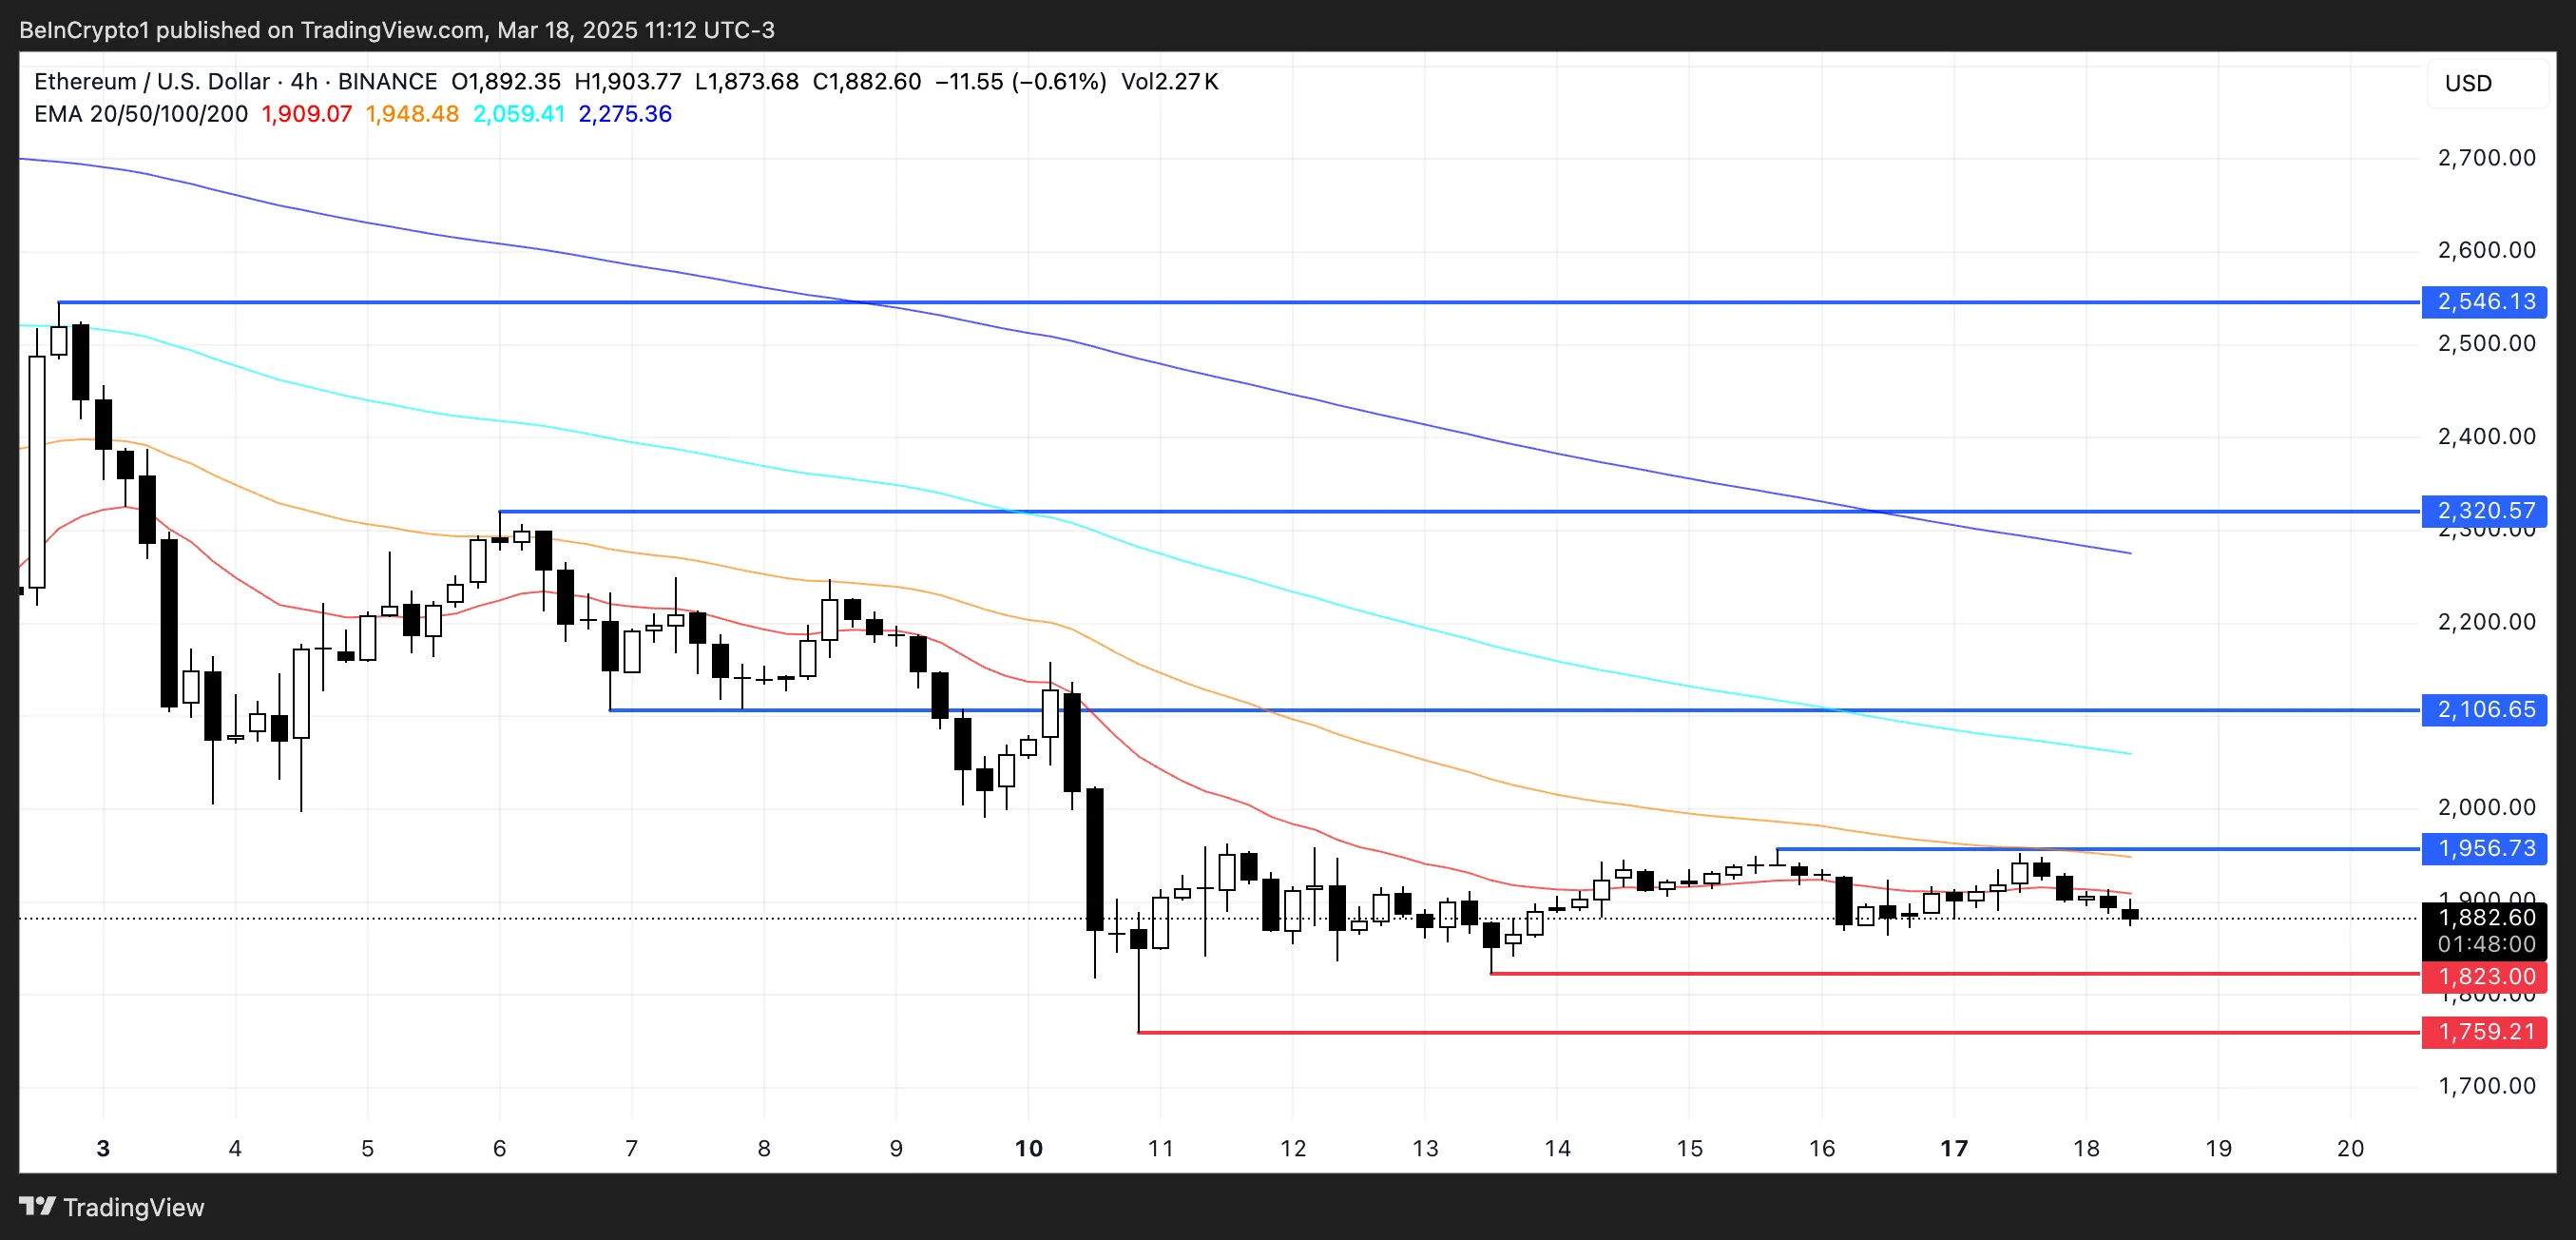
However, if Ethereum’s price manages to stabilize and build an uptrend, it could challenge the immediate resistance at $1,956.
A breakout above this level may open the path for a rally toward $2,106, with further bullish momentum potentially pushing ETH to retest $2,320 and even $2,546.
A break above $2,500 would mark the first time Ethereum reclaims that level since March 2, signaling a notable shift in market confidence and buyer strength.
Disclaimer
In line with the Trust Project guidelines, this price analysis article is for informational purposes only and should not be considered financial or investment advice. BeInCrypto is committed to accurate, unbiased reporting, but market conditions are subject to change without notice. Always conduct your own research and consult with a professional before making any financial decisions. Please note that our Terms and Conditions, Privacy Policy, and Disclaimers have been updated.

Coinbase Launches Verified Pools for Retail Users

Schiff Predicts A Catastrophic 85% BTC Drop—Details

Ethereum Price: Analyst Predicts ‘Most Hated Rally In Crypto’

Solana Risks Falling to $120 Amid Weak TVL and Whale Activity

Bullish Breakout On The Ethereum 4-Hour Chart Says Price Is Headed For $2,500
Ethereum Risks Falling To $1,700 as Number of Whales Decline

2.52 Million Altcoins Are Ruining Crypto’s Future

Animoca Brands Valuation Tanks 75% In Two Years, Here’s Why

Crypto exchange BingX hacked for $43 million

Are The Big Players Losing Interest?

Hong Kong’s Securities Association Tips Authorities On Crypto Self-Regulation
Coinbase cbBTC Set to go Live on Solana
2.52 Million Altcoins Are Ruining Crypto’s Future
Animoca Brands Valuation Tanks 75% In Two Years, Here’s Why
Crypto exchange BingX hacked for $43 million
Are The Big Players Losing Interest?
Hong Kong’s Securities Association Tips Authorities On Crypto Self-Regulation
Coinbase cbBTC Set to go Live on Solana
-
 Market23 hours ago
Pi Network (PI) Risks Falling Below $1 As Bears Take Control
-
 Altcoin23 hours ago
Mubarak Meme Coin Trader Turns $232 Into $1.1 Million, Here’s How
-
 Market22 hours ago
Critical Exploit Hits BNB Chain’s four.meme: SlowMist Raises Alarm
-

 Market19 hours ago
Crypto.com Reverses 2021 Token Burn, Re-Mints 70B CRO
-

 Market21 hours ago
BSC DEX Volume Surpassed Solana Thanks to Meme coins
-
 Altcoin21 hours ago
Here’s Why Pi Coin Is Falling
-

 Market20 hours ago
Binance Alpha Listing and CZ Spark 200% Rally In MUBARAK Coin
-
 Altcoin20 hours ago
Pepe Coin Price Eyes 40X Breakout Amid Bull Run, Here’s All