
Market
Onyxcoin (XCN) Price Signals a Potential Rebound After 45% Drop

Onyxcoin (XCN) is down over 45% in the last 30 days, following a historic surge at the end of January. After being one of the most trending altcoins earlier this year, XCN is now showing signs of cooling off.
Both momentum and trend indicators point to weakening bearish pressure, suggesting that a shift could be forming. Here’s a look at the technical outlook and what could come next for Onyxcoin.
XCN RSI Has Been Neutral For One Week
Onyxcoin’s RSI is currently at 41.7, down from a peak of 55.6 three days ago.
The RSI has remained in a neutral zone for the past week, fluctuating between 41 and 55, without showing a strong bullish or bearish trend.
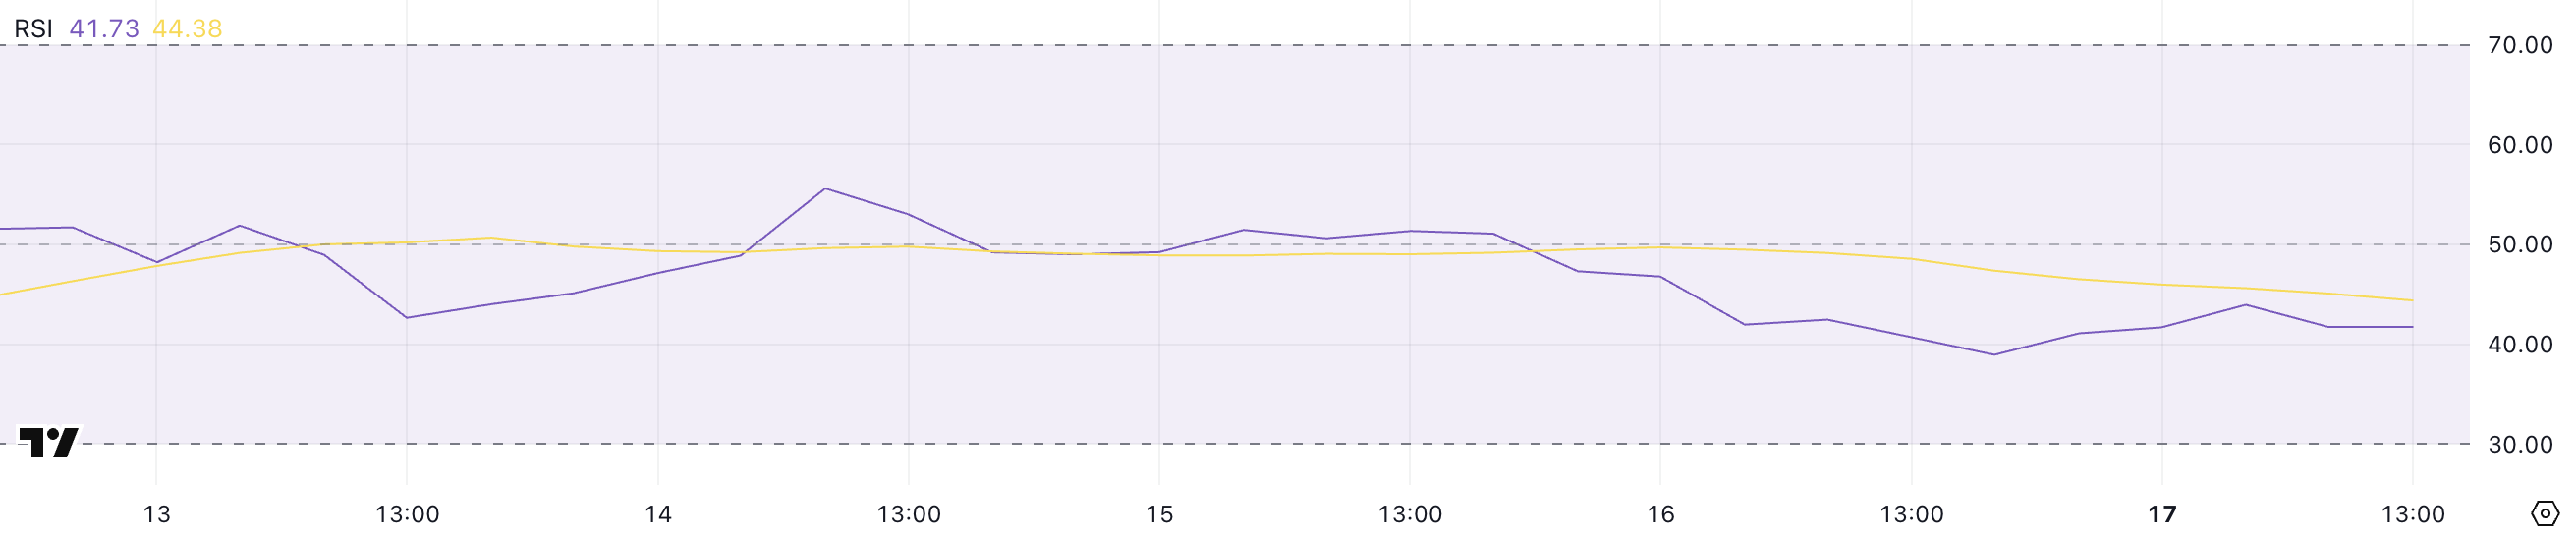
The Relative Strength Index (RSI) is a momentum oscillator that measures the speed and change of price movements, ranging from 0 to 100.
Readings above 70 typically indicate overbought conditions, while readings below 30 suggest oversold conditions. With XCN’s RSI now at 41.7, it suggests mild bearish pressure but not enough to confirm an oversold market.
This could indicate that XCN is in a consolidation phase, and traders may be waiting for a stronger directional signal before committing to a trend.
Onyxcoin ADX Shows The Current Downtrend Is Fading Away
Onyxcoin’s ADX is currently at 8.33, dropping from 14.7 just two days ago.
This sharp decline signals a further weakening of trend strength as the token remains in a downtrend but with reduced momentum behind the move.
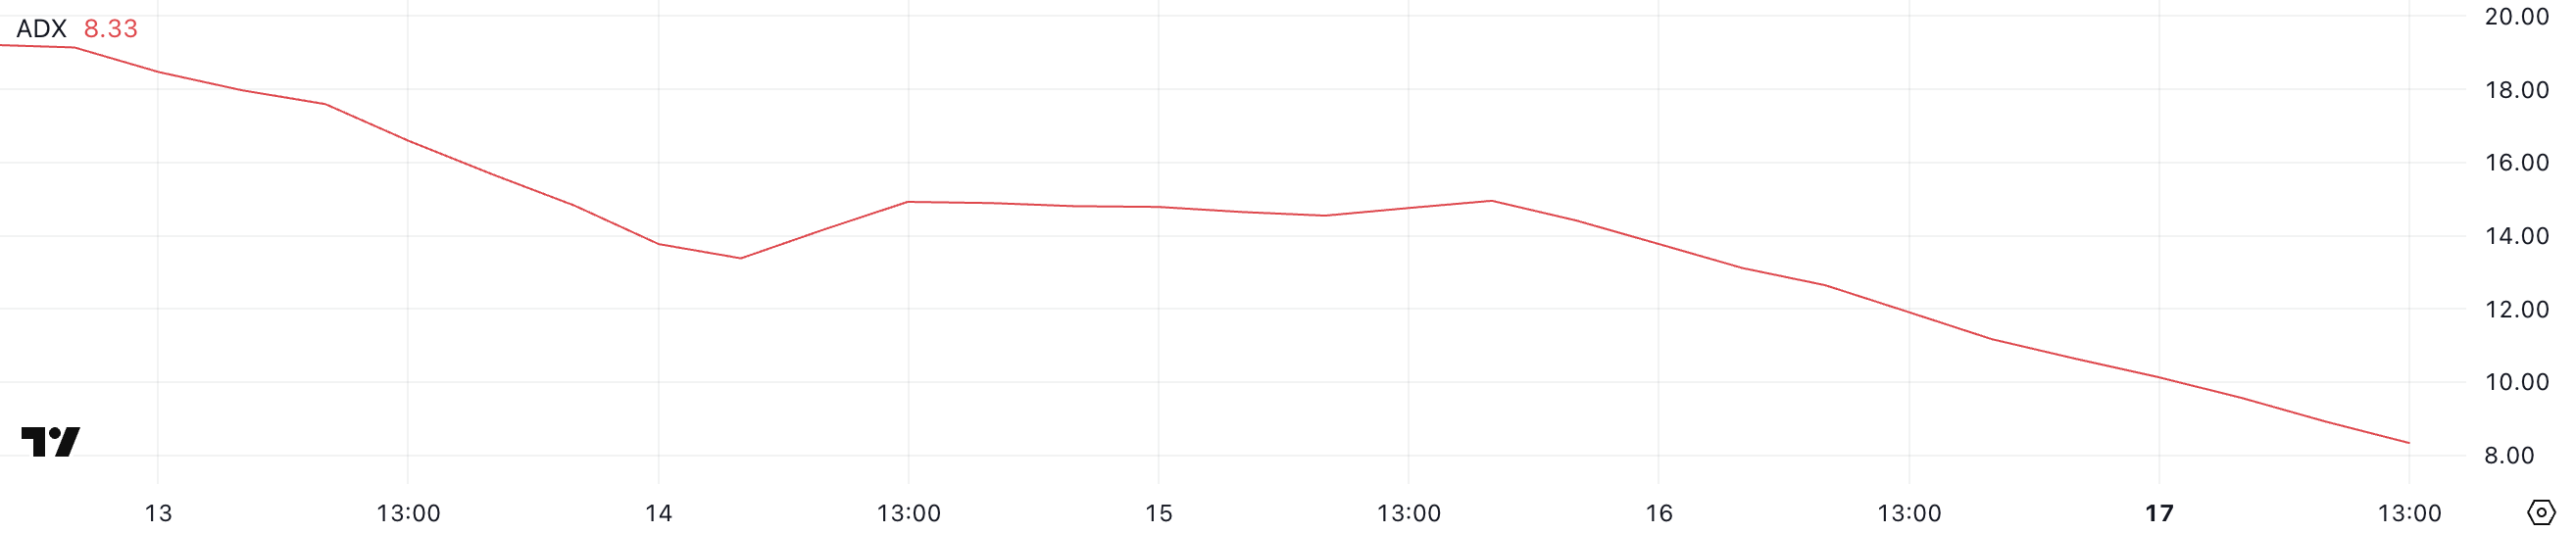
The Average Directional Index (ADX) measures the strength of a trend, regardless of its direction. Values above 25 indicate a strong trend, and values below 20 point to a weak or non-trending market.
With XCN’s ADX now at 8.33, this suggests that the ongoing downtrend is losing steam. The price could remain range-bound or experience smaller movements until momentum returns.
Without a pickup in ADX, traders may see continued sideways or choppy price action in the short term.
Will Onyxcoin Reclaim $0.020 In March?
Despite being one of the most trending altcoins in 2025, Onyxcoin price has corrected by 42% over the past 30 days.
If this downtrend continues, XCN could retest the key support at $0.01. A breakdown below this level would mark the first time the token has fallen below $0.01 since January 17, before its major surge earlier this year.
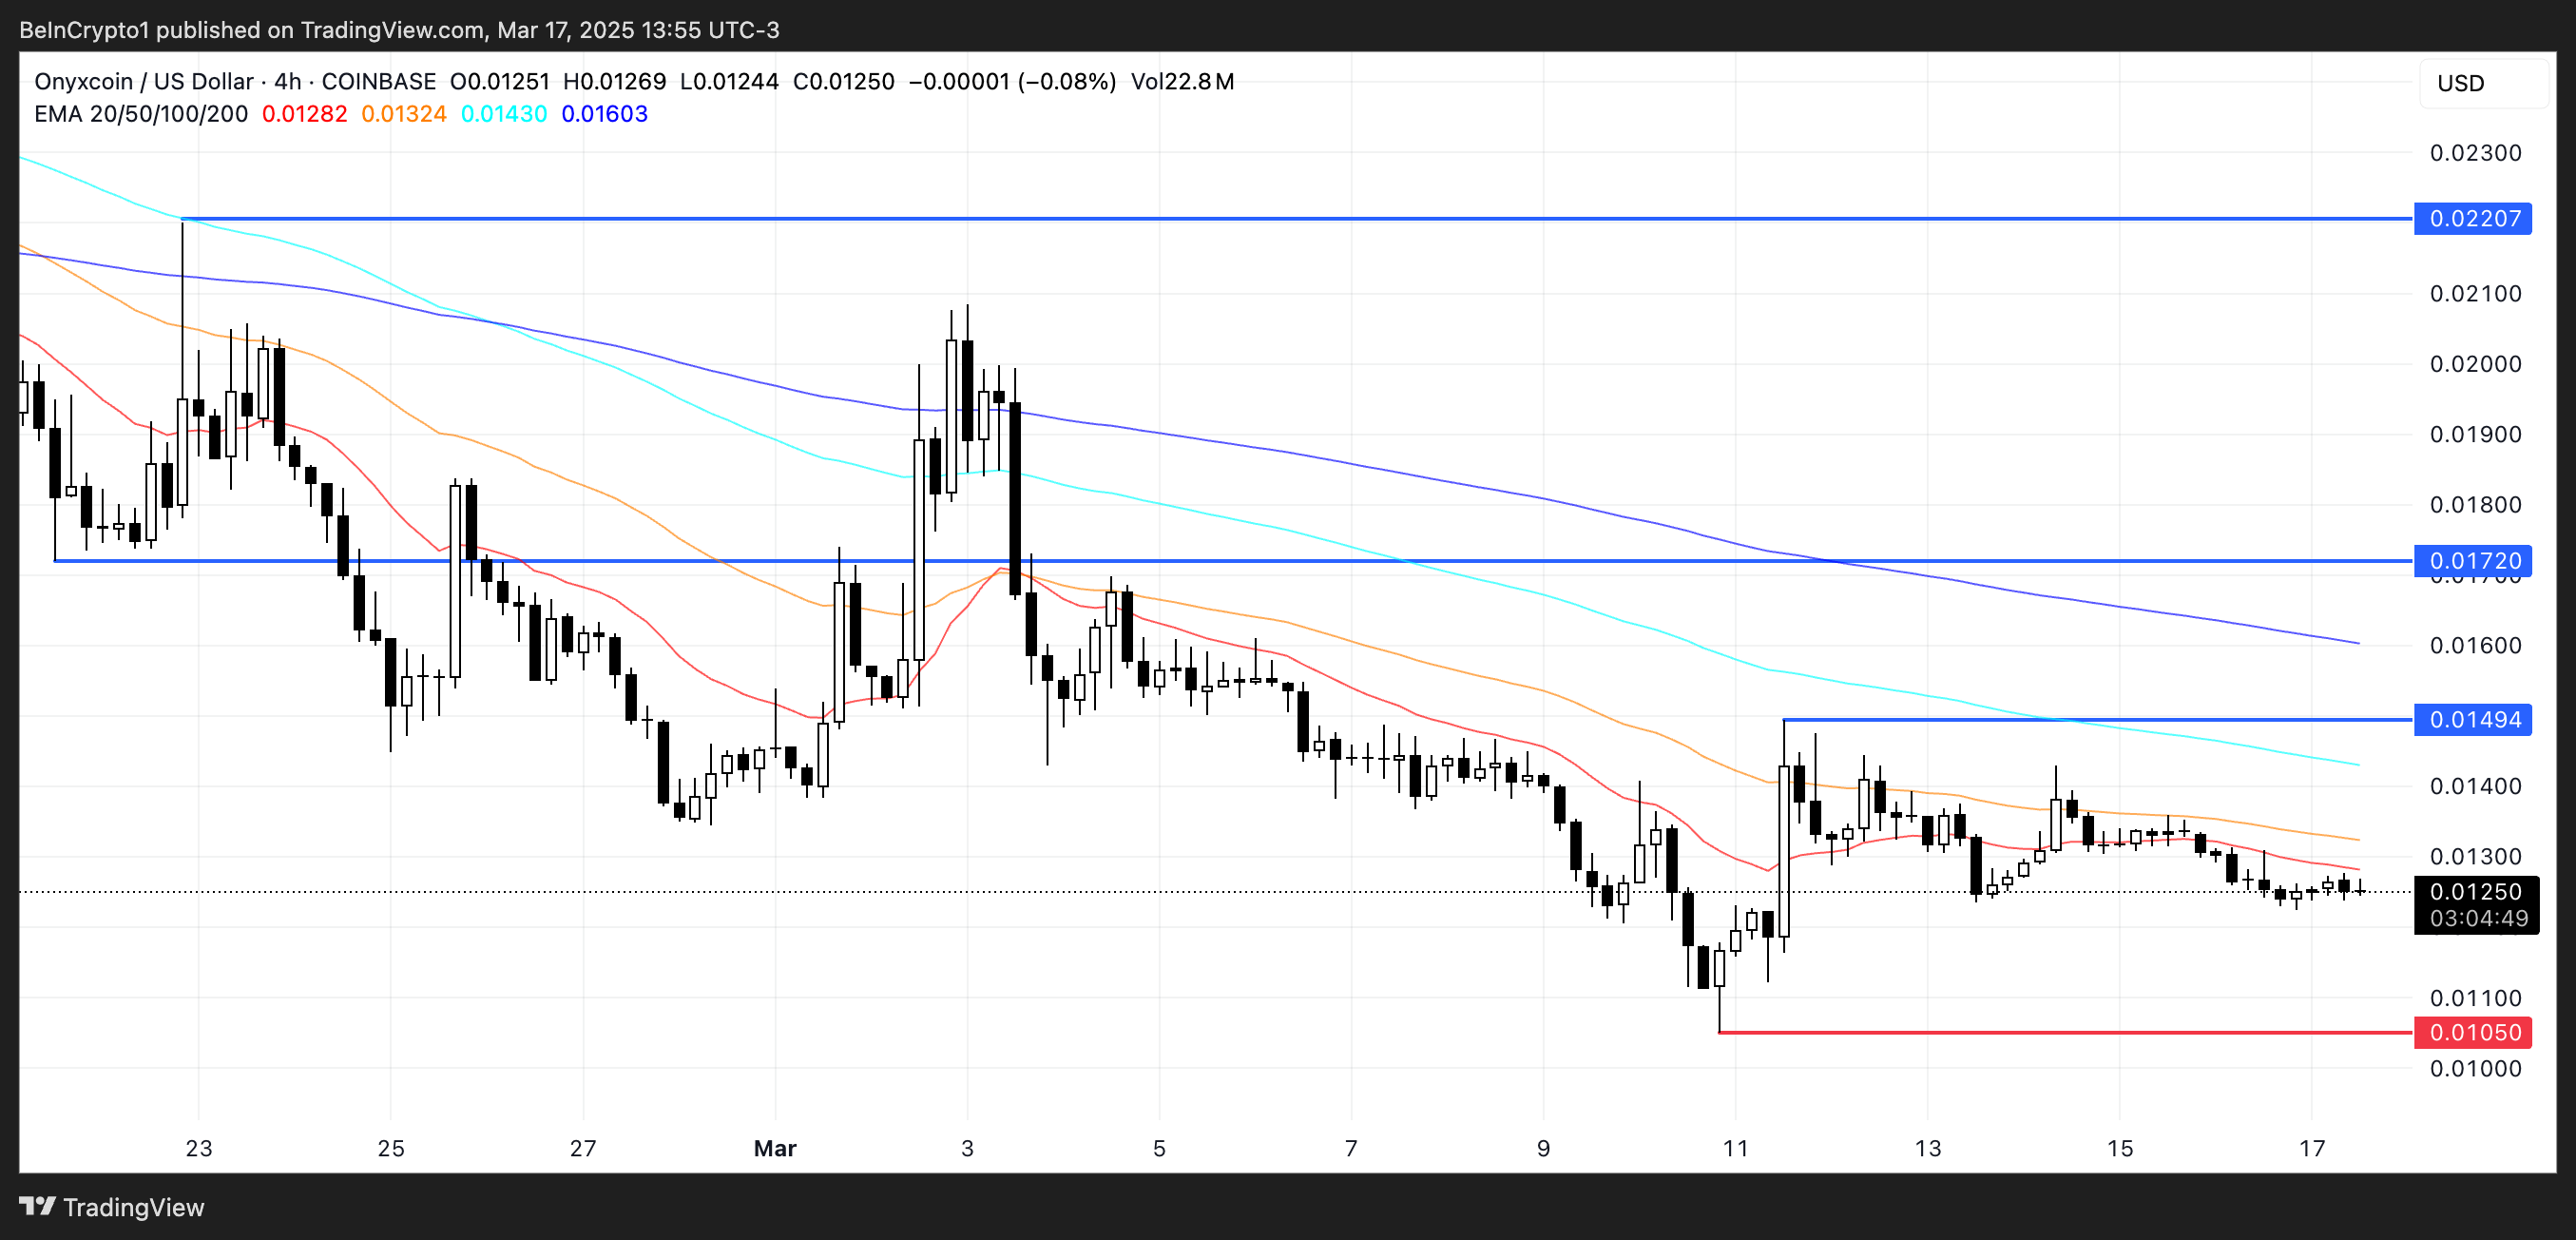
However, as indicated by the weakening ADX, the current downtrend is losing strength, potentially opening the door for a rebound.
If Onyxcoin regains momentum, it could challenge the resistance at $0.0149, and a breakout could push the price toward $0.017. Should Onyxcoin recover its strong bullish trend from late January, it could rise as high as $0.022, breaking above $0.02 for the first time since March 3.
Disclaimer
In line with the Trust Project guidelines, this price analysis article is for informational purposes only and should not be considered financial or investment advice. BeInCrypto is committed to accurate, unbiased reporting, but market conditions are subject to change without notice. Always conduct your own research and consult with a professional before making any financial decisions. Please note that our Terms and Conditions, Privacy Policy, and Disclaimers have been updated.


New York-based legal firm Burwick Law filed a class action lawsuit against the main parties involved in LIBRA, the Argentinian meme coin scandal. The lawsuit specifically targets KIP, Meteora, and Kelsier, but not President Javier Milei.
Over the past few months, the firm has filed several lawsuits against meme coin projects. It alleges serious financial misconduct from all these parties.
A LIBRA Lawsuit in New York
Given the firm’s recent actions, Burwick Law seems to be in a legal war against meme coin scammers. In December, it filed a suit against Hawk Tuah’s promoters. A month later, it sued Pump.fun, accusing the platform of IP violations.
Yesterday, Burwick filed another class-action lawsuit, this time centered around the LIBRA meme coin.
“Tonight, our firm filed a class action complaint in the Supreme Court of New York on behalf of our client. We allege that Kelsier, KIP, Meteora, and related parties orchestrated an unfair token launch (LIBRA), allegedly misleading purchasers and harming retail investors,” the firm claimed via social media.
The LIBRA launch in February turned into a massive fiasco, and this lawsuit joins active investigations and arrest warrants levied upon the principal actors.
Essentially, Burwick accuses several parties involved with LIBRA of “deceptive, manipulative, and fundamentally unfair” conduct. These people artificially inflated the token’s price and then caused a collapse—otherwise known as pump-and-dump.
Surprisingly, the suit does not name Argentine President Javier Milei as a defendant. In addition to being a significant political figure, Milei also downplayed his direct connections to the debacle.
Instead of targeting him, Burwick’s lawsuit is going after the private companies that directly facilitated the LIBRA launch: KIT, Meteora, and Kelsier.
“The complaint details how, according to our allegations, one-sided liquidity pools were used to artificially inflate LIBRA’s price. We further allege that approximately 85% of supply was withheld at launch, enabling insiders to profit while everyday buyers bore the losses,” Burwick Law stated.
Who Were the Culprits Behind the LIBRA Scandal?
The initial name behind the LIBRA meme coin launch was KIP Protocol, a Web3 AI base layer. However, the firm completely distanced itself from any rug pull allegations.
KIP claimed that it did not launch or profit from LIBRA and that it was only asked “to assist in managing the project’s financing initiative.” The other firms, however, have much clearer connections.
Meteora, a decentralized crypto exchange, was thoroughly involved in LIBRA. The company’s co-founder resigned in the immediate aftermath but maintained his innocence.
Notably, Meteora’s reputation was already damaged by the TRUMP meme coin. This small exchange was the first platform to host the token, which increased its TVL by over 300% in days to over $1.9 billion.
Kelsier Ventures, LIBRA’s market maker, seems especially vulnerable to lawsuits. In a shocking interview, CEO Hayden Davis defended his actions, admitting to past scams and claiming he did nothing out of the ordinary.
Davis was in talks to launch a similar meme coin with the Nigerian government and was recently tied to a Wolf of Wall Street-themed meme coin. It’s no wonder that Davis, of all the names involved with the whole scandal, is the only person with an active arrest warrant against him.
Additionally, data engineer Fernando Molina alleged that these parties tried to launch two other Argentina-centric tokens before LIBRA. A few telltale fingerprints connect it with ARG and MILEI, such as shared wallets, liquidity pools, and timing. Molina suggested that LIBRA’s creators could’ve created these assets as test coins, but isn’t certain.

There are quite a few unanswered questions about the whole LIBRA scandal, and it’s unclear how they’ll play into the lawsuit. Hopefully, investigations can help clear up some of the biggest mysteries.
After all, political meme coin schemes like this can damage the reputation of the whole industry. So, the current lawsuit from Burwick might be in everyone’s best interest.
Disclaimer
In adherence to the Trust Project guidelines, BeInCrypto is committed to unbiased, transparent reporting. This news article aims to provide accurate, timely information. However, readers are advised to verify facts independently and consult with a professional before making any decisions based on this content. Please note that our Terms and Conditions, Privacy Policy, and Disclaimers have been updated.

Smart Money wallets have been aggressively offloading TRUMP, BNKR, and PWEASE in the last seven days, raising red flags for these trending tokens. TRUMP has faced the heaviest pressure, with over $380,000 in net outflows, as its price remains stuck in a sharp downtrend.
BNKR, despite posting strong weekly gains, has also seen large traders liquidating their positions, signaling potential profit-taking. Meanwhile, PWEASE is experiencing similar bearish flows as larger wallets continue to trim exposure despite the recent buzz around the meme coin.
TRUMP
TRUMP has been under significant selling pressure, trading below $18 for the past 30 days, with its price declining by nearly 43% over that period.
This steep correction has coincided with notable smart money activity, as key wallets have been heavily exiting their positions. In the last seven days alone, smart money wallets sold $382,660 worth of TRUMP while only buying $1,240, resulting in a sharp net outflow of $381,420.
This imbalance suggests that larger, more informed investors are losing confidence in TRUMP’s short-term prospects, contributing to the downward momentum.
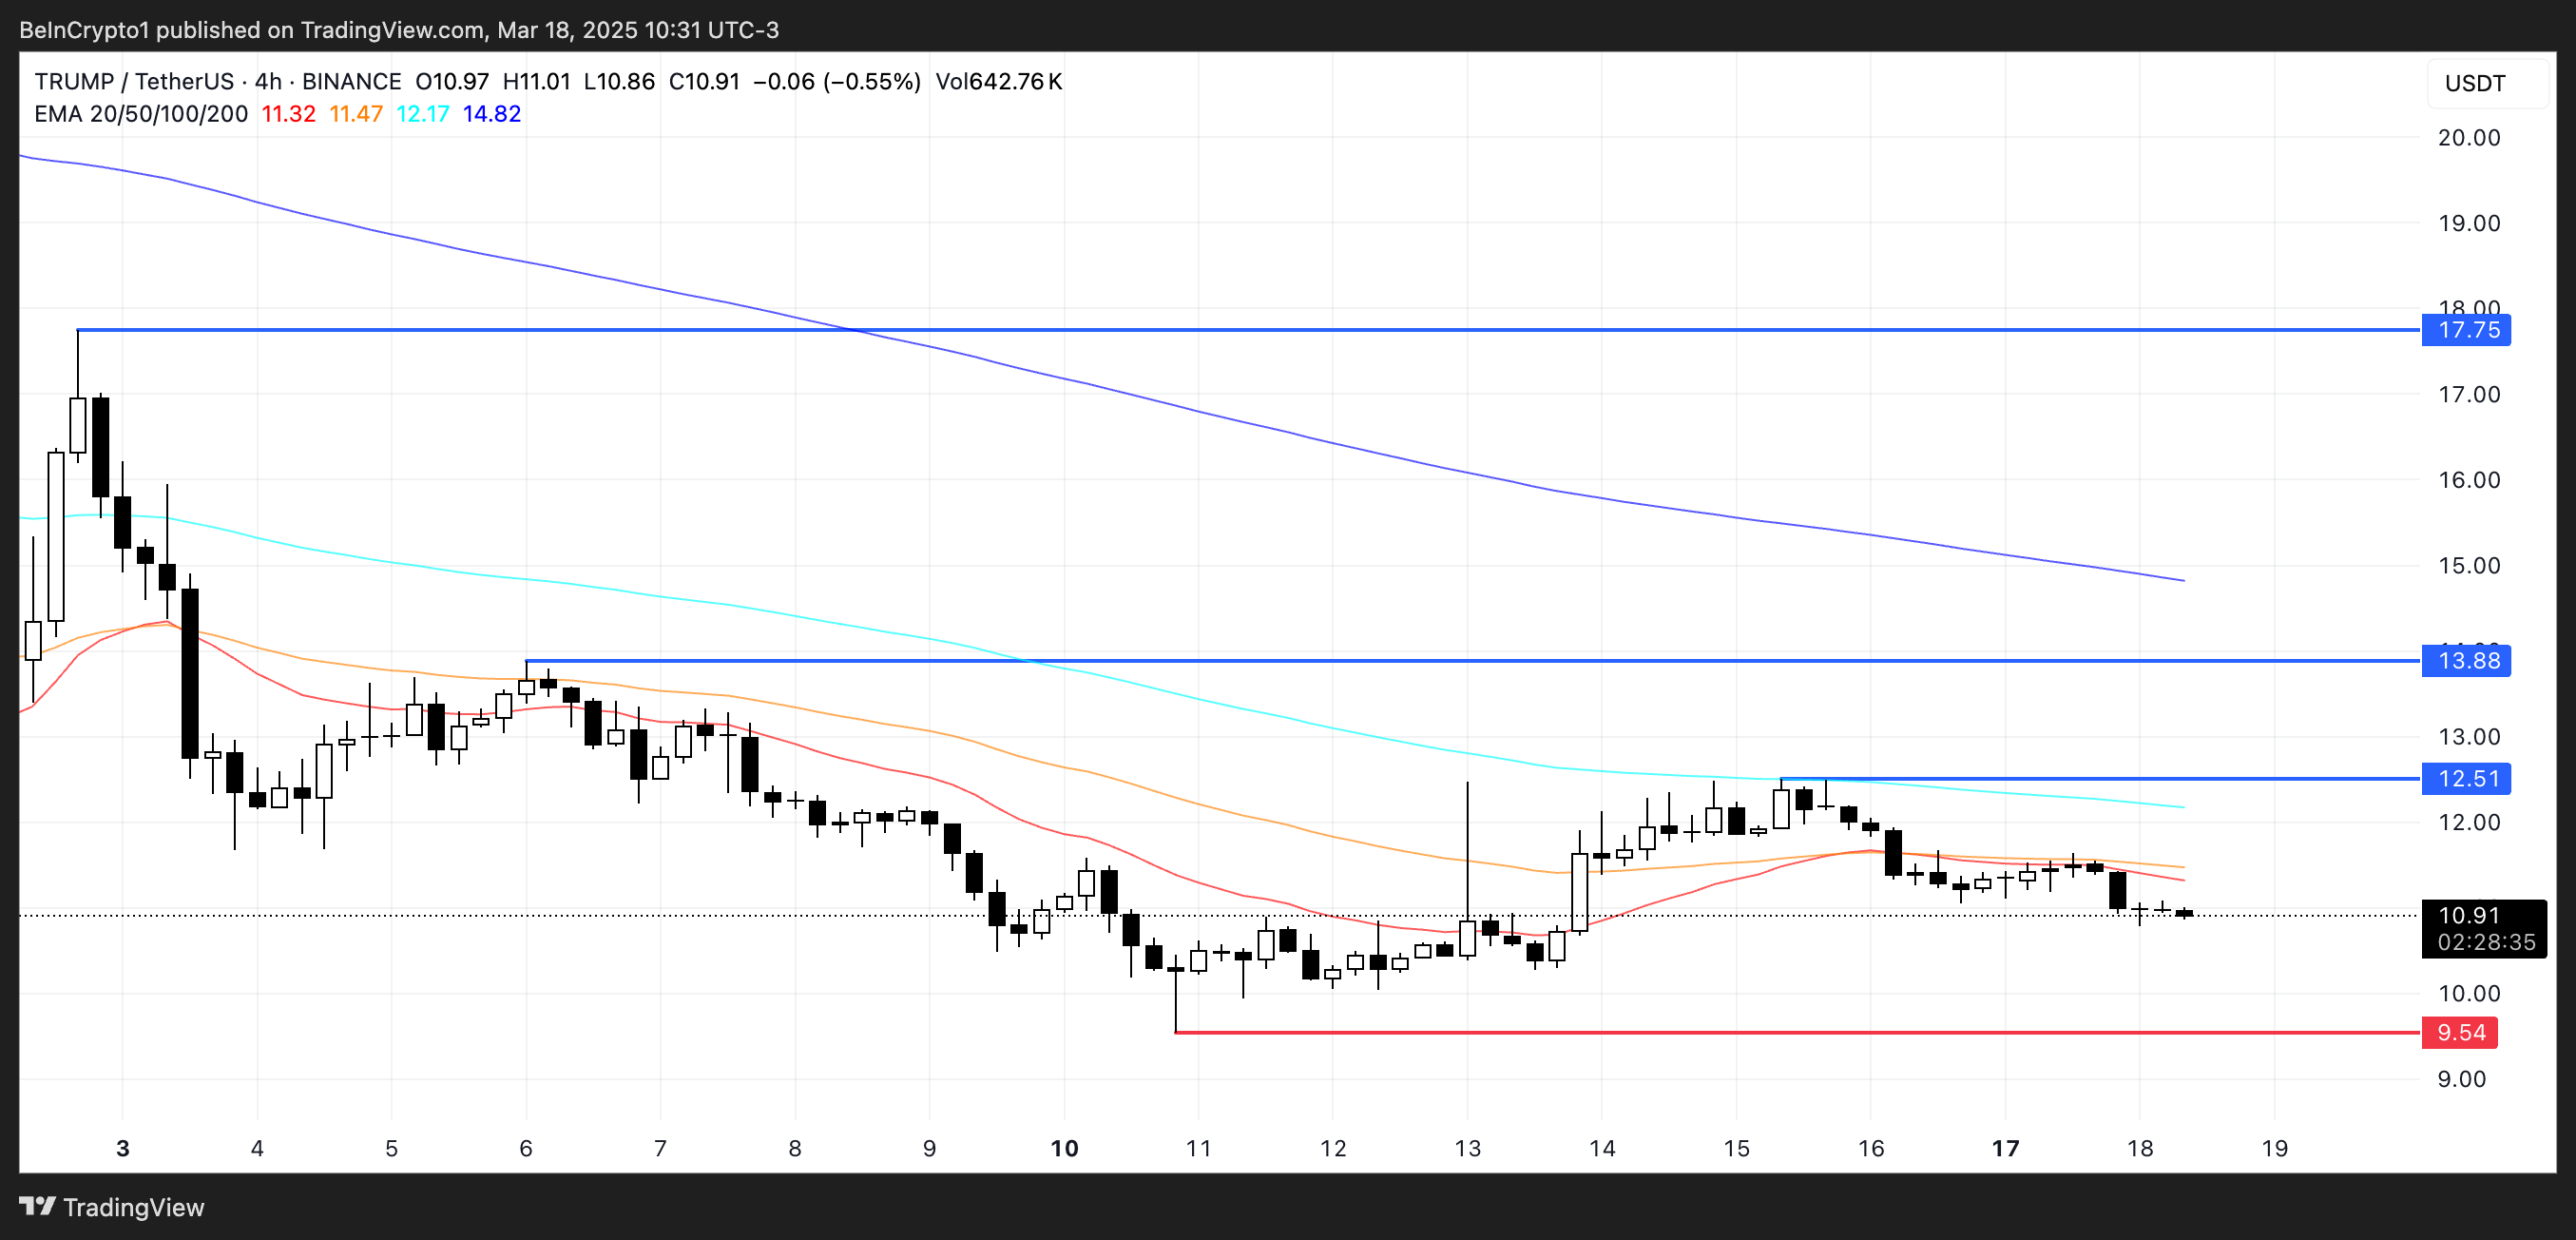
If this corrective trend persists, TRUMP could fall further and retest its next key support level, $9.54. Failure to hold this level may expose the asset to deeper losses.
However, if TRUMP manages to reverse its current bearish trend and regain bullish momentum, it could attempt to challenge resistance at $12.51.
A successful breakout above this level may open the door for a move towards $13.88. If buying pressure strengthens further, TRUMP could rally back up to $17.75, reclaiming levels closer to where it was trading before the recent downturn.
BankrCoin (BNKR)
BNKR has surged by 19% over the past week, positioning itself as one of the top-performing AI coins and one of the most talked-about assets on the Base chain.
This recent rally has drawn significant attention, helping BNKR stand out in a competitive market. However, despite the price increase, smart money wallets have shown mixed behavior—while they purchased $75,700 worth of BNKR in the last seven days, they also offloaded $213,730, resulting in a net outflow of $138,000.
This suggests that although BNKR is trending, larger investors may be capitalizing on the recent rally to secure profits.
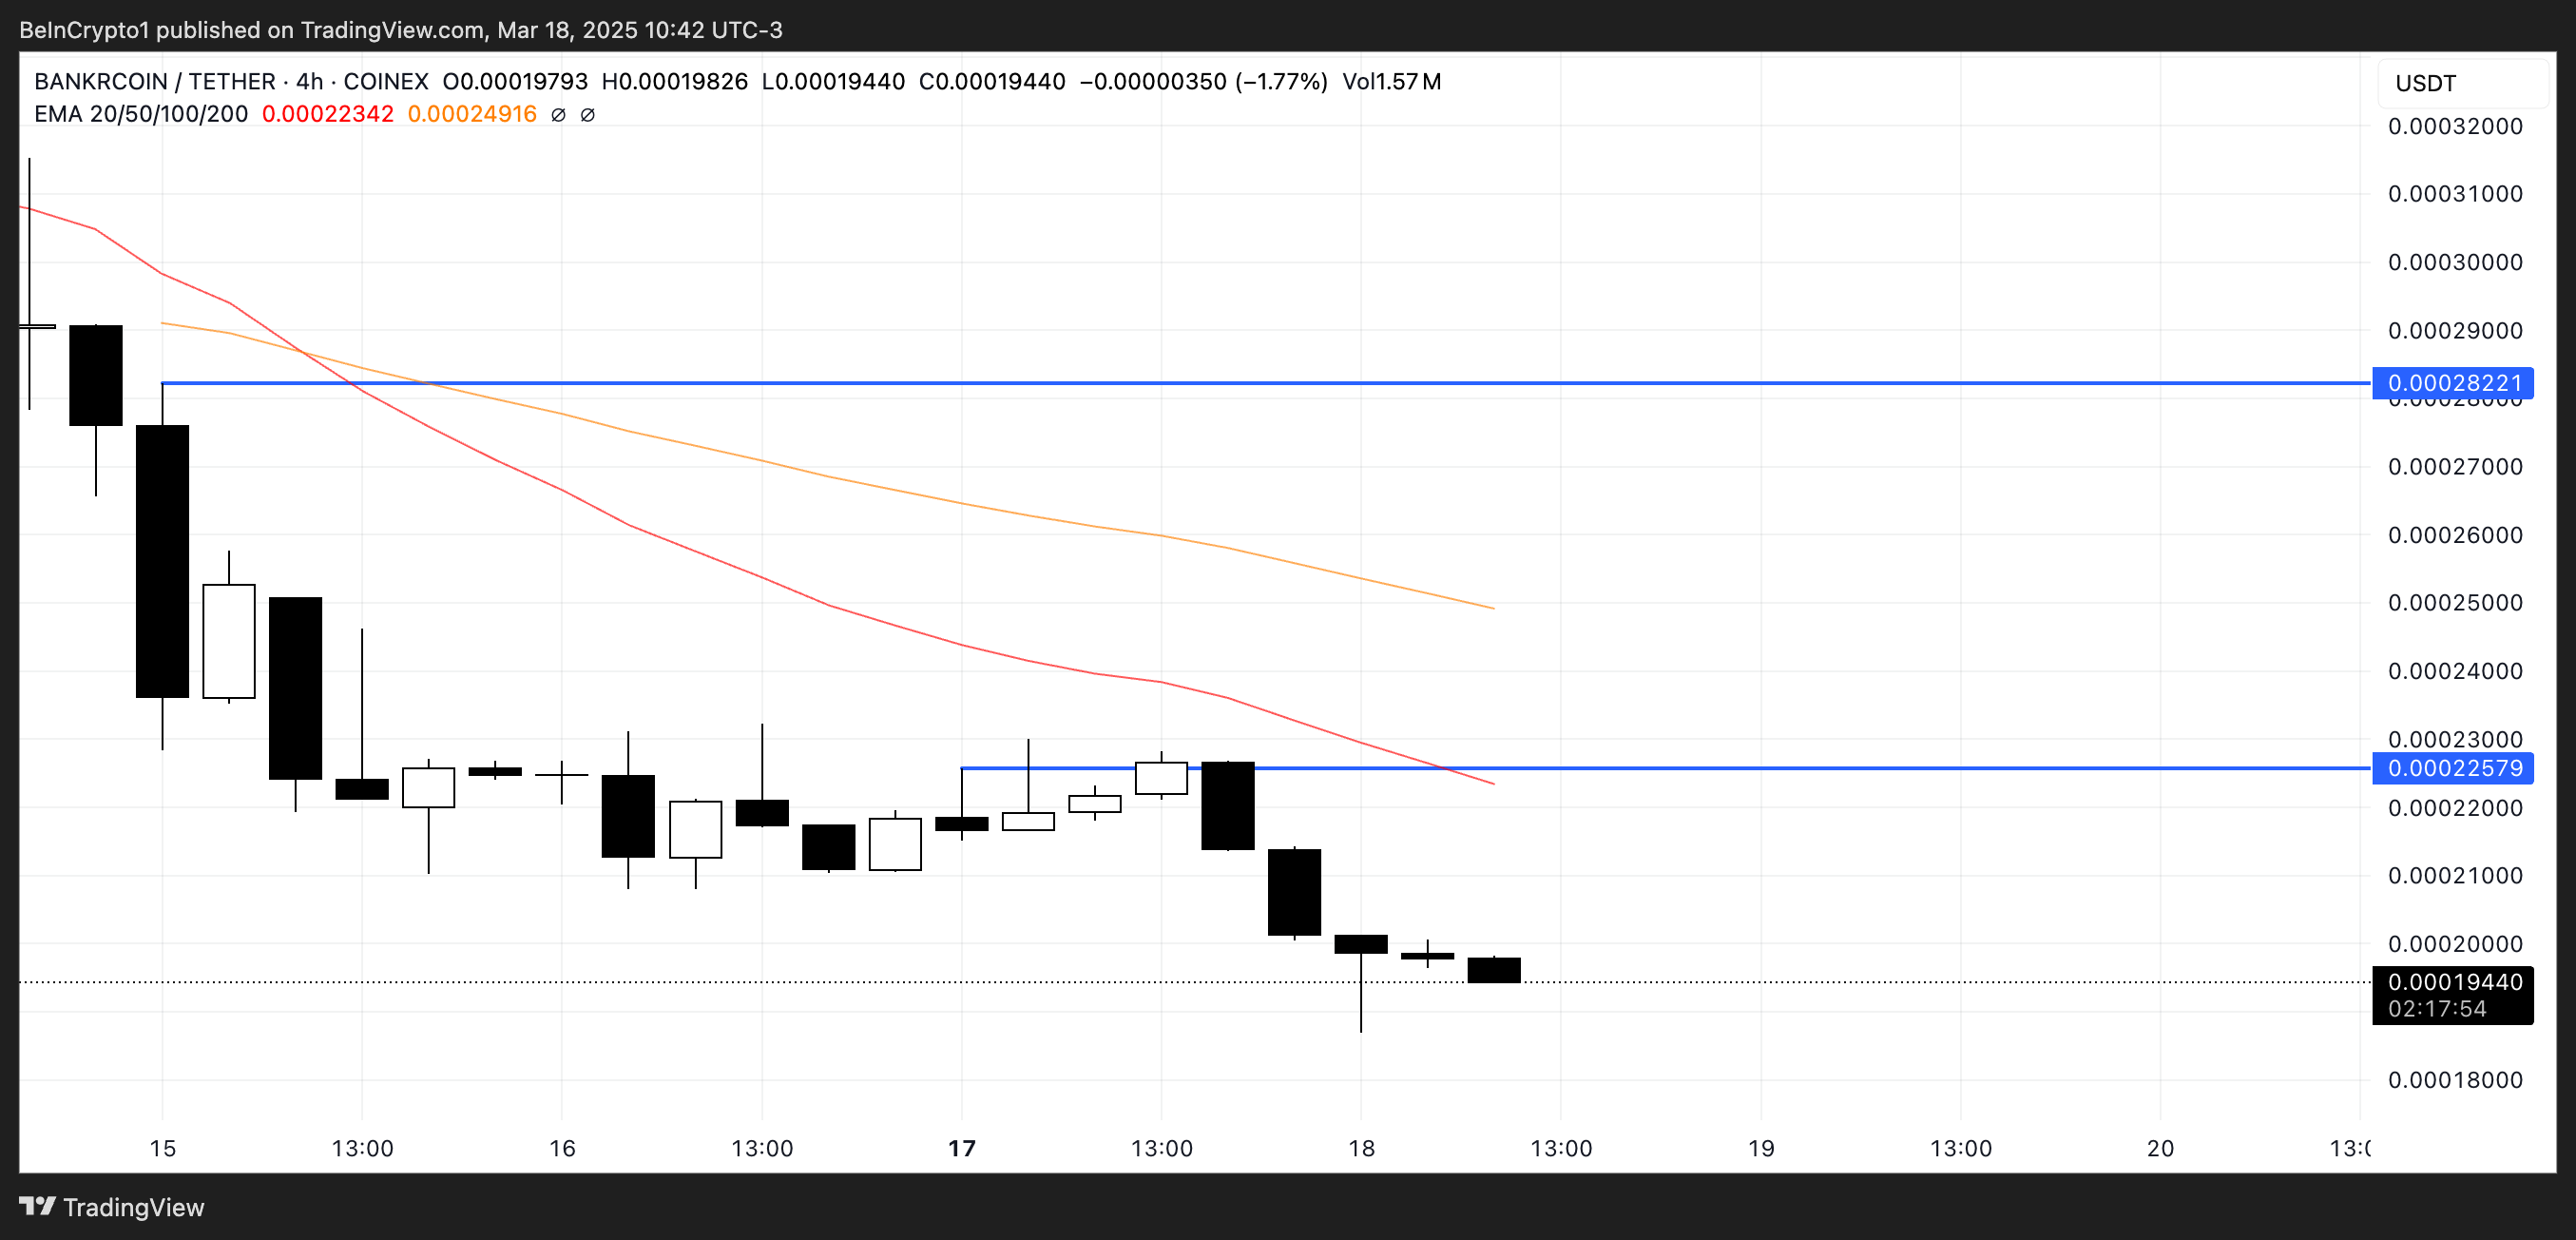
If this selling pressure persists, BNKR could lose its recent momentum and slip below key support levels at $0.00019 or even $0.00018, marking its lowest levels since mid-February.
On the other hand, if BNKR manages to reignite the bullish sentiment that fueled last week’s gains, it could retest resistance at $0.000225.
A breakout above this level could pave the way for a further move toward $0.000282, signaling a strong continuation of its upward trend.
PWEASE
PWEASE, a Solana meme coin satirizing US Vice President JD Vance, has been drawing attention amid volatile market conditions.
Over the past seven days, smart money wallets have shown a bearish stance. They purchased $166,720 worth of PWEASE but sold $291,000 in the same period, resulting in a net outflow of $124,320.
This suggests that while the token has gained some traction, larger investors are currently leaning towards reducing their exposure, adding selling pressure to the coin.
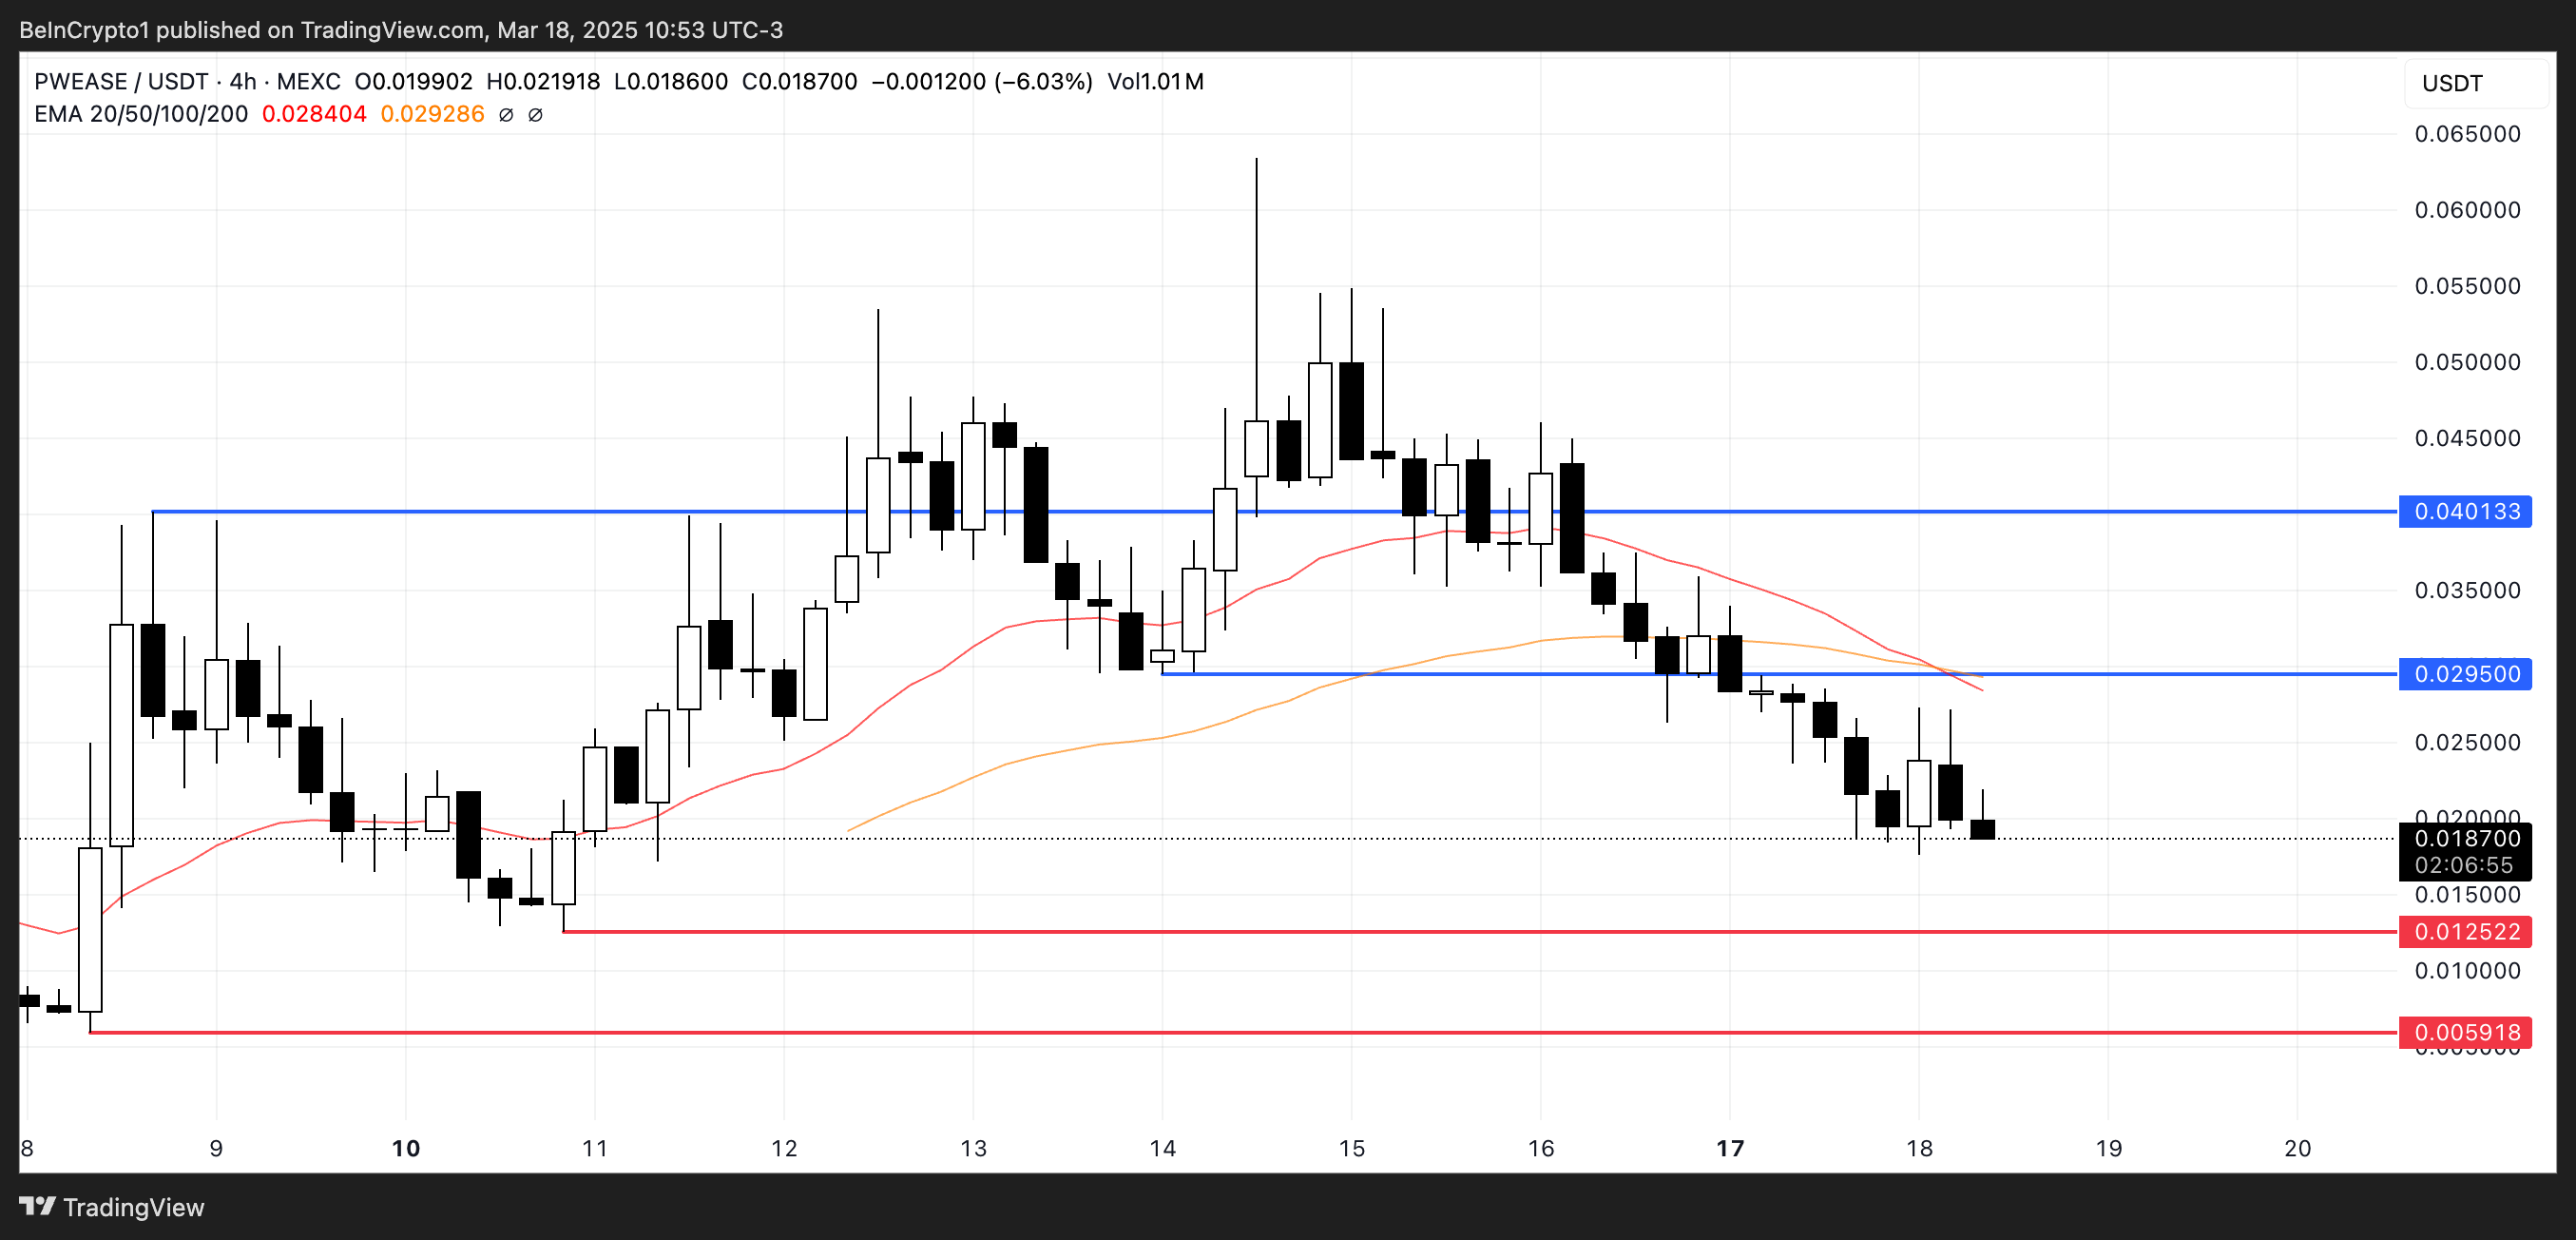
If this corrective trend continues, PWEASE could move lower and test the key support at $0.0125. If that level fails to hold, a deeper decline toward $0.0059 may follow.
However, should PWEASE manage to attract renewed buying interest and reverse the downtrend, it could push up to challenge resistance at $0.0295.
A breakout above this level could open the door for further upside toward $0.040, signaling a potential shift back to bullish momentum for the meme coin.
Disclaimer
In line with the Trust Project guidelines, this price analysis article is for informational purposes only and should not be considered financial or investment advice. BeInCrypto is committed to accurate, unbiased reporting, but market conditions are subject to change without notice. Always conduct your own research and consult with a professional before making any financial decisions. Please note that our Terms and Conditions, Privacy Policy, and Disclaimers have been updated.
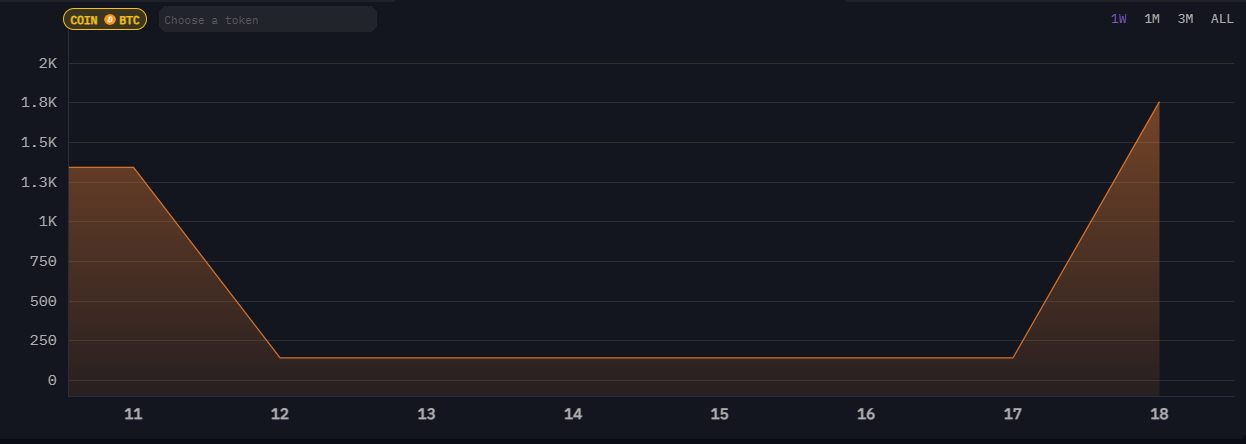
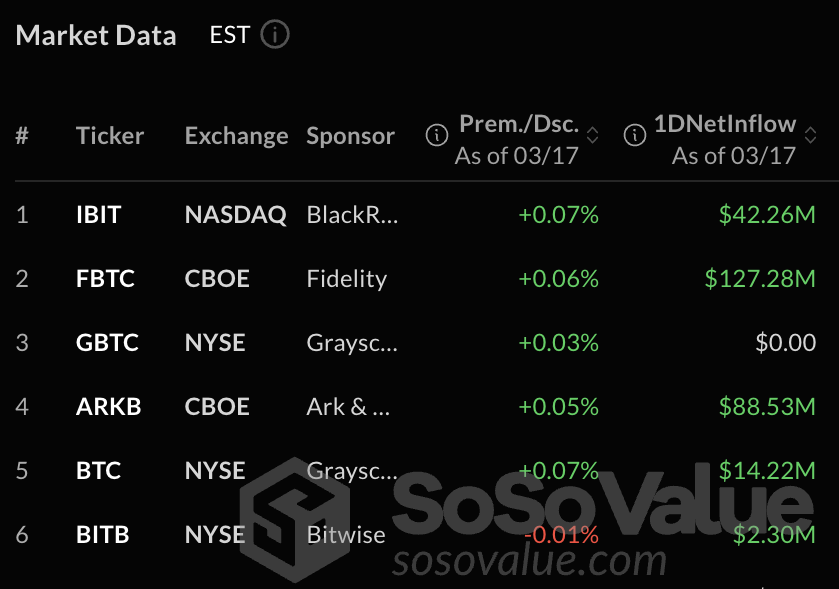
As the Bitcoin ETF market is seeing inflows again, the issuers are purchasing BTC in huge volumes. Fidelity and ARK Invest, two of the leading issuers, acquired more than $40 million in Bitcoin since yesterday.
Rumors also suggested that BlackRock, the largest ETF issuer, made similar purchases, yet these remain unverified. Overall, the fresh acquisitions from asset managers could contribute to a much-needed bullish narrative for the market.
Will Bitcoin ETFs Influence a New Bullish Cycle?
After weeks of consistent ETF outflows, the market is starting to pick up again. On Monday, US spot Bitcoin ETFs saw $274 million in net inflow—the largest daily inflow since February 28.
Meanwhile, blockchain analytics platform Arkham claimed that BlackRock is also making large BTC purchases.
“ARKHAM ALERT: BlackRock is buying $40 Million BTC. BlackRock is buying. Fidelity is buying. Ark is buying,” the firm stated via social media.
However, despite these claims, the on-chain data does not match up. Fidelity and ARK Investments both acquired large amounts of BTC today, posting inflow transactions of $41.16 million.
Both ETF issuers had other Bitcoin inflows, but BlackRock’s on-chain data actually shows a net decrease in BTC holdings.
These other leading ETF issuers have indeed been purchasing Bitcoin, as independent verification can clearly show. ETF analyst Shaun Edmondson claimed that they bought 665 BTC last Friday and 3,261 BTC on Monday.
Bitcoin’s price has been highly volatile, which might be adding to confusion regarding the ETF market. Last week, the issuer’s collective holdings fell below Satoshi’s wallet, a milestone they passed three months ago.
However, it looks like institutional investors are regaining the confidence to enter the market, as most Bitcoin ETFs have turned green this week.
Overall, institutional investors have been a key influence on Bitcoin’s market movement for the past year. If net inflow remains positive in the ETF market, it could help create a much-needed bullish narrative in the face of today’s bearish sentiment.
Disclaimer
In adherence to the Trust Project guidelines, BeInCrypto is committed to unbiased, transparent reporting. This news article aims to provide accurate, timely information. However, readers are advised to verify facts independently and consult with a professional before making any decisions based on this content. Please note that our Terms and Conditions, Privacy Policy, and Disclaimers have been updated.

Burwick Files Lawsuit Against Meteora and Other LIBRA Backers

3 Crypto Smart Money Wallets Are Dumping Fast This March

ADA Bulls Target $1 as Cardano Price Double Bottom Pattern Hints at Reversal

Bitcoin ETF Issuers Purchase Over $40 Million in BTC
Analyst Predicts XRP Price To Reach $20 With 18 XRP ETFs On The Horizon

Top 3 Base Meme Coins to Watch Closely This Week

2.52 Million Altcoins Are Ruining Crypto’s Future

Animoca Brands Valuation Tanks 75% In Two Years, Here’s Why

Crypto exchange BingX hacked for $43 million

Are The Big Players Losing Interest?

Hong Kong’s Securities Association Tips Authorities On Crypto Self-Regulation
Coinbase cbBTC Set to go Live on Solana
2.52 Million Altcoins Are Ruining Crypto’s Future
Animoca Brands Valuation Tanks 75% In Two Years, Here’s Why
Crypto exchange BingX hacked for $43 million
Are The Big Players Losing Interest?
Hong Kong’s Securities Association Tips Authorities On Crypto Self-Regulation
Coinbase cbBTC Set to go Live on Solana
-

 Market22 hours ago
Cardano (ADA) Bulls Advance as Sellers Lose Grip
-
 Altcoin20 hours ago
Dogecoin Price Eyes Rally to $1 As One Million DOGE Wallets Rising
-
 Market18 hours ago
Critical Exploit Hits BNB Chain’s four.meme: SlowMist Raises Alarm
-

 Market16 hours ago
Binance Alpha Listing and CZ Spark 200% Rally In MUBARAK Coin
-

 Market15 hours ago
Crypto.com Reverses 2021 Token Burn, Re-Mints 70B CRO
-

 Market20 hours ago
How Will the Fed’s Interest Rate Affect the Crypto Market?
-
 Market19 hours ago
Pi Network (PI) Risks Falling Below $1 As Bears Take Control
-
 Altcoin19 hours ago
Mubarak Meme Coin Trader Turns $232 Into $1.1 Million, Here’s How