
Market
Extreme USDT Volatility Recorded On Chain

Solana just celebrated its fifth birthday, and a recent study shows highly exaggerated USDT volatility on the network’s transport layer. This suggests a high level of speculative interest in the platform, fueled by the meme coin craze and other factors.
Web3 payments solutions platform Mercuryo shared this insight exclusively with BeInCrypto.
Solana’s Extreme USDT Volatility
Solana, the second-largest blockchain in the industry, just celebrated its fifth birthday. Its genesis block was mined on March 16, 2020. In honor of this milestone, Web3 infrastructure firm Mercuryo conducted a study on it.
According to this study, USDT volatility on Solana’s transport layer is currently at an “extreme” level.
“Solana captivates the interest of crypto traders across the globe. As Solana celebrates its fifth birthday, our transaction data on Tether tokens on the Solana transport layer suggests an unparalleled level of trading activity amid an explosion of interest in trading opportunities on Solana that we’ve seen over the past 12 months,” claimed Greg Waisman, Co-founder and COO at Mercuryo.
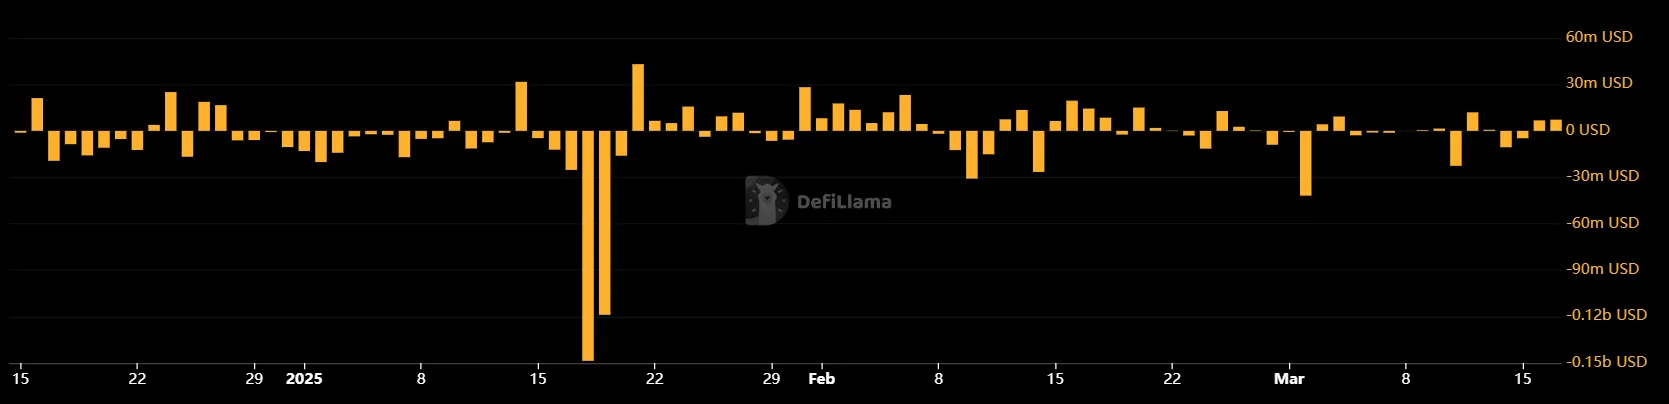
Solana’s USDT volatility has already spiked five times in 2025 alone. The network’s daily USDT trade volumes fluctuated dramatically in the past two months.
This consisted of three spikes and two drops, both of which were significantly smaller than the spikes. Both drops were in the 60%- 70% range, while the increases ranged between 100% and a whopping 137%.
More specifically, Solana saw a 100% increase in USDT trading on January 13. A week later, this activity dropped by 63% and again surged by 129% on January 27. This level of unprecedented capital movements is often rare for any blockchain network.
Mercuryo claims that this volatility is caused by several factors, but the explosion of Solana meme coins is particularly important. Thanks to major meme coin launchpads like Pump.fun, Solana trade volumes have spiked in recent months, even surpassing Ethereum on a few occasions. This rising interest helps fuel intense activity and these wild swings.
Over the past five years, its network has processed more than 408 billion transactions and nearly $1 trillion worth of value on decentralized exchanges. While Solana has shown gradual growth since 2023, the volatility of capital inflow has been chaotic, to say the least.
Ultimately, this enhanced level of volatility shows that Solana has a lot of interest among crypto traders. The network has grown remarkably over the last five years, and it’s already poised to make major advancements in the near future.
Disclaimer
In adherence to the Trust Project guidelines, BeInCrypto is committed to unbiased, transparent reporting. This news article aims to provide accurate, timely information. However, readers are advised to verify facts independently and consult with a professional before making any decisions based on this content. Please note that our Terms and Conditions, Privacy Policy, and Disclaimers have been updated.


Trump’s trade policy has yielded a risk-off mood in the crypto market with the fear & greed index remaining on the fear end of the spectrum. As such, most majors and meme coins alike have recorded double-digit losses in recent months. Investors are now keen on the Fed’s tone at the end of the two-day meeting on Wednesday.
Even so, there is a revolutionary project whose appeal remains undeterred by the current economic uncertainties. Bitcoin Pepe has maintained its upward momentum as savvy investors rush to be part of this project which assures hefty gains during and after its presale.
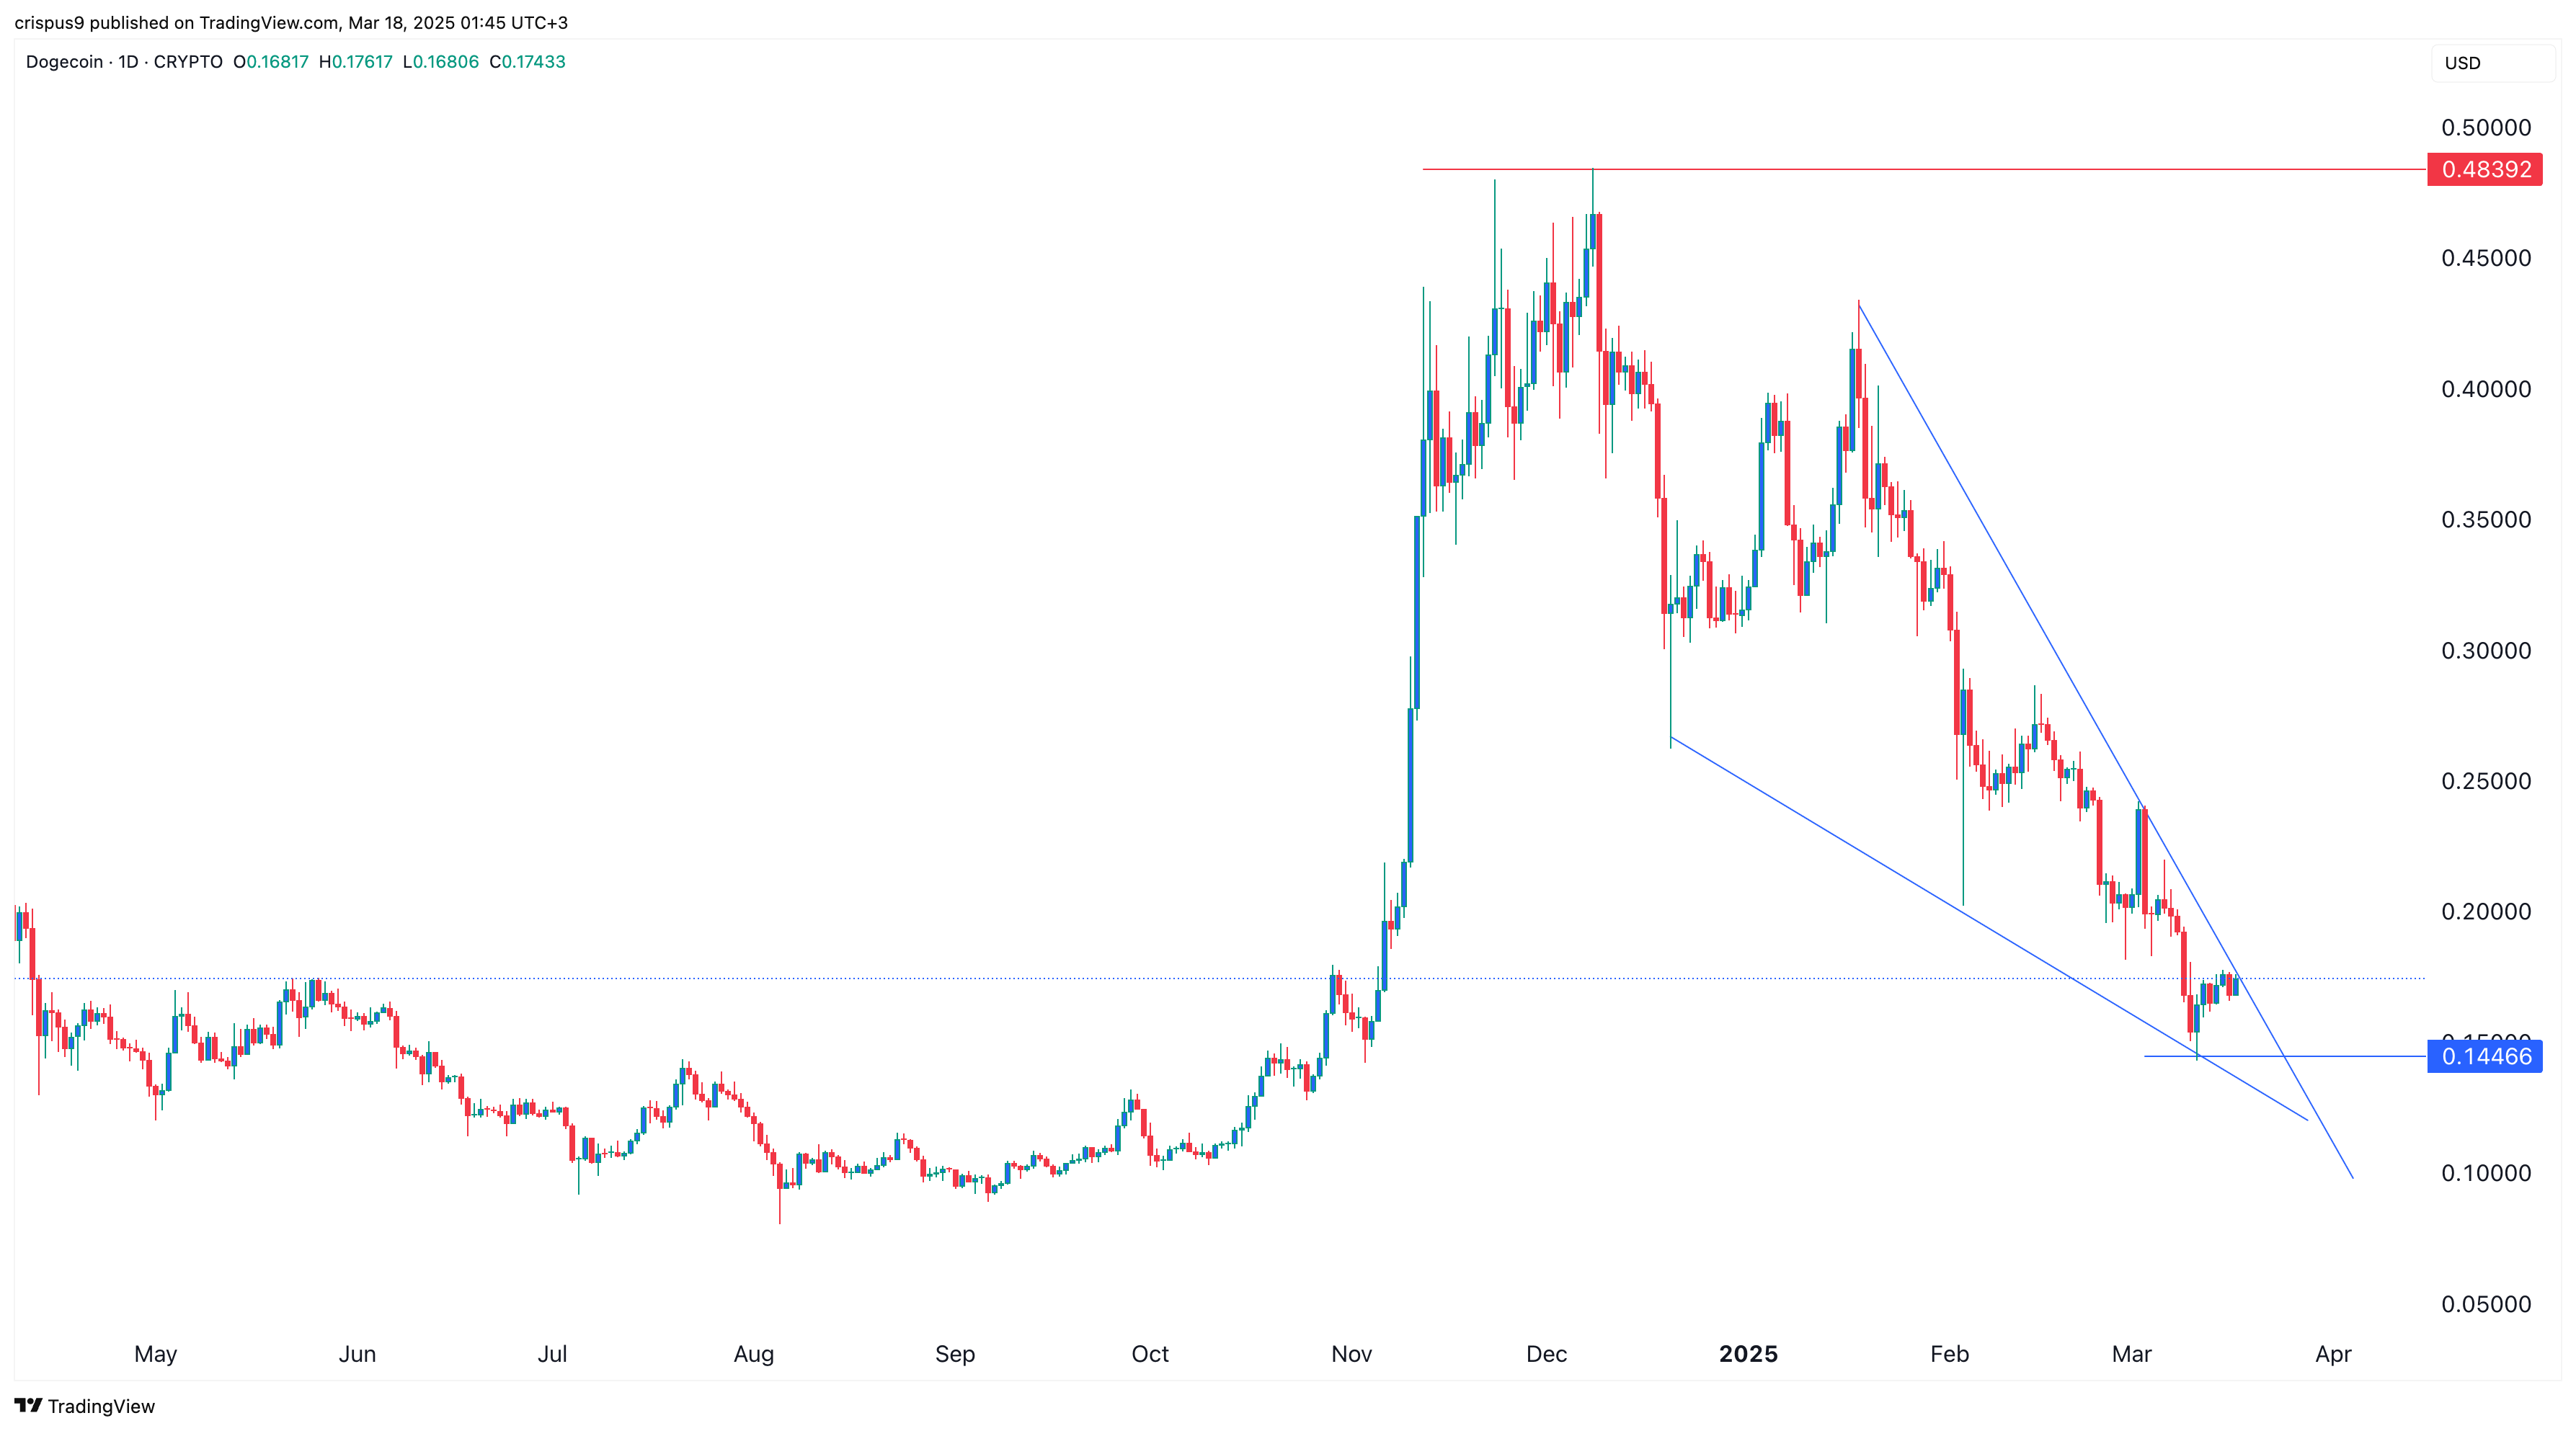
Trump’s tariffs push Dogecoin buyers to the sidelines
The risk aversion observed in the crypto market has impacted majors and meme coins alike. As President Trump threatens of even more aggressive tariffs, crypto buyers have stayed on the sidelines waiting for further guidance from the March Fed meeting.
In the near term, Dogecoin price will likely remain within the range of between the four-month low of $0.1439 and ythe resistance zone at $0.1804. Even with further rebounding, its gains may be curbed along the 25-day EMA at $0.1954.
Bitcoin Pepe maintains upward momentum despite risk aversion in the crypto market
Amid the ongoing crypto revolution, most of the recently launched meme projects are more than just a token that starts as a joke and goes viral. They focus on a particular need with the overall goal of revolutionizing the cryptocurrency space.
Bitcoin Pepe is one such project. Its mission is to build “Solana on Bitcoin”, which will have investors enjoy the stability and security of the Bitcoin network and the Solana-like transaction speed. Besides, with the new PEP-20 standard, it will enable one to directly launch a memecoin on the most reliable network.
Indeed, introducing the meme culture to the Bitcoin network is seen to be the missing puzzle. It is what has fueled Bitcoin Pepe’s virality as more savvy investors are rushing to be part of this revolutionary wagon. Subsequently, the project has raised over $5.5 million in the past five weeks of its presale.
Besides, its pricing model is meant to favor long-term holders and early adopters. With every stage sold, BPEP token price increases by about 5%. What started at $0.0210 has already surged by 27.6% and is set to yield cumulative gains of 311.4% by the end of the 30 stages. As such, this is the opportune time to be part of a project that will have its holders earn heftily during the presale and beyond. Hurry up and buy Bitcoin Pepe here.
Bitcoin price remains range-bound as the March Fed meeting commences
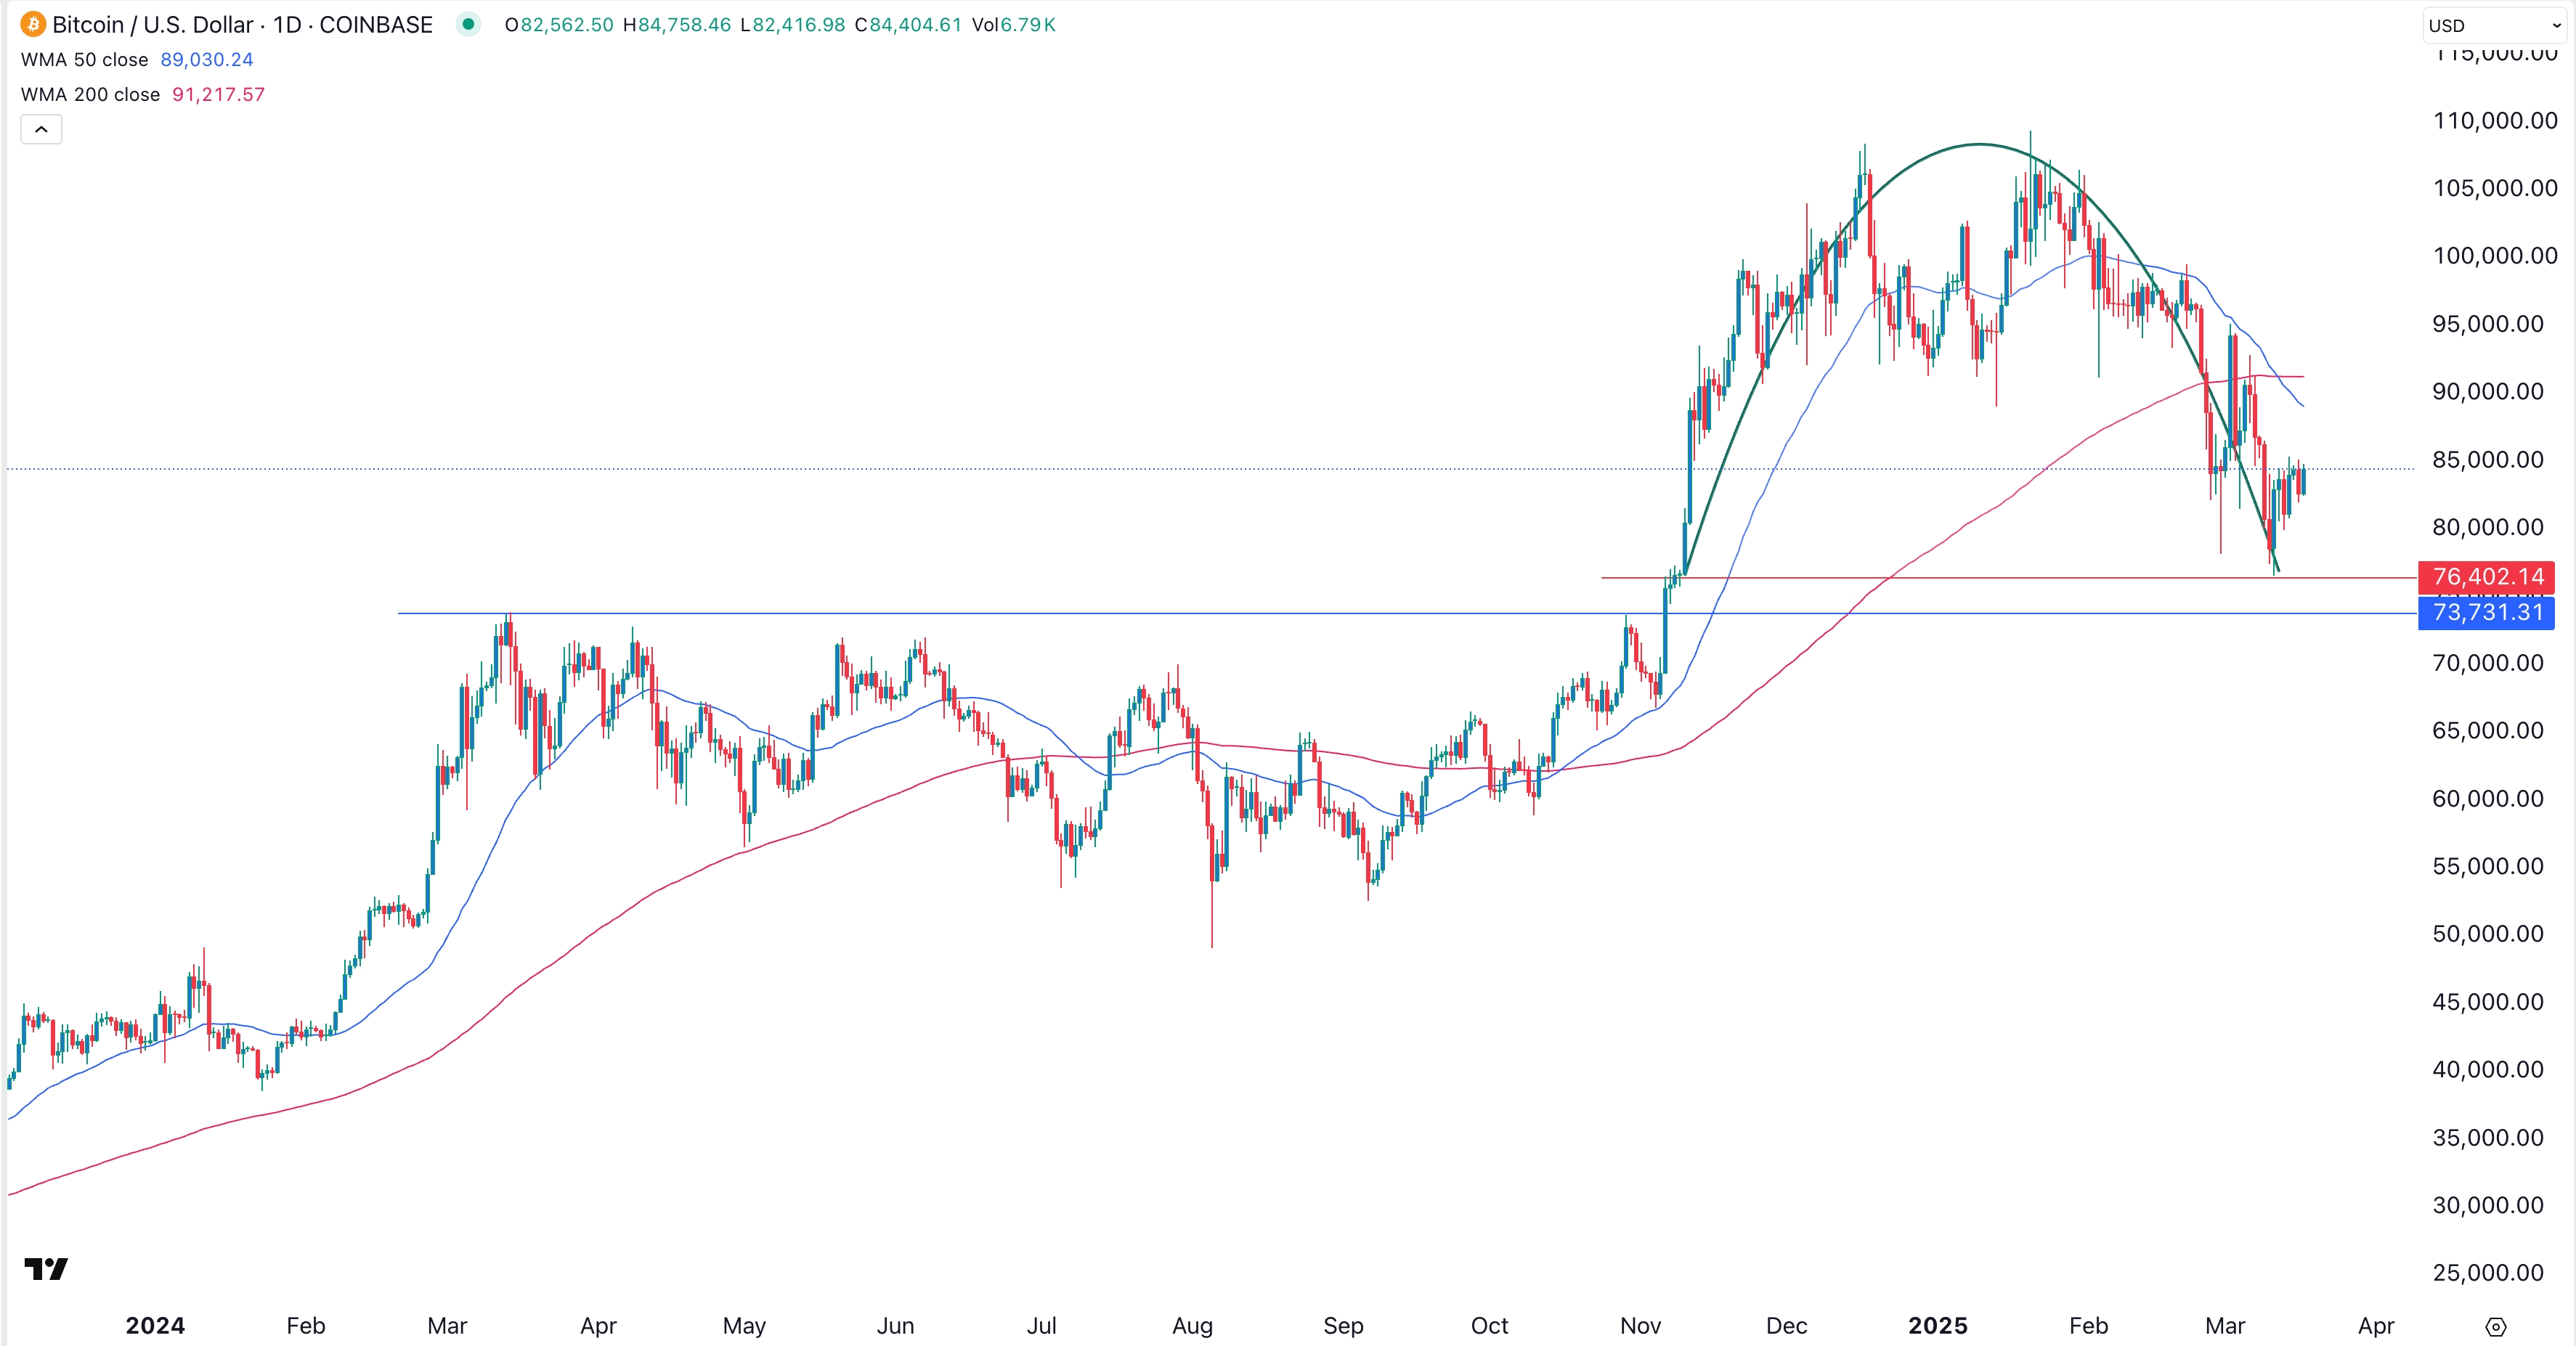
Bitcoin price has been range-bound for over a week now as Trump’s aggressive trade policy maintains a risk-off mood. Investors are now eyeing further guidance from the Fed’s March meeting which commenced on Tuesday.
In the FOMC statement scheduled for Wednesday, the interest rates are expected to remain unchanged at the current 4.25% – 4.50%. However, the focus will be on the central bank’s tone on the impact of Trump’s tariffs on the country’s economy.
In the near term, the range between the support level of $80,565 and the 25-day EMA at $86,500 will be worth watching. Depending on the Fed’s tone, further rebounding will give the bulls an opportunity to retest the crucial resistance zone of 90,000. On the flipside, further risk aversion may have Bitcoin price retest last week’s low at $78,039.

Since closing at a low of $78,620 on March 10, Bitcoin (BTC) has staged a comeback and is currently trending upward gradually.
The leading cryptocurrency has recorded a 1.2% price uptick over the past week, with on-chain data signaling a fresh wave of whale accumulation.
Bitcoin Whale Demand Surges as Investors Buy the Dip
In a new report, pseudonymous CryptoQuant analyst Onchained found that a new wave of Bitcoin whales has emerged. These large investors hold at least 1,000 BTC wallets and have an average acquisition age under six months.
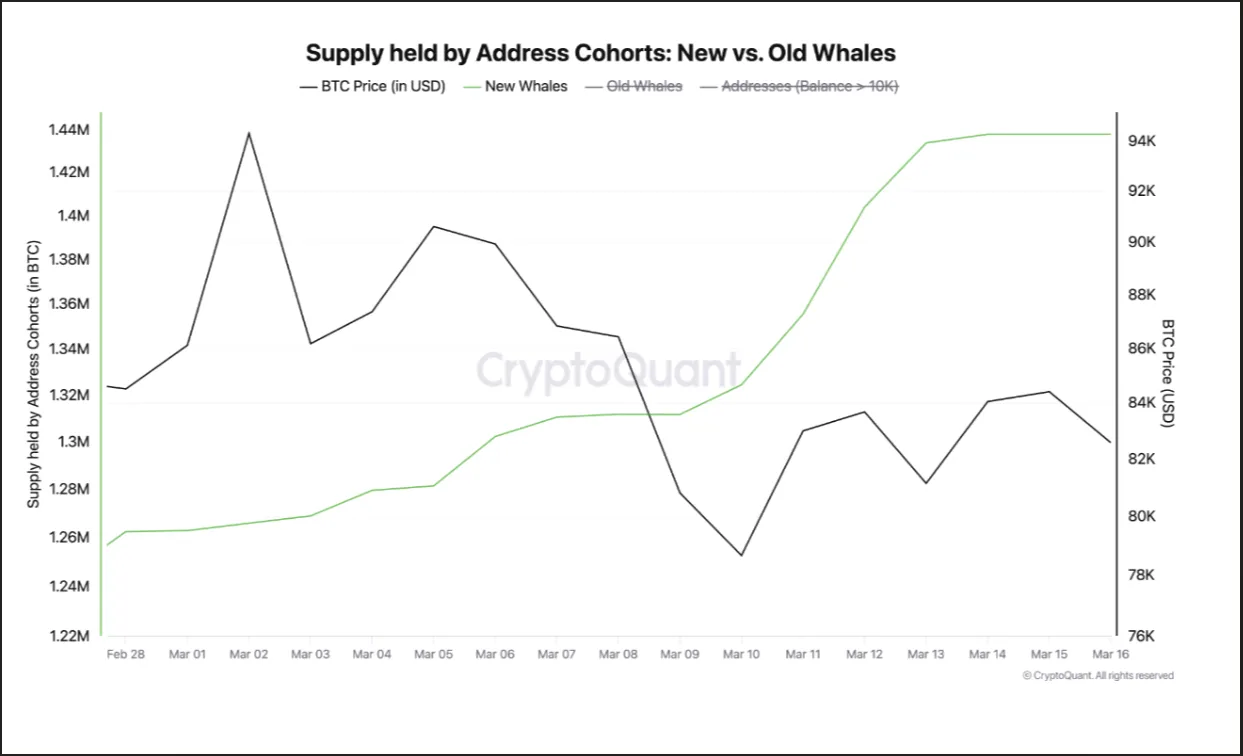
“On-chain data confirms that since November 2024, these wallets have collectively acquired over 1 million BTC, positioning themselves as one of the most influential market participants. Their accumulation pace has accelerated notably in recent weeks, accumulating more than 200,000 BTC just this month,” Onchained wrote.
When new whales show interest in BTC like this, it signals a resurgence in bullish confidence in its long-term performance. BTC’s recent decline to multi-year lows has fueled this accumulation trend, as it presents a prime opportunity for whales looking to “buy the dip” and sell at a higher price.
Moreover, BTC holders have increased their coin holding time in the past week, highlighting the gradual comeback in bullish sentiments toward the coin. According to IntoTheBlock, this has climbed 12% over the past seven days.
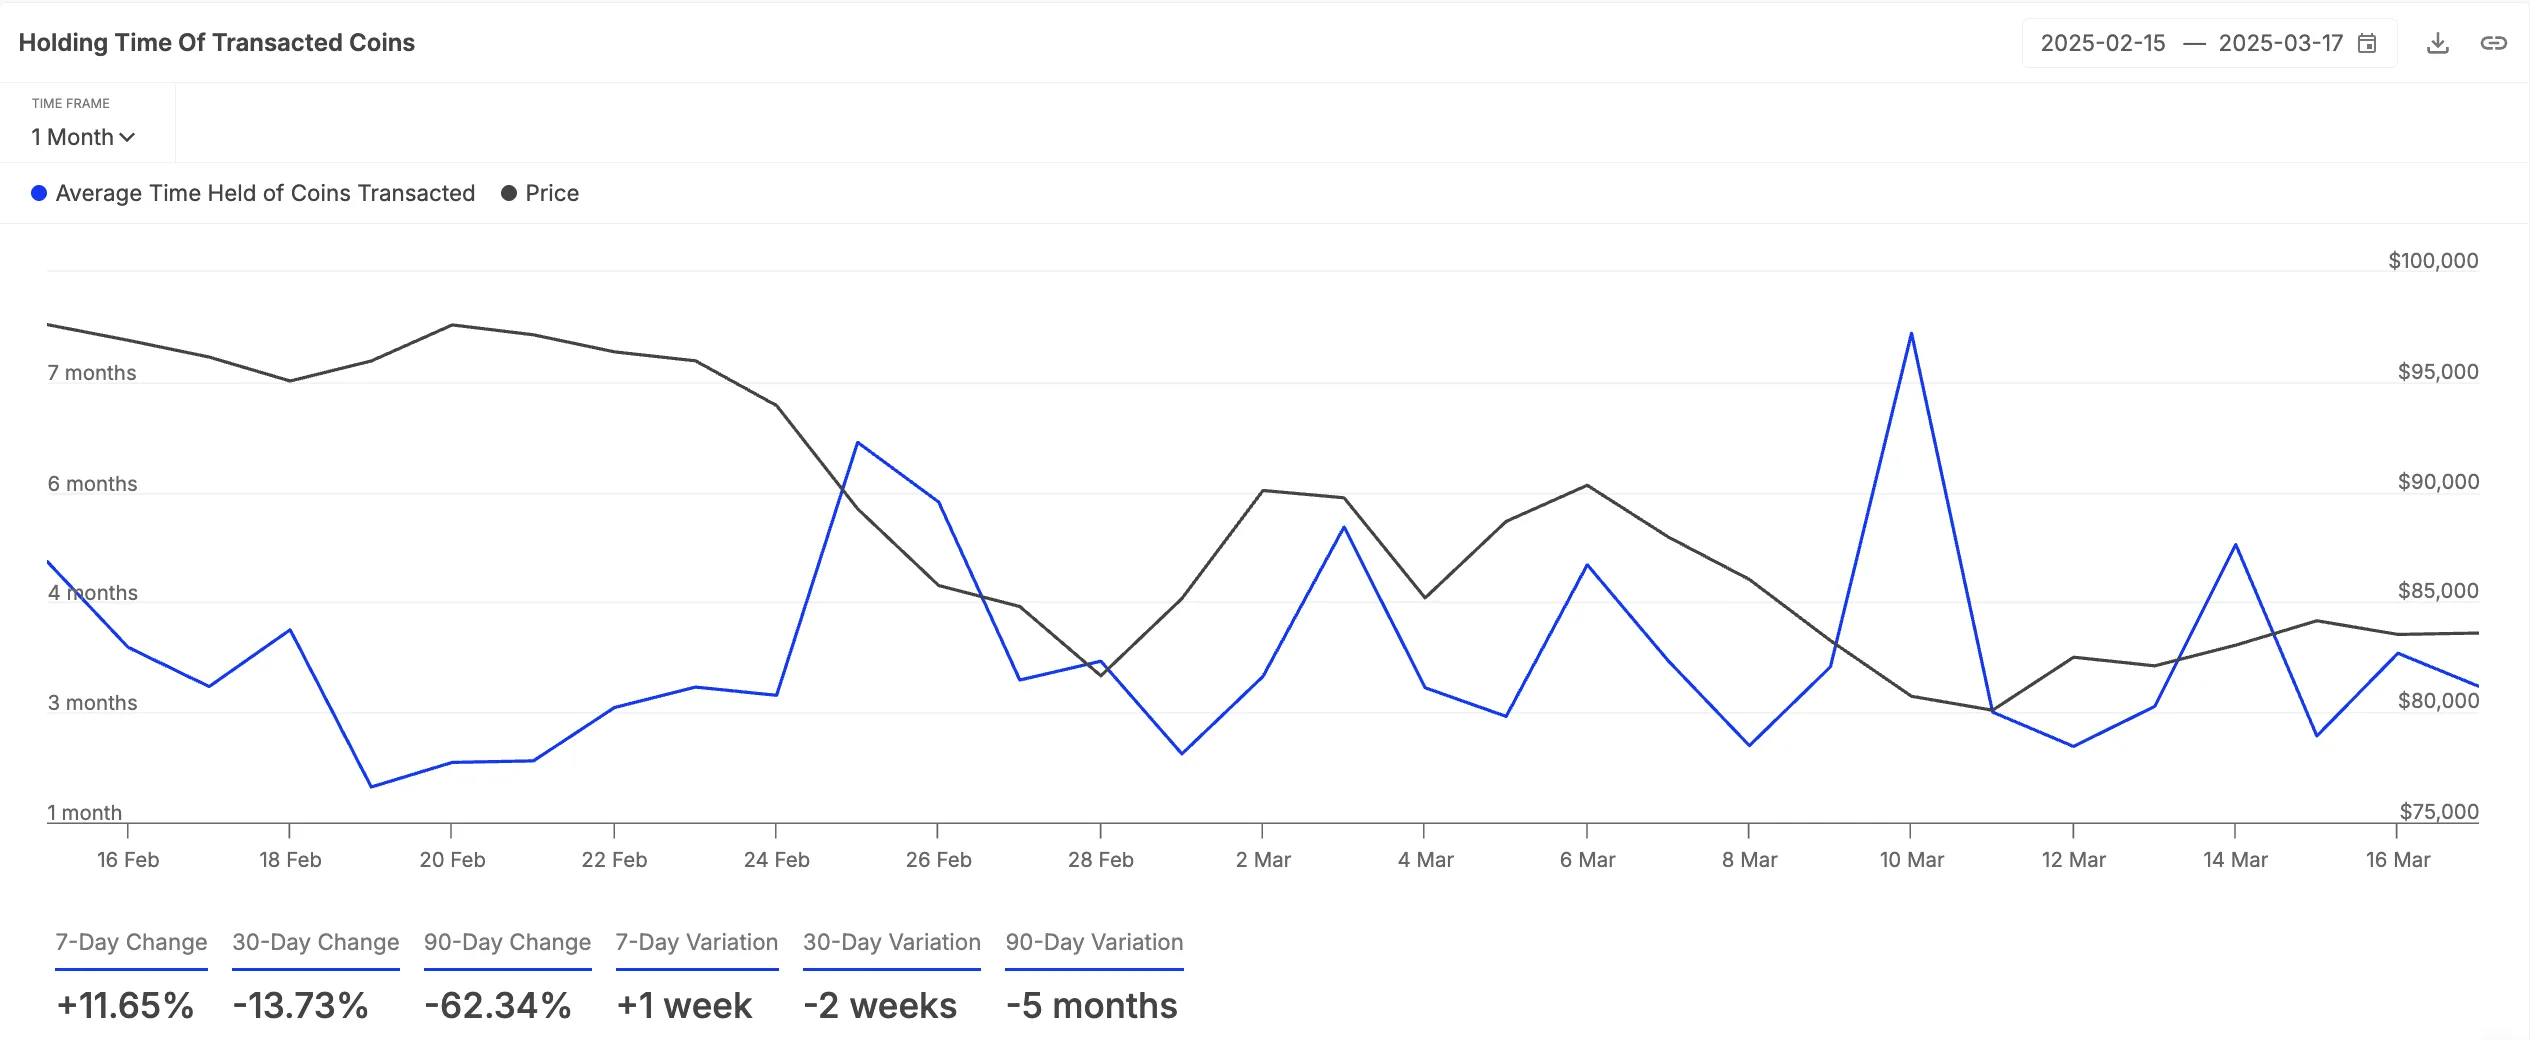
The holding time of an asset’s transacted coins measures the average length of time its tokens are held before being sold or transferred. When this extends, it reflects stronger investor conviction, as investors choose to keep their coins rather than sell.
This can help reduce the selling pressure as supply dries up gradually in the BTC market, driving up the coin’s value in the near term.
Bitcoin at a Crossroads: Rebound to $89,000 or Drop to $77,000 Next?
Although BTC’s Elder-Ray Index continues to post red histogram bars, their sizes have gradually reduced over the past few days.
This indicator compares buying pressure with selloffs to determine an asset’s price trends. When its bars decrease in height, it indicates that bearish pressure is weakening.
This suggests that BTC sellers are losing momentum, and buyers may be gradually stepping in. If this trend continues, it could slow down BTC’s downtrend. Its price could rebound and climb toward $89,434.
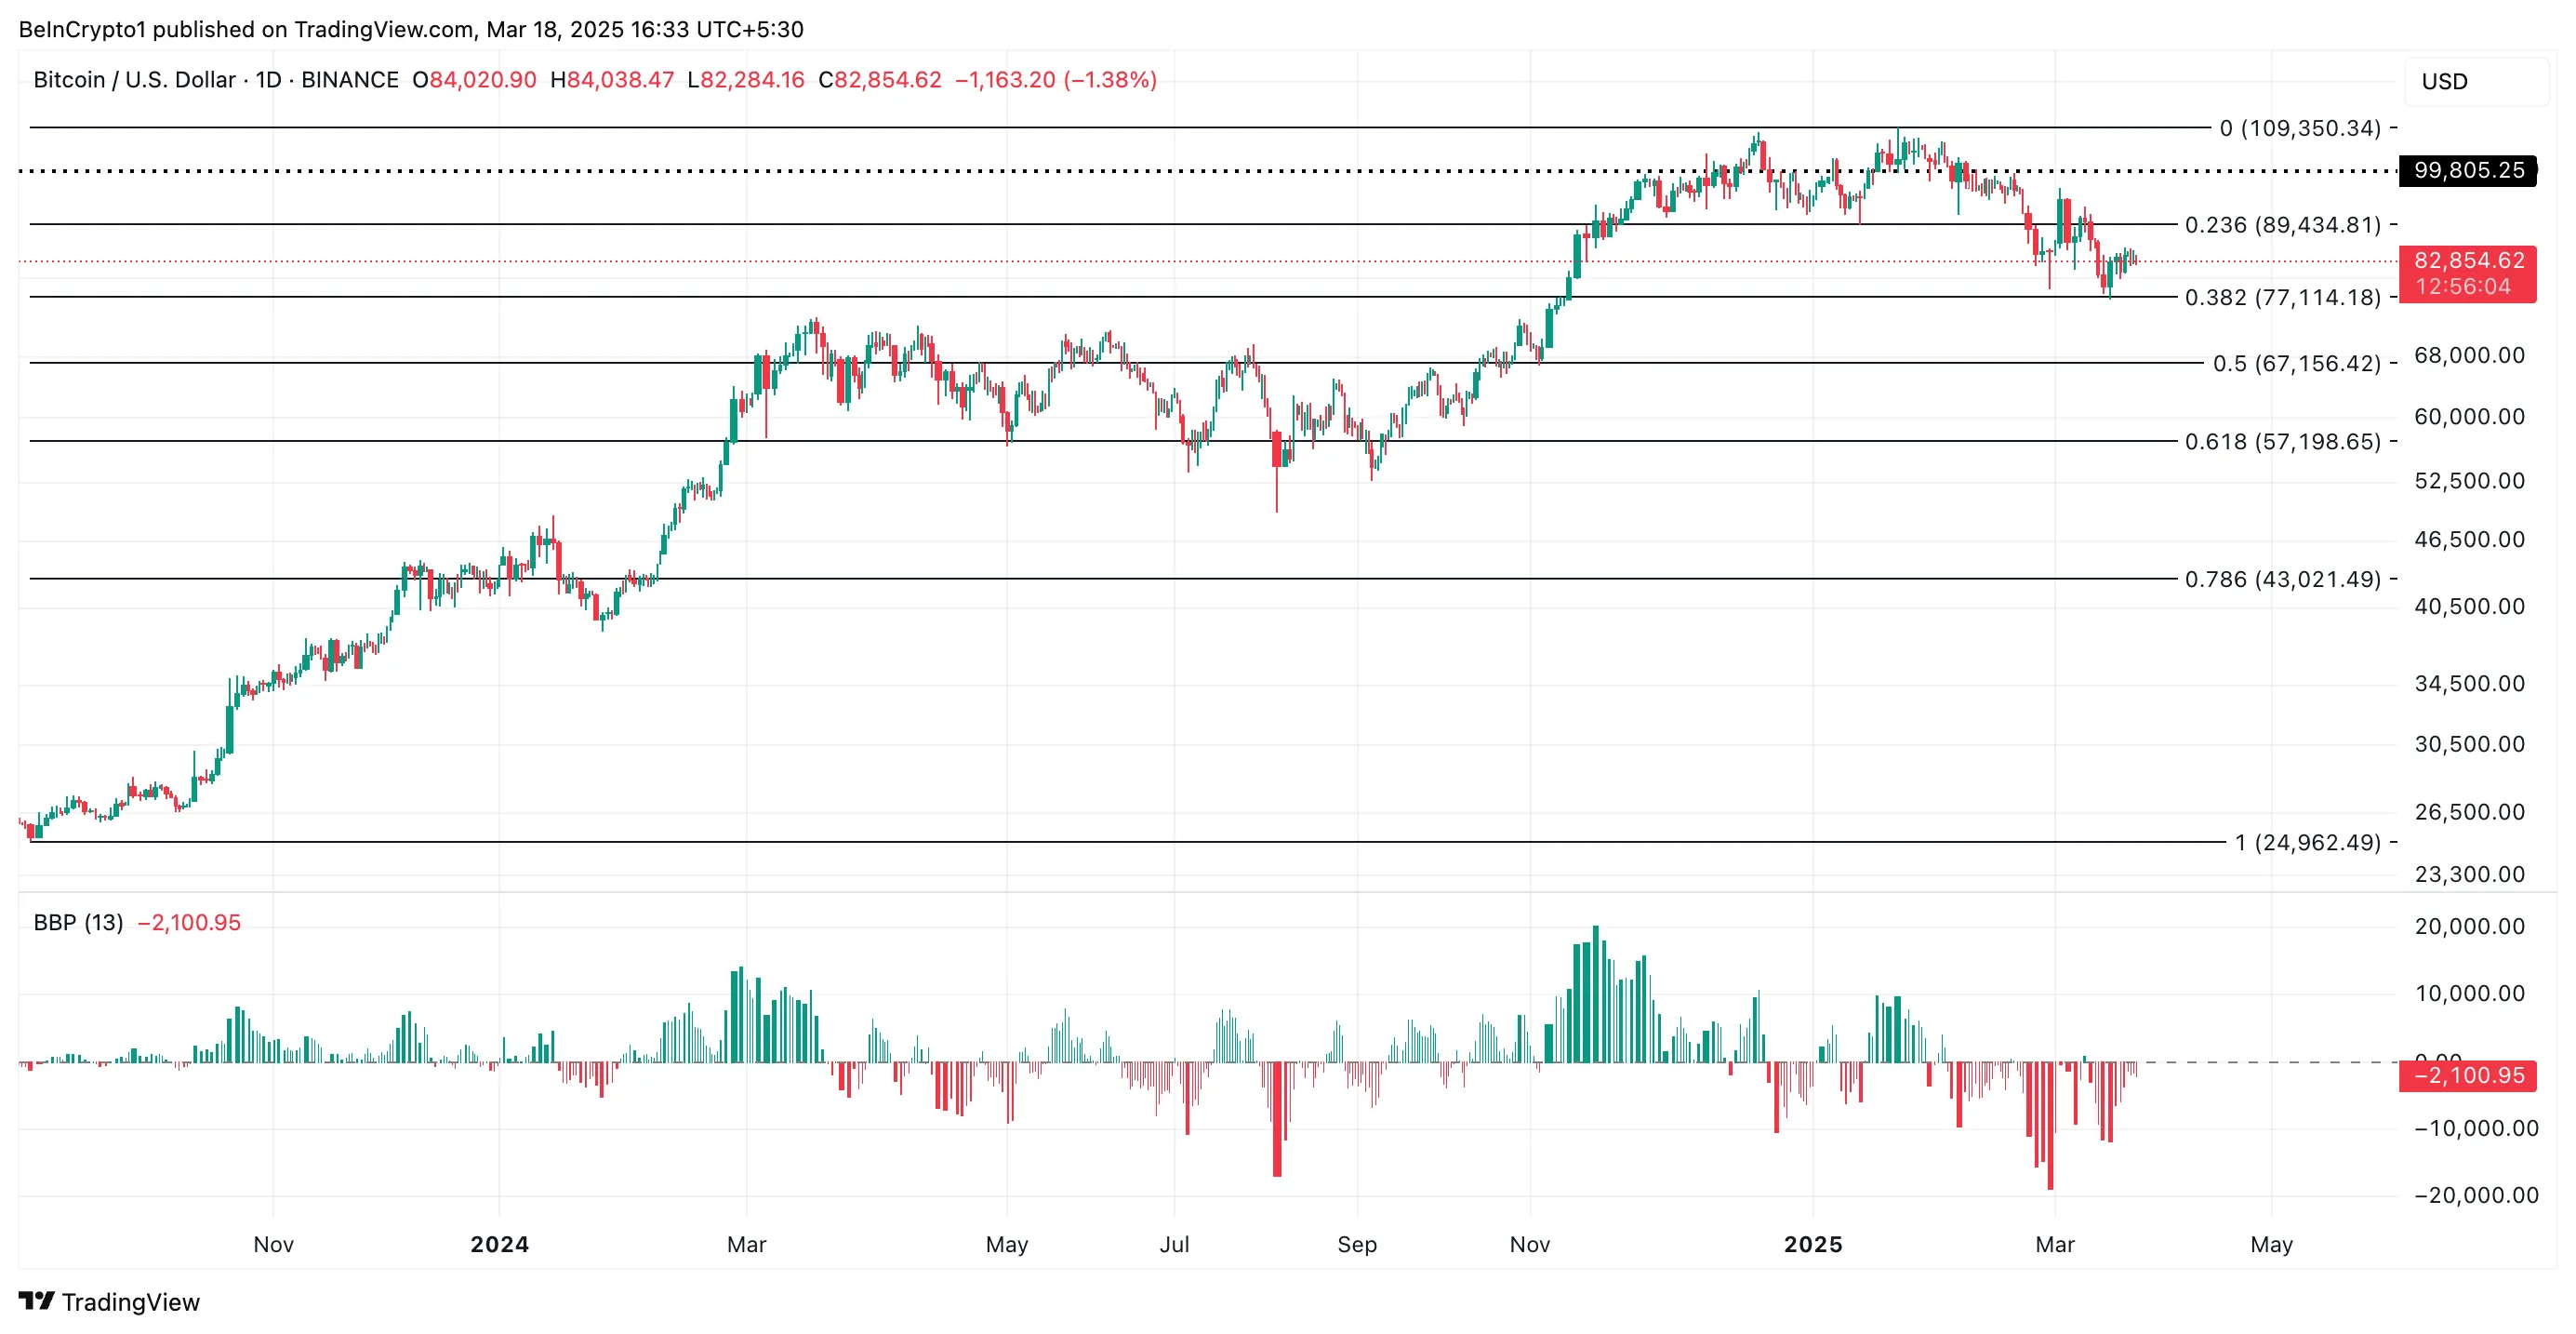
On the other hand, if selling pressure strengthens, the king coin risks plummeting to $77,114.
Disclaimer
In line with the Trust Project guidelines, this price analysis article is for informational purposes only and should not be considered financial or investment advice. BeInCrypto is committed to accurate, unbiased reporting, but market conditions are subject to change without notice. Always conduct your own research and consult with a professional before making any financial decisions. Please note that our Terms and Conditions, Privacy Policy, and Disclaimers have been updated.

PancakeSwap’s CAKE token is the market’s top performer today, surging 21% in the past 24 hours. At press time, the altcoin trades at $2.56.
This rally comes as CAKE records its highest daily spot inflow in a month amid strong demand and renewed investor interest in the token.
CAKE Rockets Higher with $3.37 Million Inflows—Is More Upside Ahead?
CAKE’s price rally is primarily driven by the sharp increase in trading activity on the PancakeSwap decentralized exchange (DEX). Over the past few days, the platform has seen a significant uptick in daily trading volume, outperforming Ethereum’s Uniswap and Solana’s Raydium.
The trend has triggered a surge in demand for the DEX’s native token, CAKE, causing its value to soar by double digits. The uptick in buying pressure is reflected by the token’s spot inflows, currently at $3.37 million, its single-day highest figure in the past month.
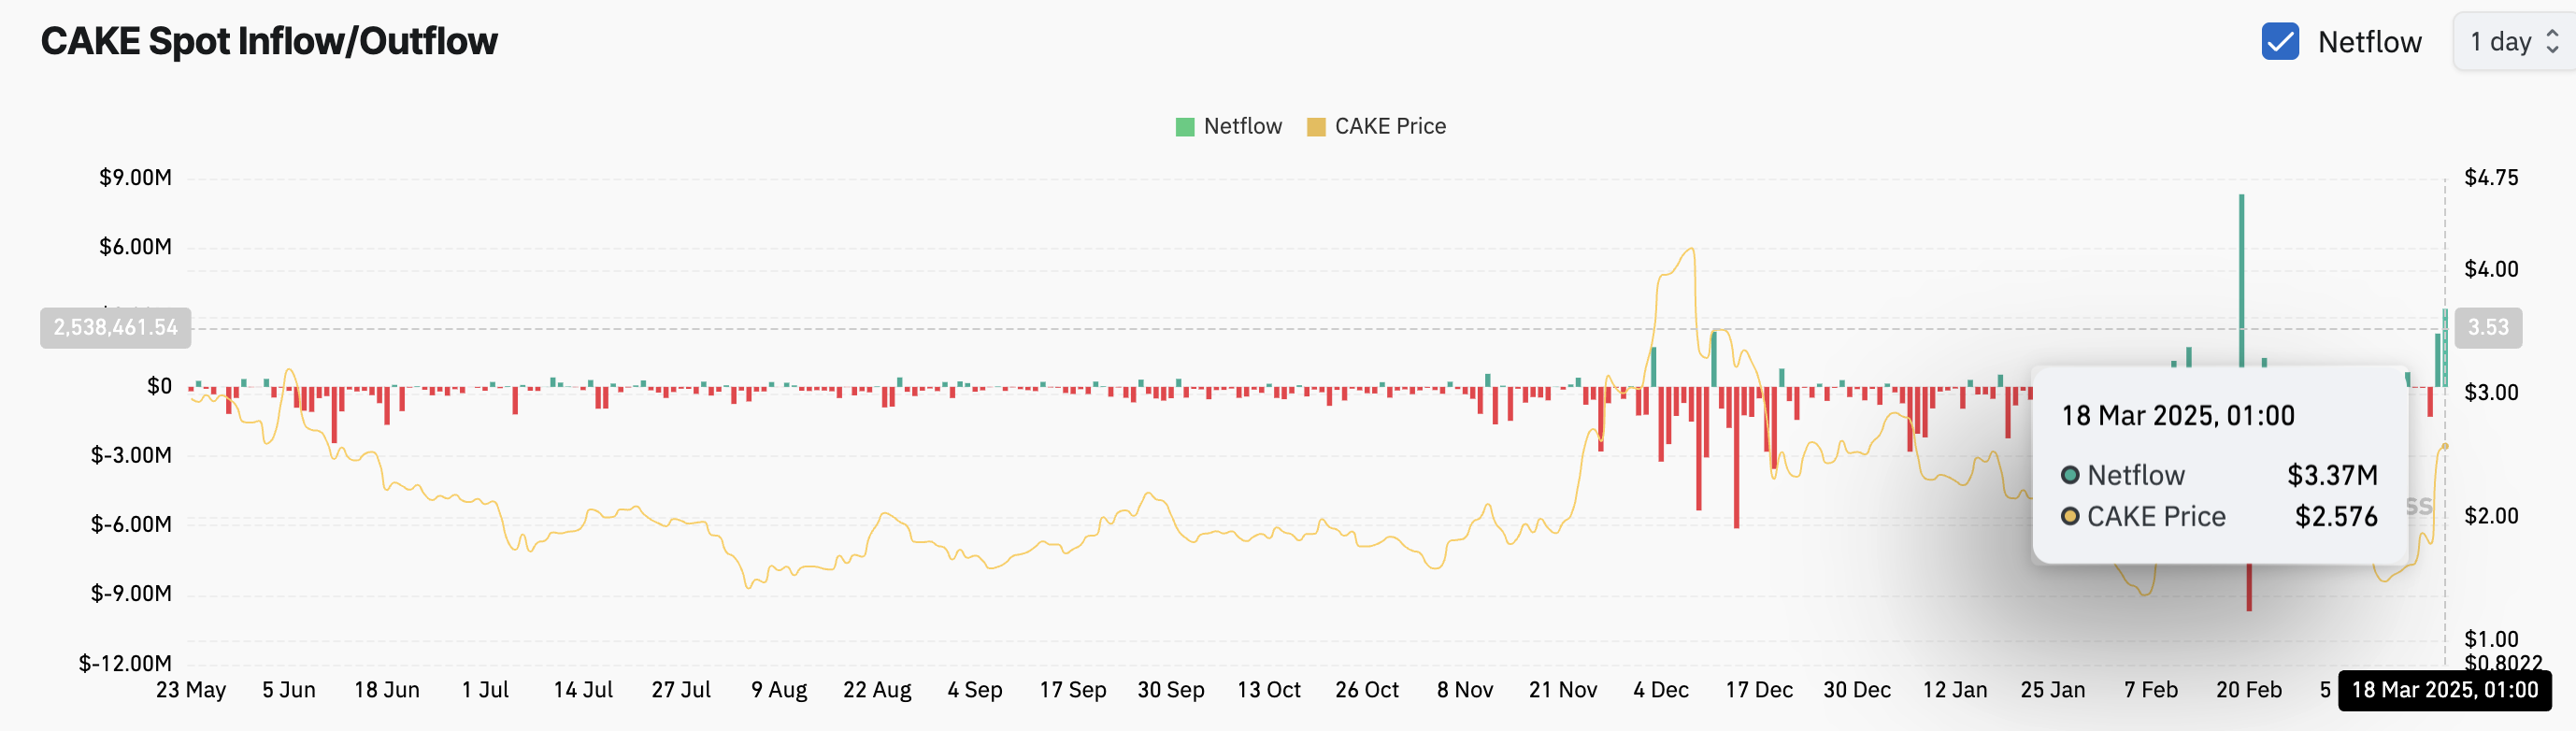
When an asset records spot inflows, the number of tokens purchased and moved into spot markets has increased, indicating rising demand. CAKE’s high spot inflows suggest that investors are actively accumulating the asset. If this buying pressure continues, it can drive further price appreciation.
This is a bullish signal, especially as it is accompanied by positive market sentiment, as shown by the token’s funding rate, which is 0.0021% as of this writing.
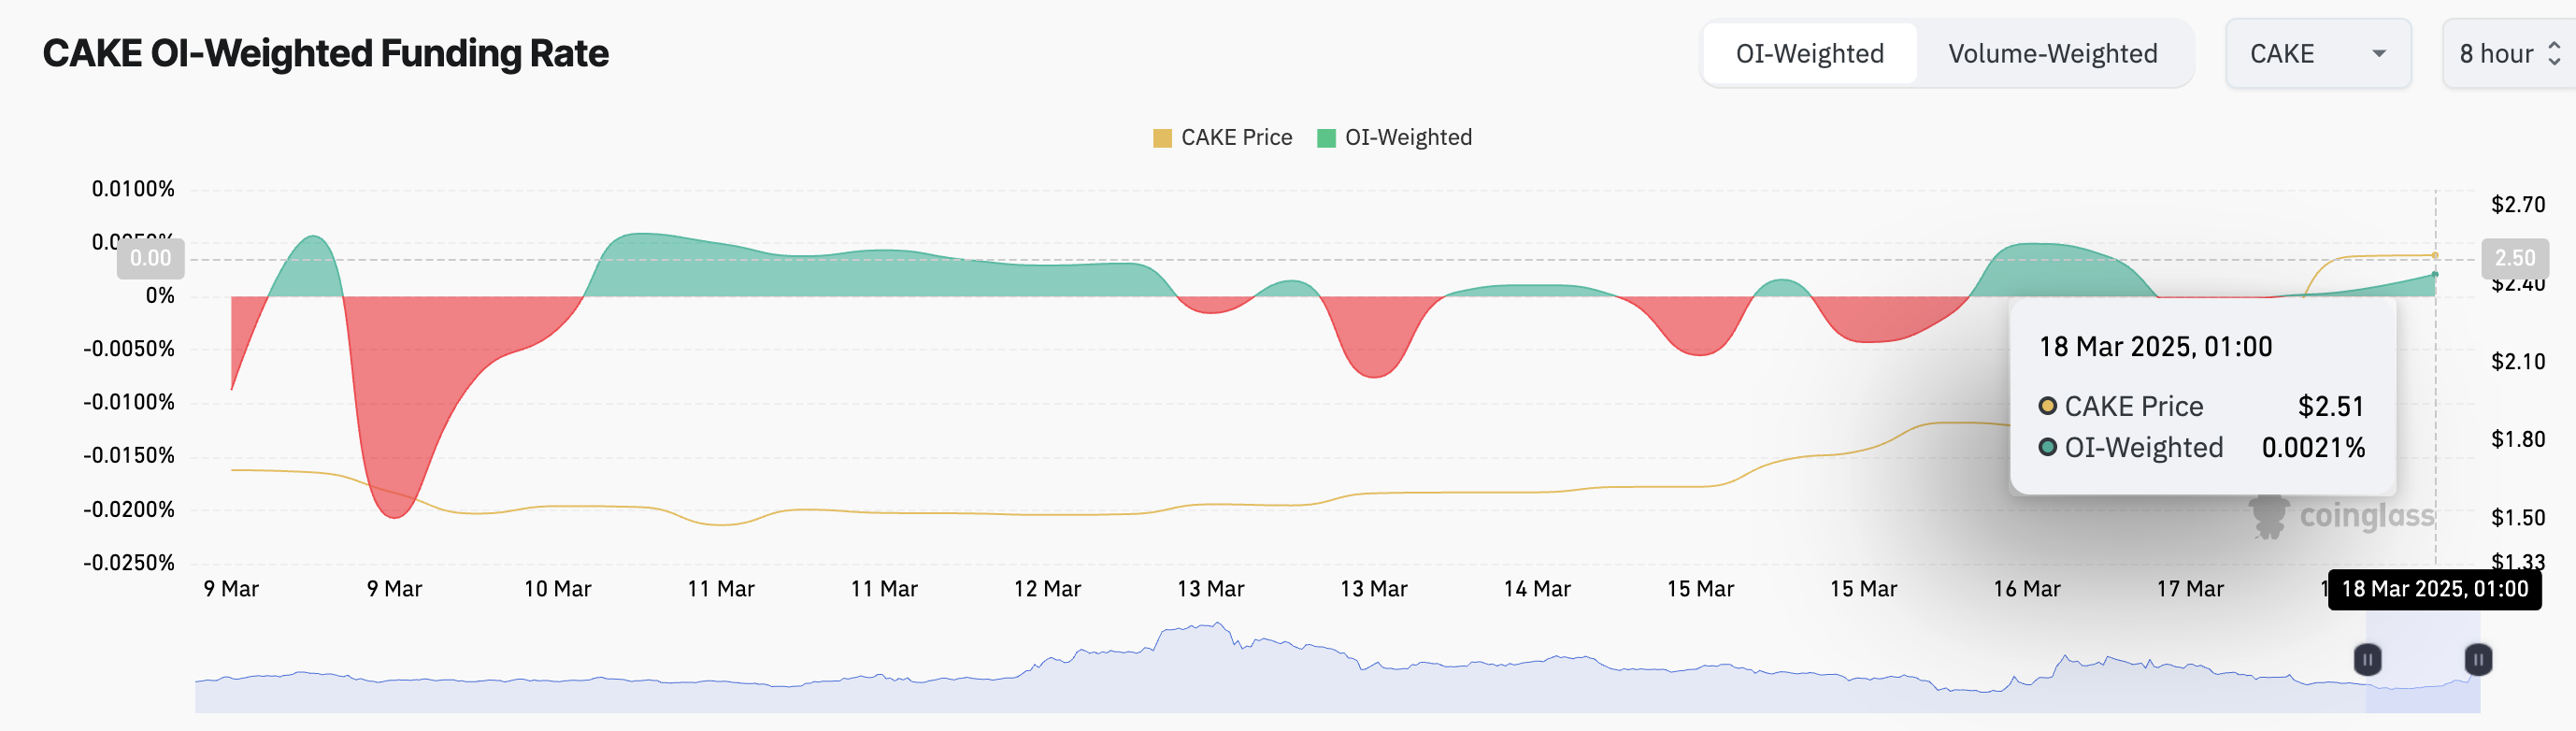
The funding rate is a periodic fee exchanged between long and short traders in perpetual futures contracts to keep the contract price aligned with the spot market. A positive funding rate means long traders are paying short traders, indicating strong demand and bullish market sentiment for CAKE.
With rising inflows and growing demand, CAKE’s price performance suggests that traders are positioning for further upside. If demand continues at this pace, the token could extend its gains, drawing even more liquidity into PancakeSwap’s ecosystem.
CAKE Holds Strong Above 20-Day EMA—Bullish Momentum Builds
CAKE’s rally has pushed it significantly above its 20-day exponential moving average (EMA) which now forms dynamic support below its price at $1.93.
This moving average measures an asset’s average price over the past 20 trading days. It gives more weight to recent price data, making it more responsive to price movements than a simple moving average.
When an asset’s price climbs above the 20-day EMA, it signals bullish momentum, suggesting that buyers are in control and the asset may continue its upward trend.
If this trend persists, CAKE could extend its uptrend to $2.90.
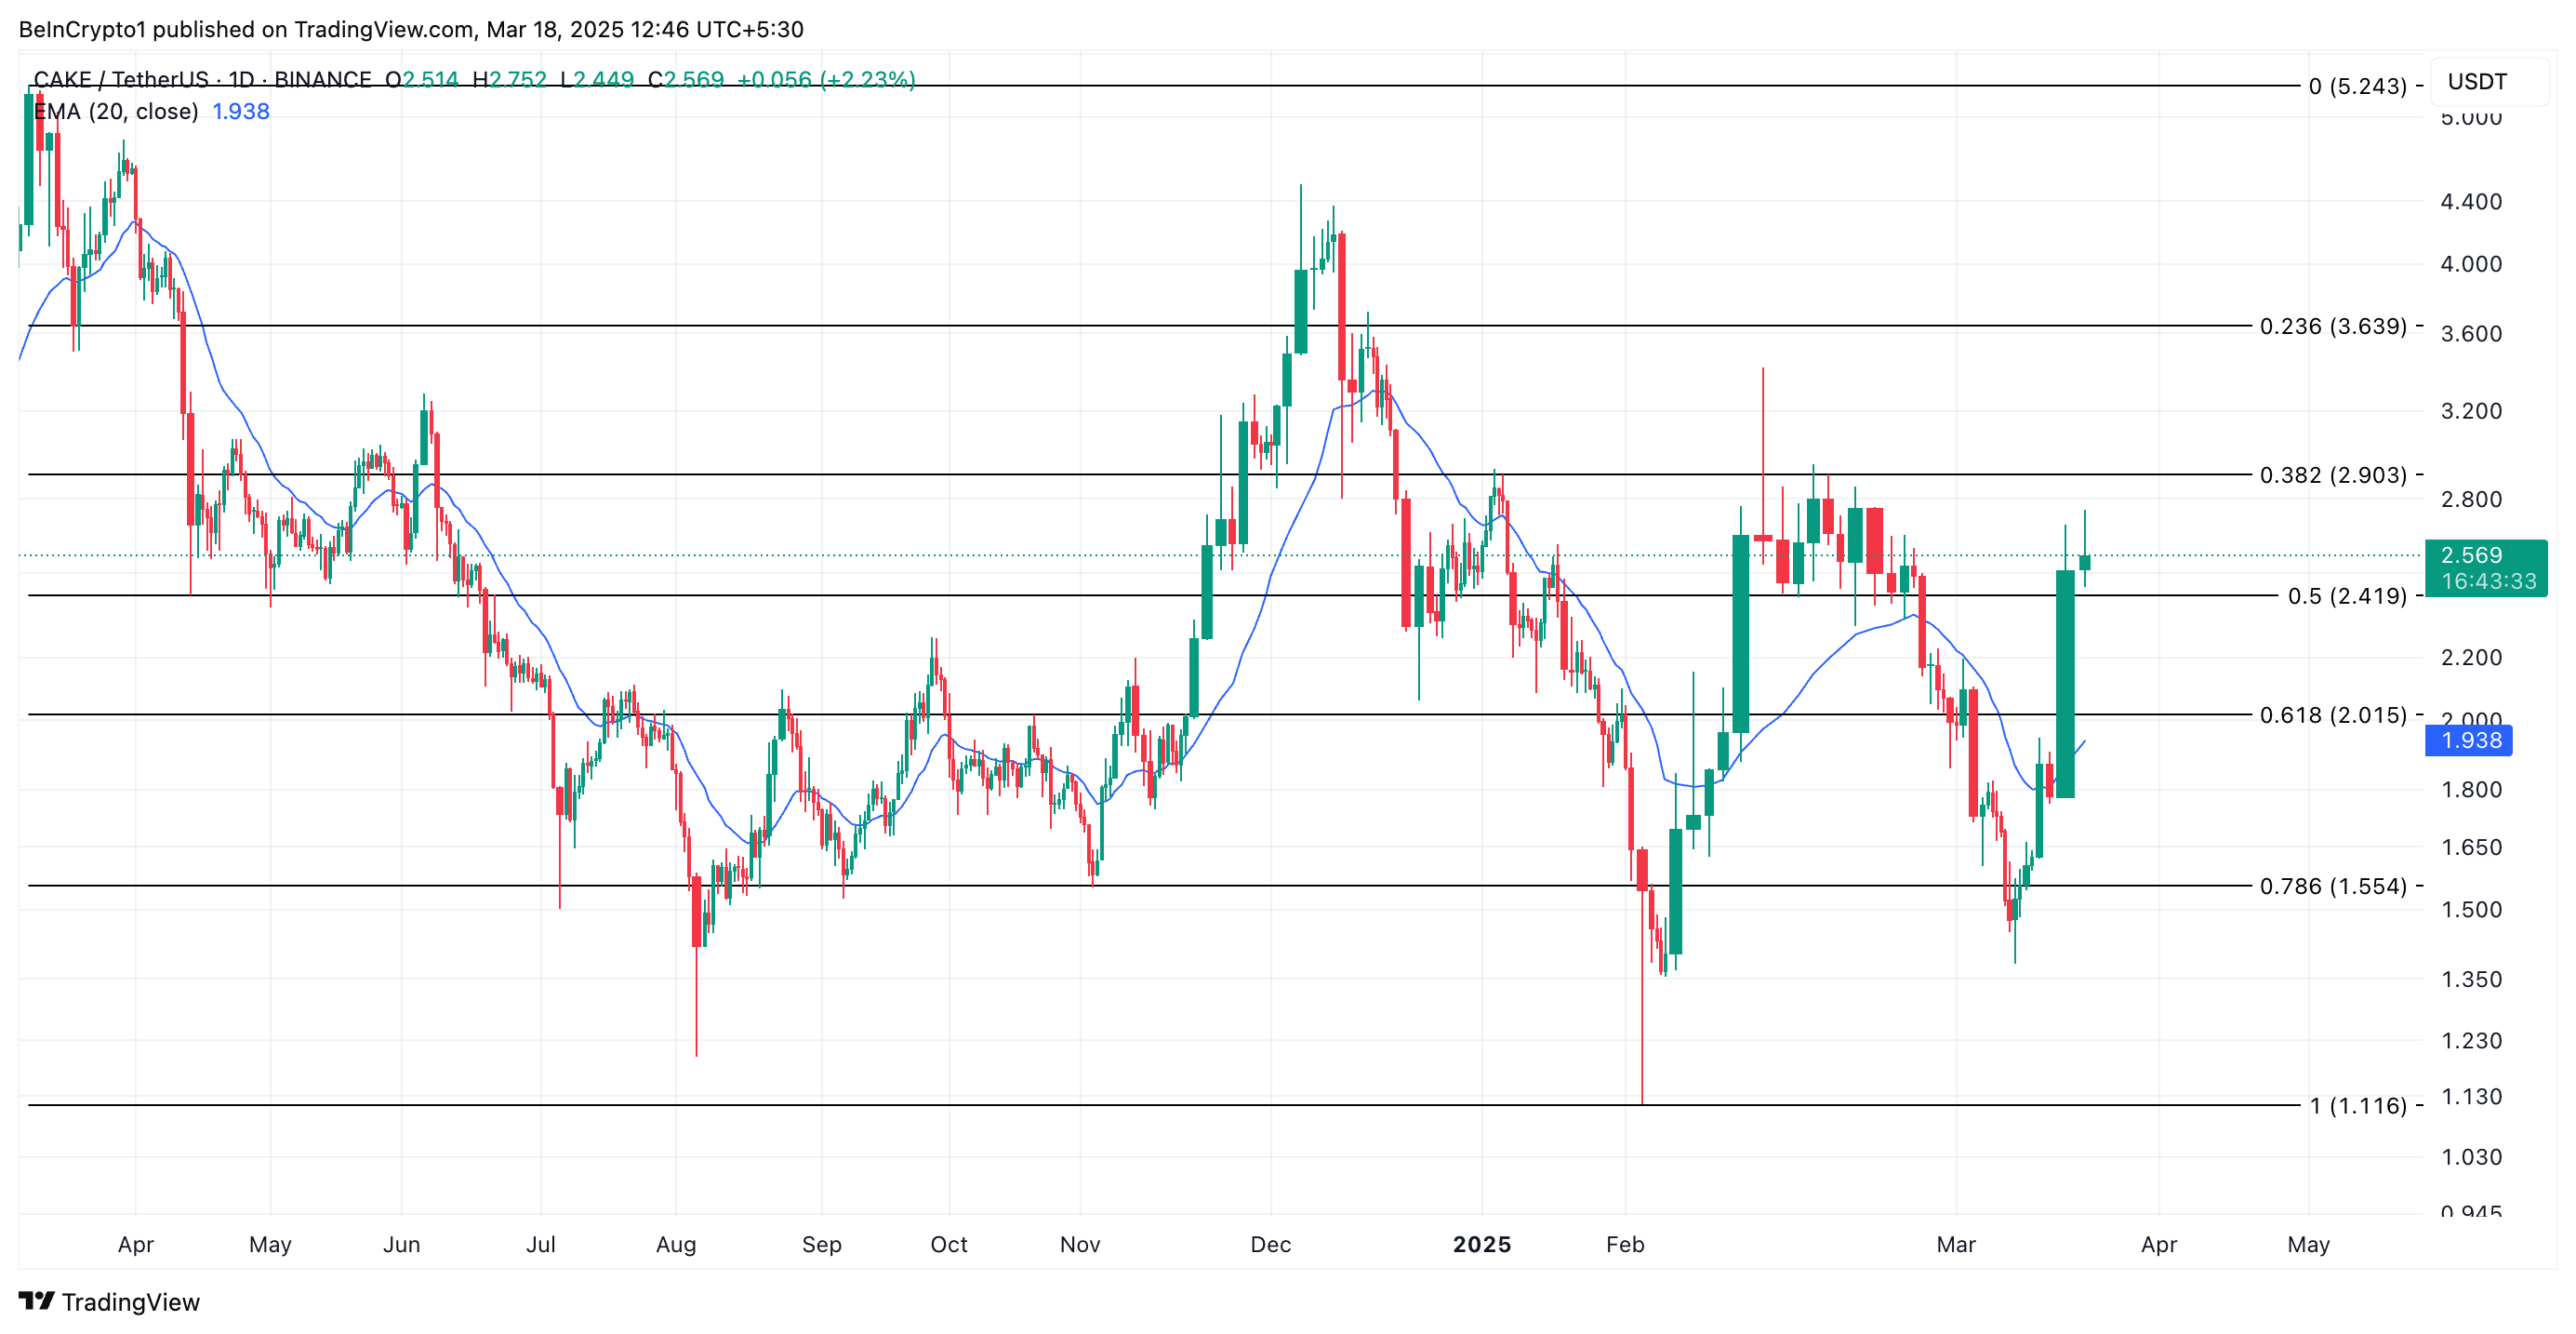
On the other hand, a resurgence in profit-taking activity could prevent this from happening. If CAKE demand stalls and it sheds its recent gains, its value could plunge to $2.41. If that support level fails to hold, the token’s price could drop to $2.01.
Disclaimer
In line with the Trust Project guidelines, this price analysis article is for informational purposes only and should not be considered financial or investment advice. BeInCrypto is committed to accurate, unbiased reporting, but market conditions are subject to change without notice. Always conduct your own research and consult with a professional before making any financial decisions. Please note that our Terms and Conditions, Privacy Policy, and Disclaimers have been updated.

Bitcoin Pepe thrives as risk aversion hurts Bitcoin, Dogecoin

Bitcoin ETFs Inflows Reach $274 Million: Is Demand Returning?
New Bitcoin Whales Adds Over 200,000 BTC to Their Holdings

CAKE Spot Inflows Surge to $3.5M, Fueling 21% Price Rally
Hyperliquid Surpasses $1 Trillion in Perps Trading Volume

Crypto.com Reverses 2021 Token Burn, Re-Mints 70B CRO


-

 Bitcoin24 hours ago
Why Are the Purchases Shrinking?
-

 Market24 hours ago
Chaos Labs, Monad & Voltix
-

 Market11 hours ago
Cardano (ADA) Bulls Advance as Sellers Lose Grip
-
 Altcoin23 hours ago
MUBARAK Coin Price Soars 22% Amid This Binance Announcement, What’s Next?
-

 Bitcoin19 hours ago
French Banker Warns of Crypto-Induced Crisis
-

 Market19 hours ago
Can Bulls Push Price to $0.26?
-
 Altcoin22 hours ago
GT’s Comeback Journey Amid the Crypto Winter
-
 Market22 hours ago
Trading Platform for USA and Canada
 Arabic
 Chinese (Simplified)
 Dutch
Dutch English
 French
 German
 Italian
 Portuguese
 Russian
 Spanish
 Vietnamese