
Market
3 Altcoins to Watch in the Third Week of March 2025

The crypto market’s volatility has left altcoins in limbo, uncertain about potential gains or losses, and heavily reliant on external factors. These influences could determine whether a recovery rally occurs.
BeInCrypto has analyzed three key altcoins for investors to watch in the third week of March and what direction they could take.
Solana (SOL)
Solana’s price is currently at $129, positioning itself for a potential bullish breakout. On March 17, the Chicago Mercantile Exchange (CME) will launch SOL Futures, a significant event for the altcoin. As CME is one of the largest derivatives exchanges globally, this could drive substantial institutional inflows into Solana.
This development could inject bullish momentum into SOL, pushing the altcoin higher. The critical resistance level to watch is $161, which would require a 24% price surge. However, for this rally to materialize, SOL must first breach the $135 and $148 resistance levels, paving the way for continued gains.
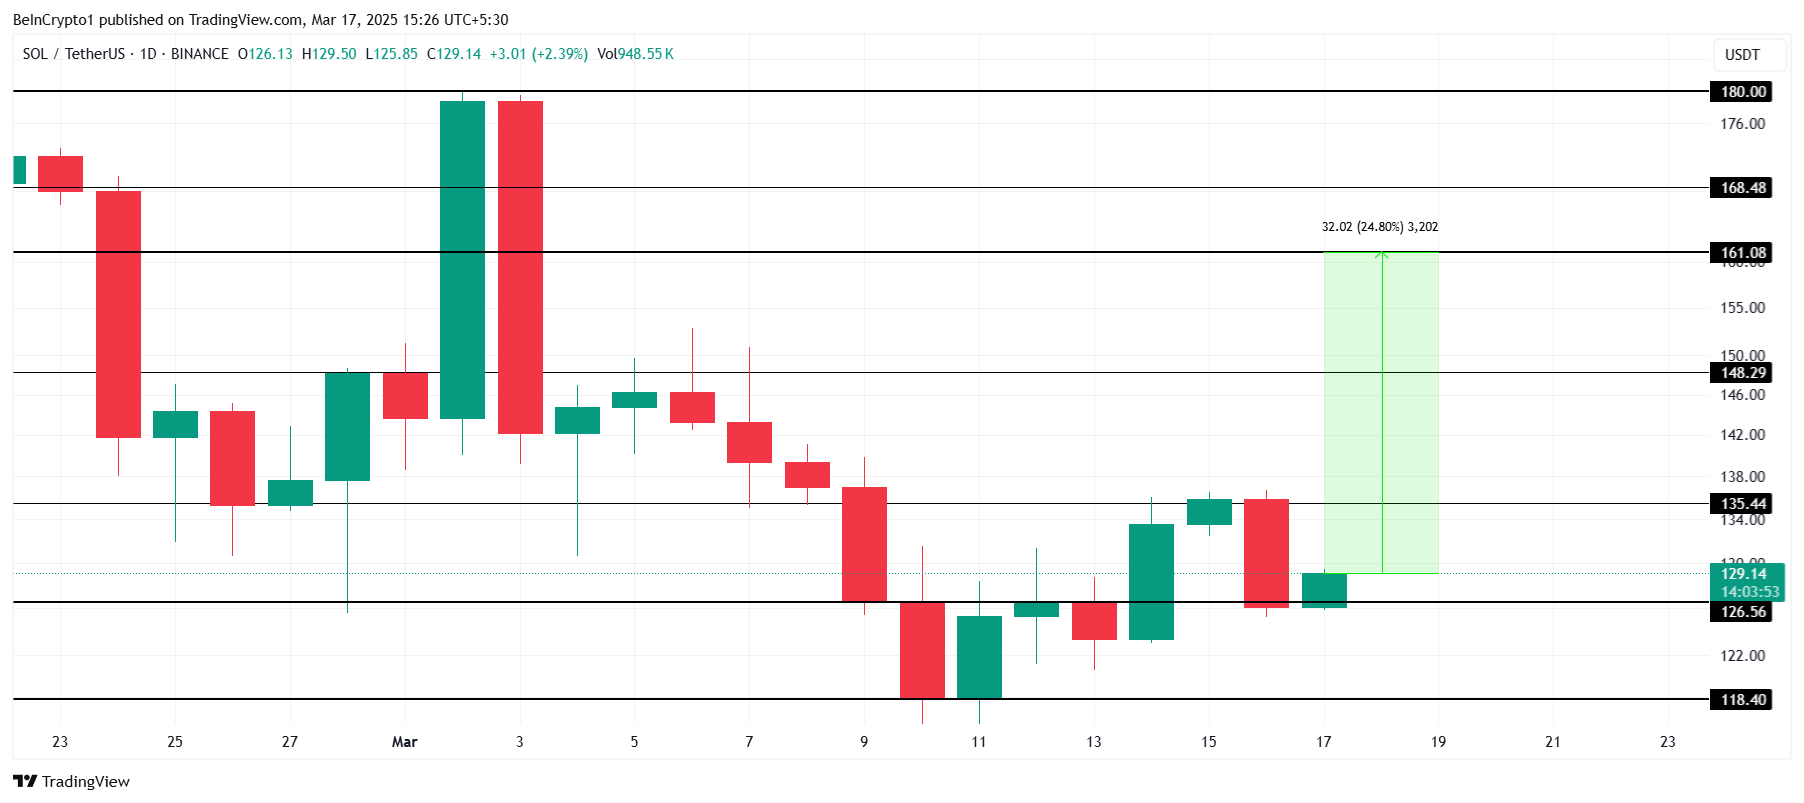
If Solana fails to break through either $135 or $148, its price could retrace. A drop below these levels could send SOL back to $126 or lower to $118. This scenario would invalidate the bullish outlook, delaying any potential recovery and exposing the altcoin to further downside risk.
Mantle (MNT)
MNT price has surged 25% over the past week as anticipation builds for Mantle’s upcoming network upgrade. On March 19, the Mantle Network Mainnet will undergo a hard fork upgrade, activating EigenDA and ensuring compatibility with Ethereum’s future Pectra upgrade. This event is driving strong bullish sentiment for MNT.
In response to the upgrade, MNT is expected to see further gains, potentially reaching $1.00. Currently trading at $0.83, the altcoin needs to breach the $0.87 and $0.94 resistance levels to sustain its rally. A successful breakout above these levels could confirm the bullish trend.
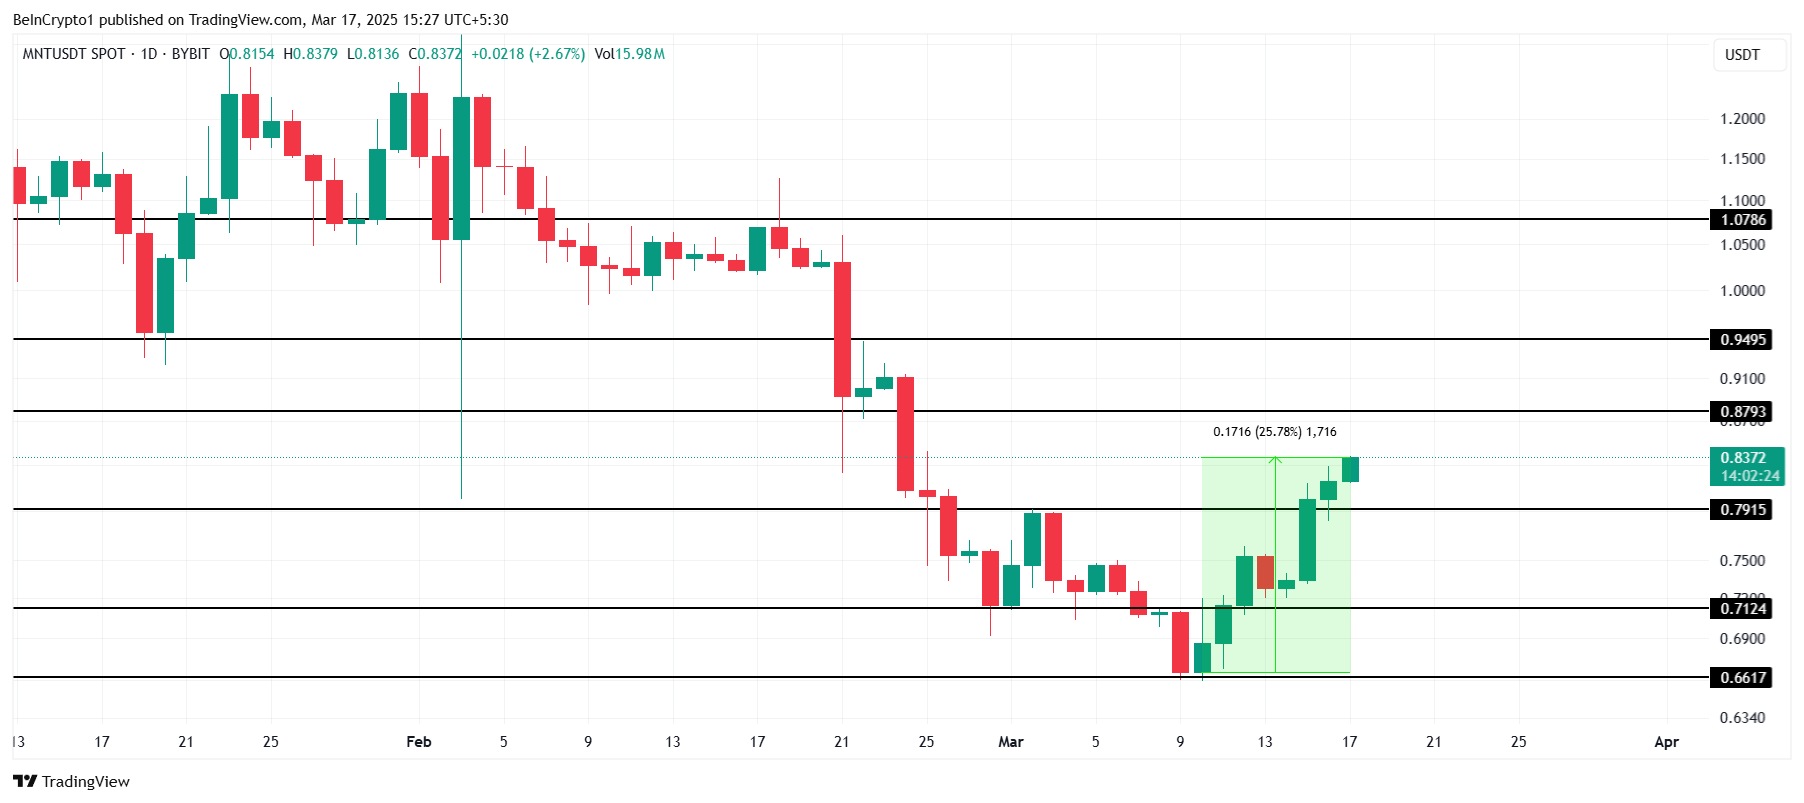
However, failure to surpass $0.87 could keep MNT stuck in consolidation. If the altcoin loses support at $0.79, it risks falling further to $0.71. A drop to this level would invalidate the bullish outlook and shift market sentiment toward a bearish trend.
BNB
Another altcoin to watch in March, BNB’s price surged 19.5% this week, reaching $635 at the time of writing. The altcoin successfully broke through the key resistance block between $587 and $619. With bullish momentum building, BNB appears poised for further gains, provided market conditions remain favorable in the coming days.
One major catalyst is the upcoming Pascal hard fork on March 20. The upgrade will introduce EIP-7702 smart contract wallets, enhanced Ethereum Virtual Machine (EVM) compatibility, and improved developer flexibility. These enhancements could drive investor confidence, pushing BNB above $647 and potentially toward the $686 mark.
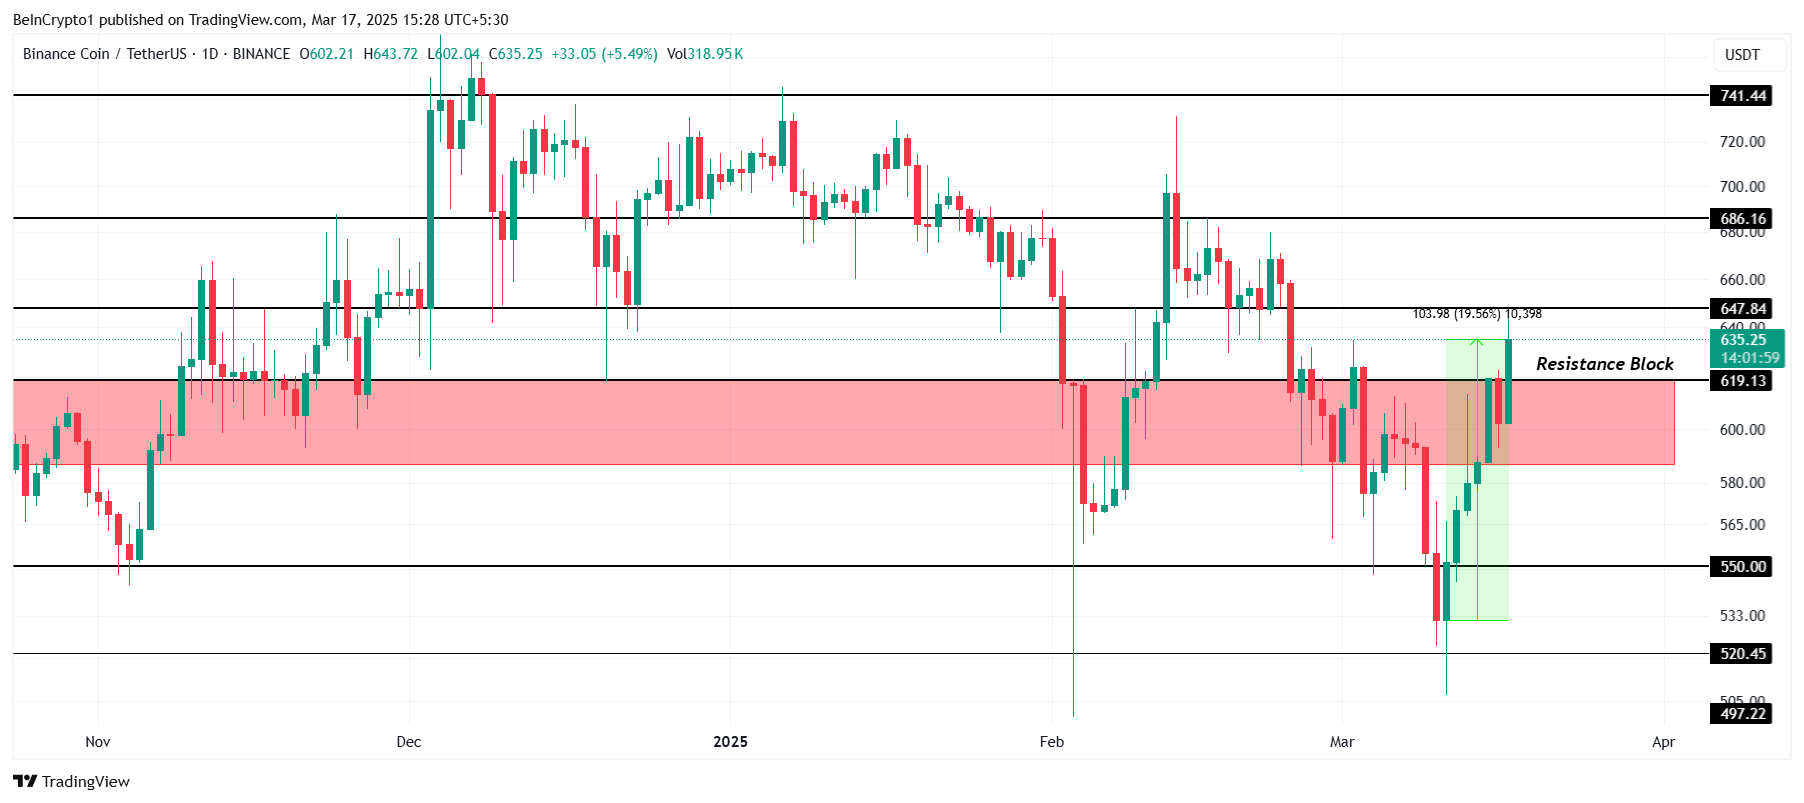
However, if the anticipated rally fails to gain traction, BNB could retreat to $619. Losing this support level may trigger further declines, sending the altcoin back through the resistance block and potentially testing the $550 support level, which would invalidate the bullish outlook.
Disclaimer
In line with the Trust Project guidelines, this price analysis article is for informational purposes only and should not be considered financial or investment advice. BeInCrypto is committed to accurate, unbiased reporting, but market conditions are subject to change without notice. Always conduct your own research and consult with a professional before making any financial decisions. Please note that our Terms and Conditions, Privacy Policy, and Disclaimers have been updated.


Cardano (ADA) is down nearly 8% over the past 30 days but has gained almost 3% in the last 24 hours as short-term momentum picks up.
The token’s market cap stands at $26 billion, while its trading volume has surged 30% in the past day, reaching $903 million. Technical indicators are starting to show early signs of a potential trend reversal after a period of bearish pressure. Here’s a closer look at the key signals and price levels shaping ADA’s outlook this week.
ADA BBTrend Is Now Positive After 6 Days
Cardano’s BBTrend has just turned positive, ending a six-day streak in negative territory, which included a low of -26.13 on March 12. The indicator is now sitting at 0.83, signaling a shift in momentum after the recent downtrend.
While this is still a relatively low reading, the move back into positive territory could be an early sign of strengthening buying pressure.
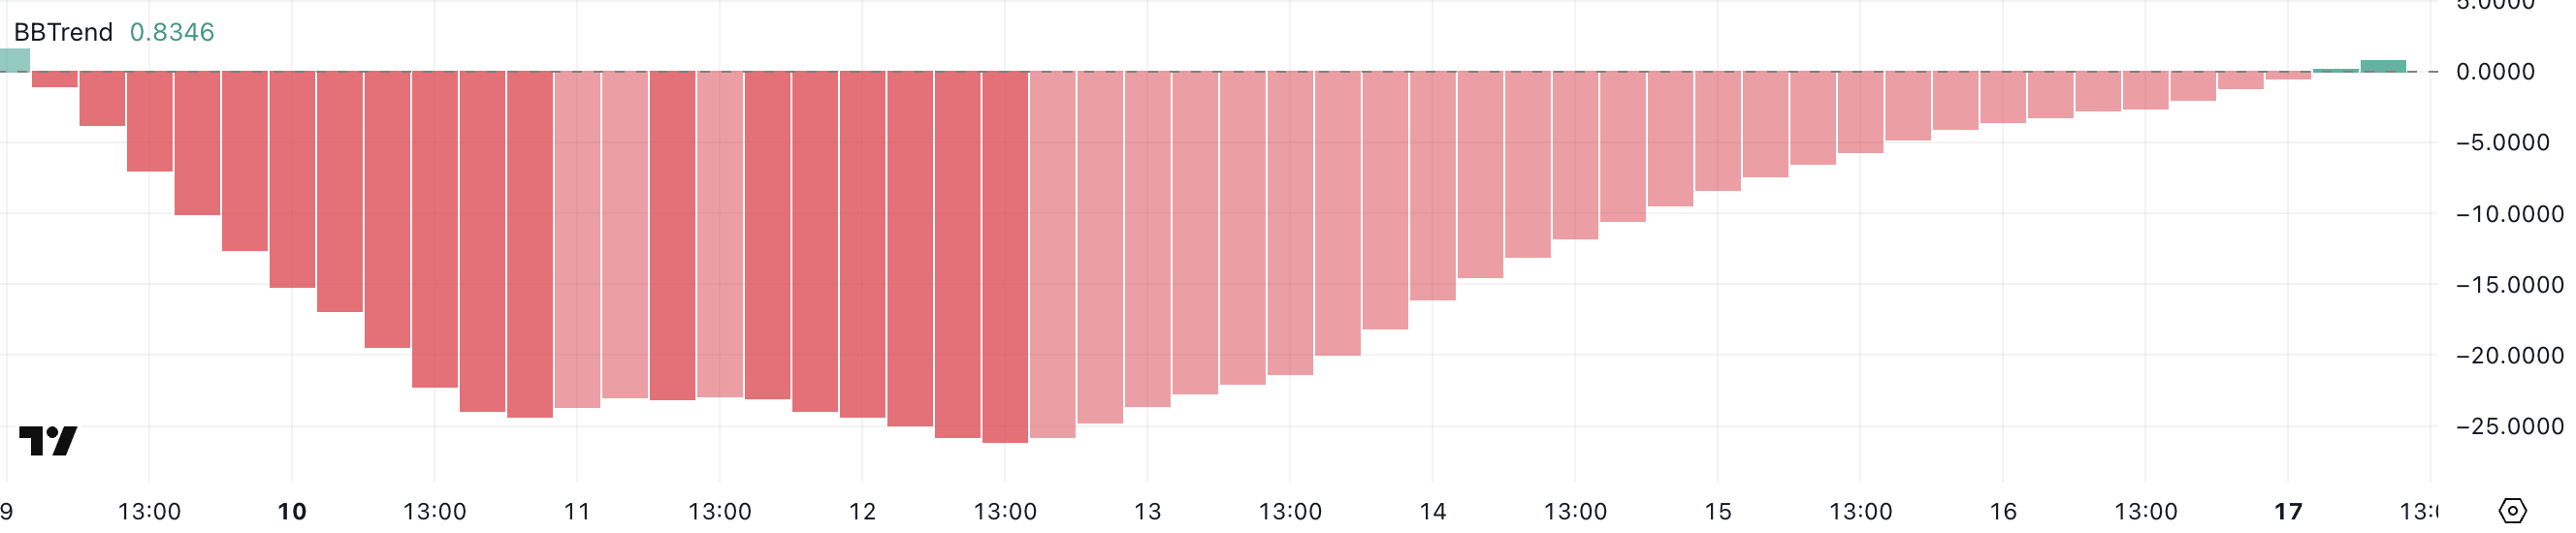
The BBTrend (Bollinger Band Trend) measures the strength and direction of price movement relative to the Bollinger Bands. Positive values indicate an uptrend, while negative values point to a downtrend.
Since ADA’s BBTrend hasn’t risen above 10 since March 8, the current reading of 0.83 suggests that, although the bearish pressure has eased, momentum remains weak. For a stronger bullish signal, traders would typically look for the BBTrend to push above 10, confirming a more decisive upward move.
Cardano DMI Shows Sellers Are Losing Control
Cardano’s DMI chart shows that its ADX has dropped to 13.7 from 17.5 in the past 24 hours, suggesting a weakening trend strength. While the ADX is still signaling a trend, the lower reading points to reduced momentum compared to the previous day.
The Average Directional Index (ADX) measures the strength of a trend, regardless of its direction.
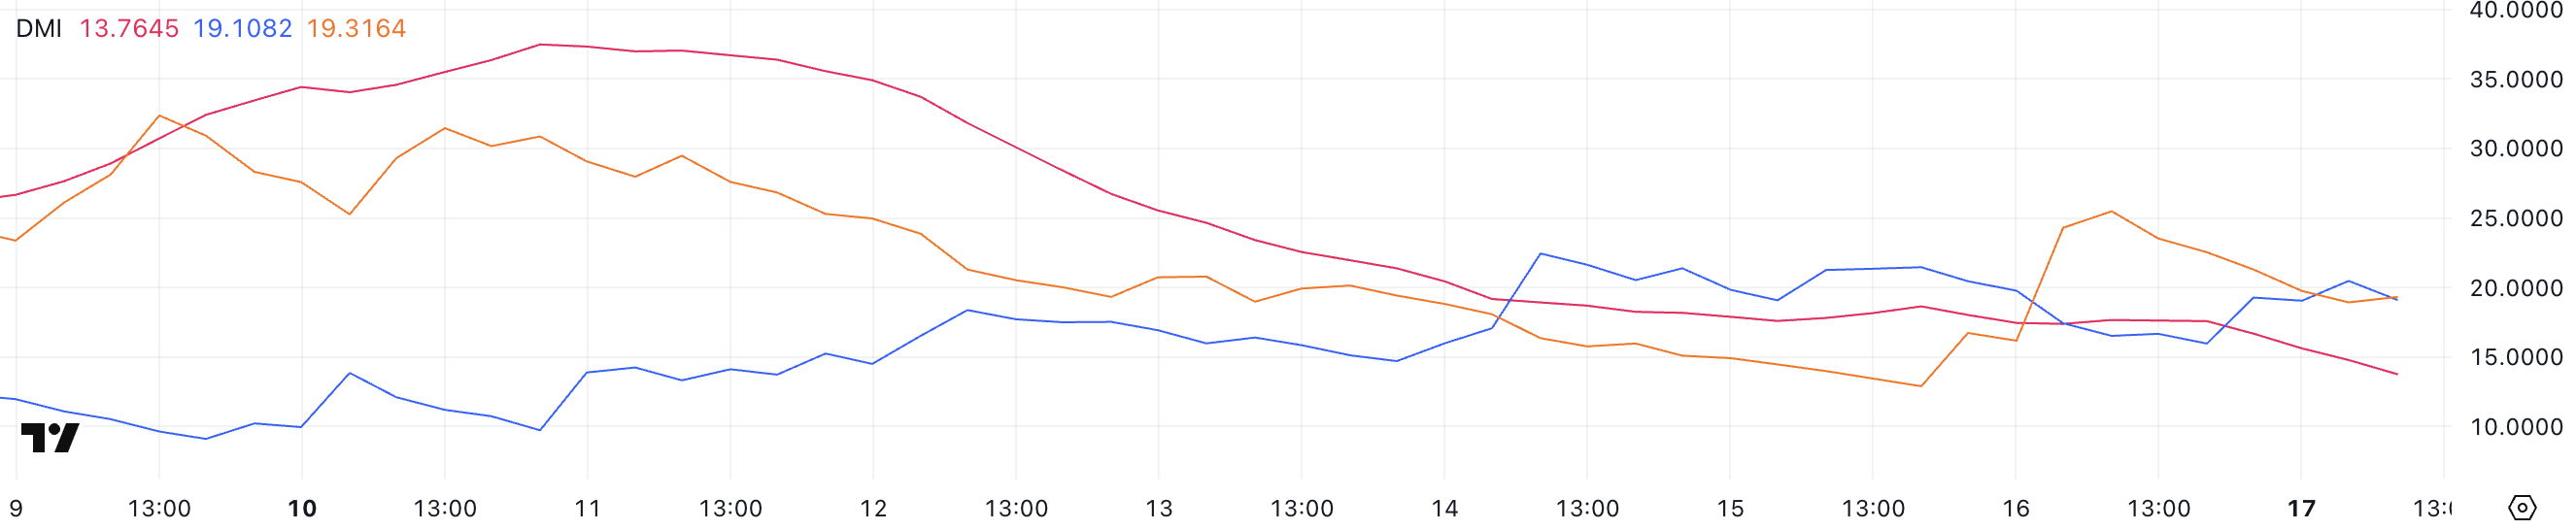
Readings above 25 indicate a strong trend, while readings below 20 often signal a weak or range-bound market. Currently, ADA’s +DI has risen to 19.1 from 15.96, while the -DI has dropped to 19.31 from 25.48, showing that bearish momentum is fading as bullish pressure slowly builds.
With the +DI and -DI lines close to crossing, ADA appears to be in the early stages of attempting to reverse from a downtrend to a potential uptrend, though a stronger ADX would be needed to confirm a solid trend shift.
Will Cardano Rise Above $1.10 Soon?
ADA’s EMA lines have shown signs of consolidation over the past few days, though the overall structure remains bearish. Short-term EMAs are still positioned below the long-term ones.
However, recent signals from both the BBTrend and DMI indicators suggest that this trend could be shifting, with early signs of bullish momentum building.
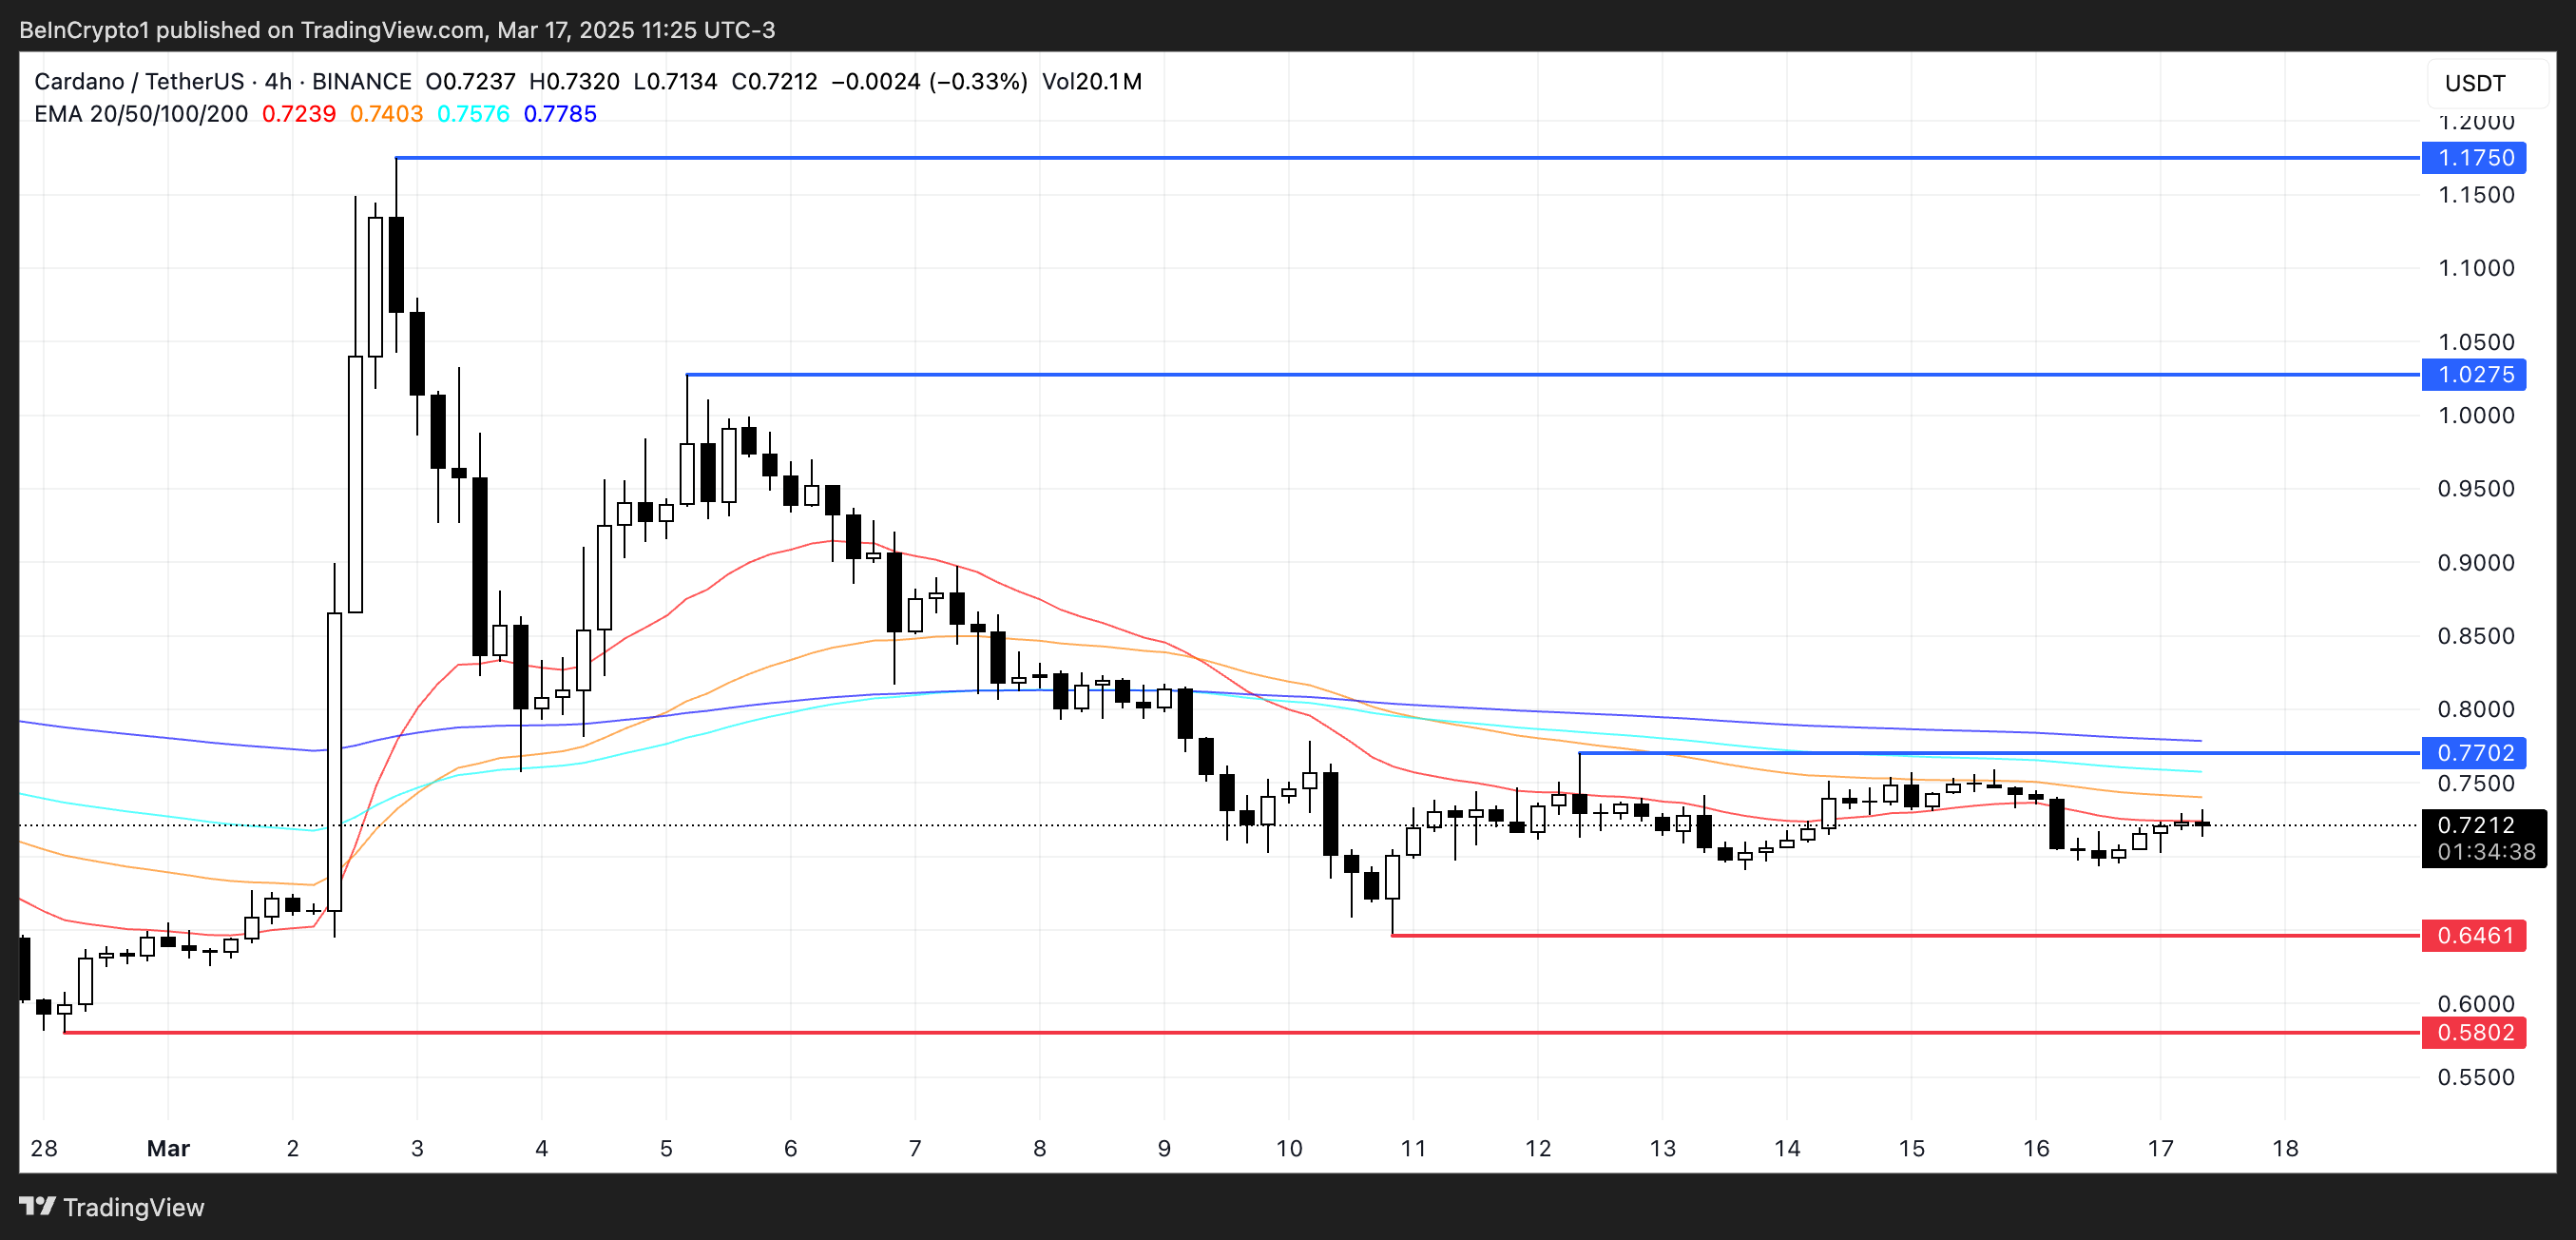
If Cardano’s price manages to confirm an uptrend, it could first challenge the resistance at $0.77. A breakout above this level may open the path toward $1.02 and even $1.17, marking the first time ADA trades above $1 since March 3.
On the downside, if bearish pressure returns, ADA could retest support at $0.64, and a breakdown below this could push prices as low as $0.58, revisiting levels not seen since February 28.
Disclaimer
In line with the Trust Project guidelines, this price analysis article is for informational purposes only and should not be considered financial or investment advice. BeInCrypto is committed to accurate, unbiased reporting, but market conditions are subject to change without notice. Always conduct your own research and consult with a professional before making any financial decisions. Please note that our Terms and Conditions, Privacy Policy, and Disclaimers have been updated.

Solana just celebrated its fifth birthday, and a recent study shows highly exaggerated USDT volatility on the network’s transport layer. This suggests a high level of speculative interest in the platform, fueled by the meme coin craze and other factors.
Web3 payments solutions platform Mercuryo shared this insight exclusively with BeInCrypto.
Solana’s Extreme USDT Volatility
Solana, the second-largest blockchain in the industry, just celebrated its fifth birthday. Its genesis block was mined on March 16, 2020. In honor of this milestone, Web3 infrastructure firm Mercuryo conducted a study on it.
According to this study, USDT volatility on Solana’s transport layer is currently at an “extreme” level.
“Solana captivates the interest of crypto traders across the globe. As Solana celebrates its fifth birthday, our transaction data on Tether tokens on the Solana transport layer suggests an unparalleled level of trading activity amid an explosion of interest in trading opportunities on Solana that we’ve seen over the past 12 months,” claimed Greg Waisman, Co-founder and COO at Mercuryo.
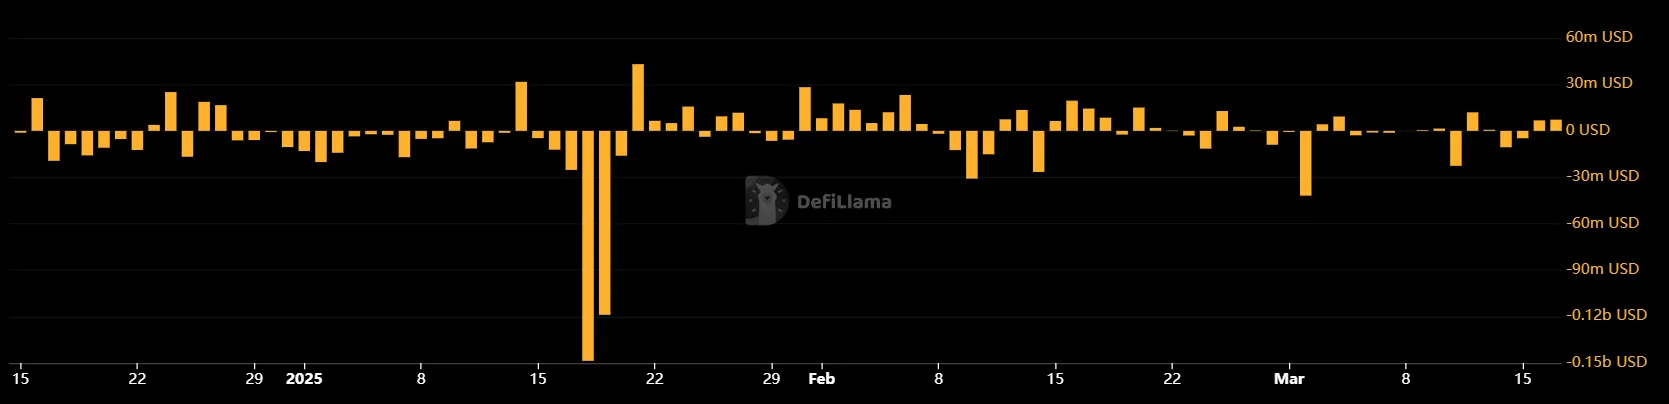
Solana’s USDT volatility has already spiked five times in 2025 alone. The network’s daily USDT trade volumes fluctuated dramatically in the past two months.
This consisted of three spikes and two drops, both of which were significantly smaller than the spikes. Both drops were in the 60%- 70% range, while the increases ranged between 100% and a whopping 137%.
More specifically, Solana saw a 100% increase in USDT trading on January 13. A week later, this activity dropped by 63% and again surged by 129% on January 27. This level of unprecedented capital movements is often rare for any blockchain network.
Mercuryo claims that this volatility is caused by several factors, but the explosion of Solana meme coins is particularly important. Thanks to major meme coin launchpads like Pump.fun, Solana trade volumes have spiked in recent months, even surpassing Ethereum on a few occasions. This rising interest helps fuel intense activity and these wild swings.
Over the past five years, its network has processed more than 408 billion transactions and nearly $1 trillion worth of value on decentralized exchanges. While Solana has shown gradual growth since 2023, the volatility of capital inflow has been chaotic, to say the least.
Ultimately, this enhanced level of volatility shows that Solana has a lot of interest among crypto traders. The network has grown remarkably over the last five years, and it’s already poised to make major advancements in the near future.
Disclaimer
In adherence to the Trust Project guidelines, BeInCrypto is committed to unbiased, transparent reporting. This news article aims to provide accurate, timely information. However, readers are advised to verify facts independently and consult with a professional before making any decisions based on this content. Please note that our Terms and Conditions, Privacy Policy, and Disclaimers have been updated.

BinaryX (BNX) has emerged as the market’s top gainer today, surging 41% in the past 24 hours. The altcoin currently trades at $1.75, noting a 412% uptick in daily trading volume during that period.
The rally comes as traders position themselves ahead of the highly anticipated BNX-to-FORM token swap, scheduled for March 21.
BNX Gains Momentum as Traders Bet Big Ahead of Token Swap
BinaryX launched the Four.Meme platform on July 3, 2024, and later rebranded to Four for a more cohesive identity. However, due to the widespread use of FOUR in the meme coin community, the team opted to change to FORM, announcing a 1:1 token swap from BNX to FORM scheduled for March 21.
As the market awaits this swap, traders have increased their accumulation of the BNX token. This is reflected by the altcoin’s open interest, which has climbed 33% in the past 24 hours and stands at $96 million at press time.
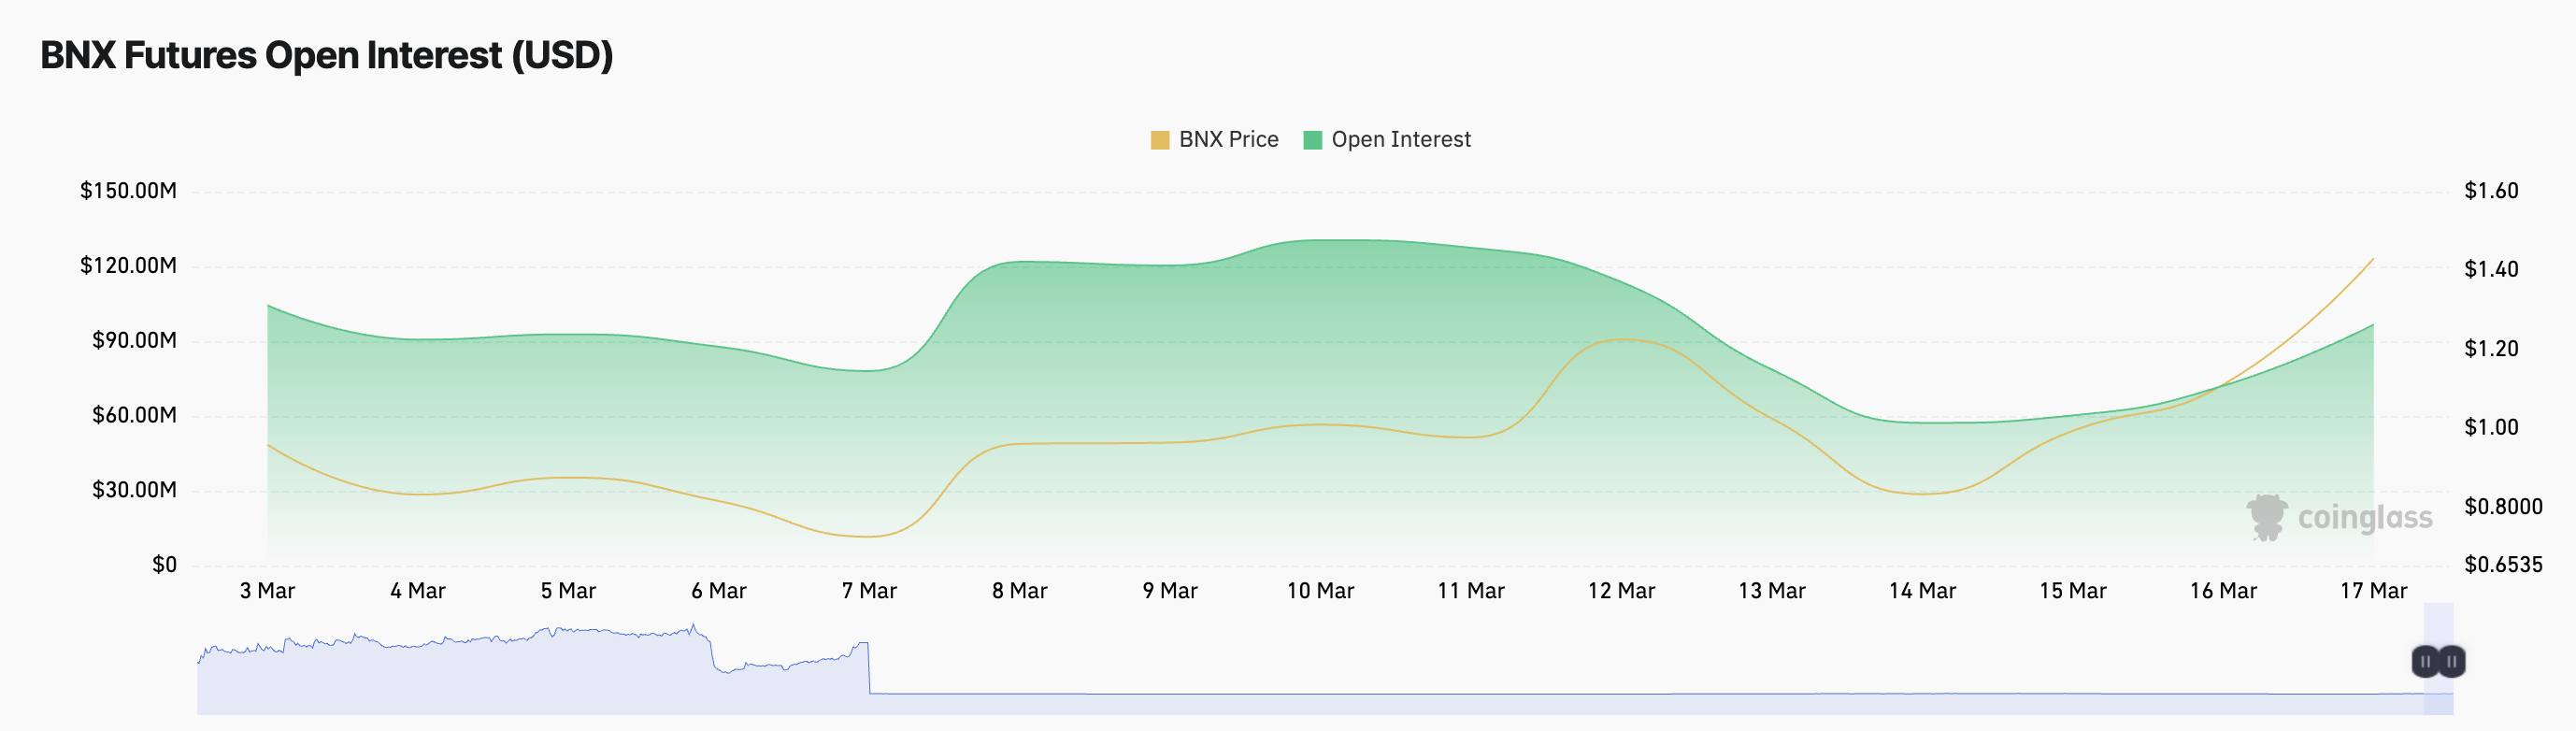
Open interest tracks the total number of outstanding derivative contracts, such as futures or options, that have not been settled. When it rises during a price rally like this, it indicates increasing market participation. It signals the bullish conviction among BNX holders as more traders open new positions to capitalize on the upward momentum.
Moreover, its funding rate is also positive, supporting this bullish outlook. This is currently at 0.339%.
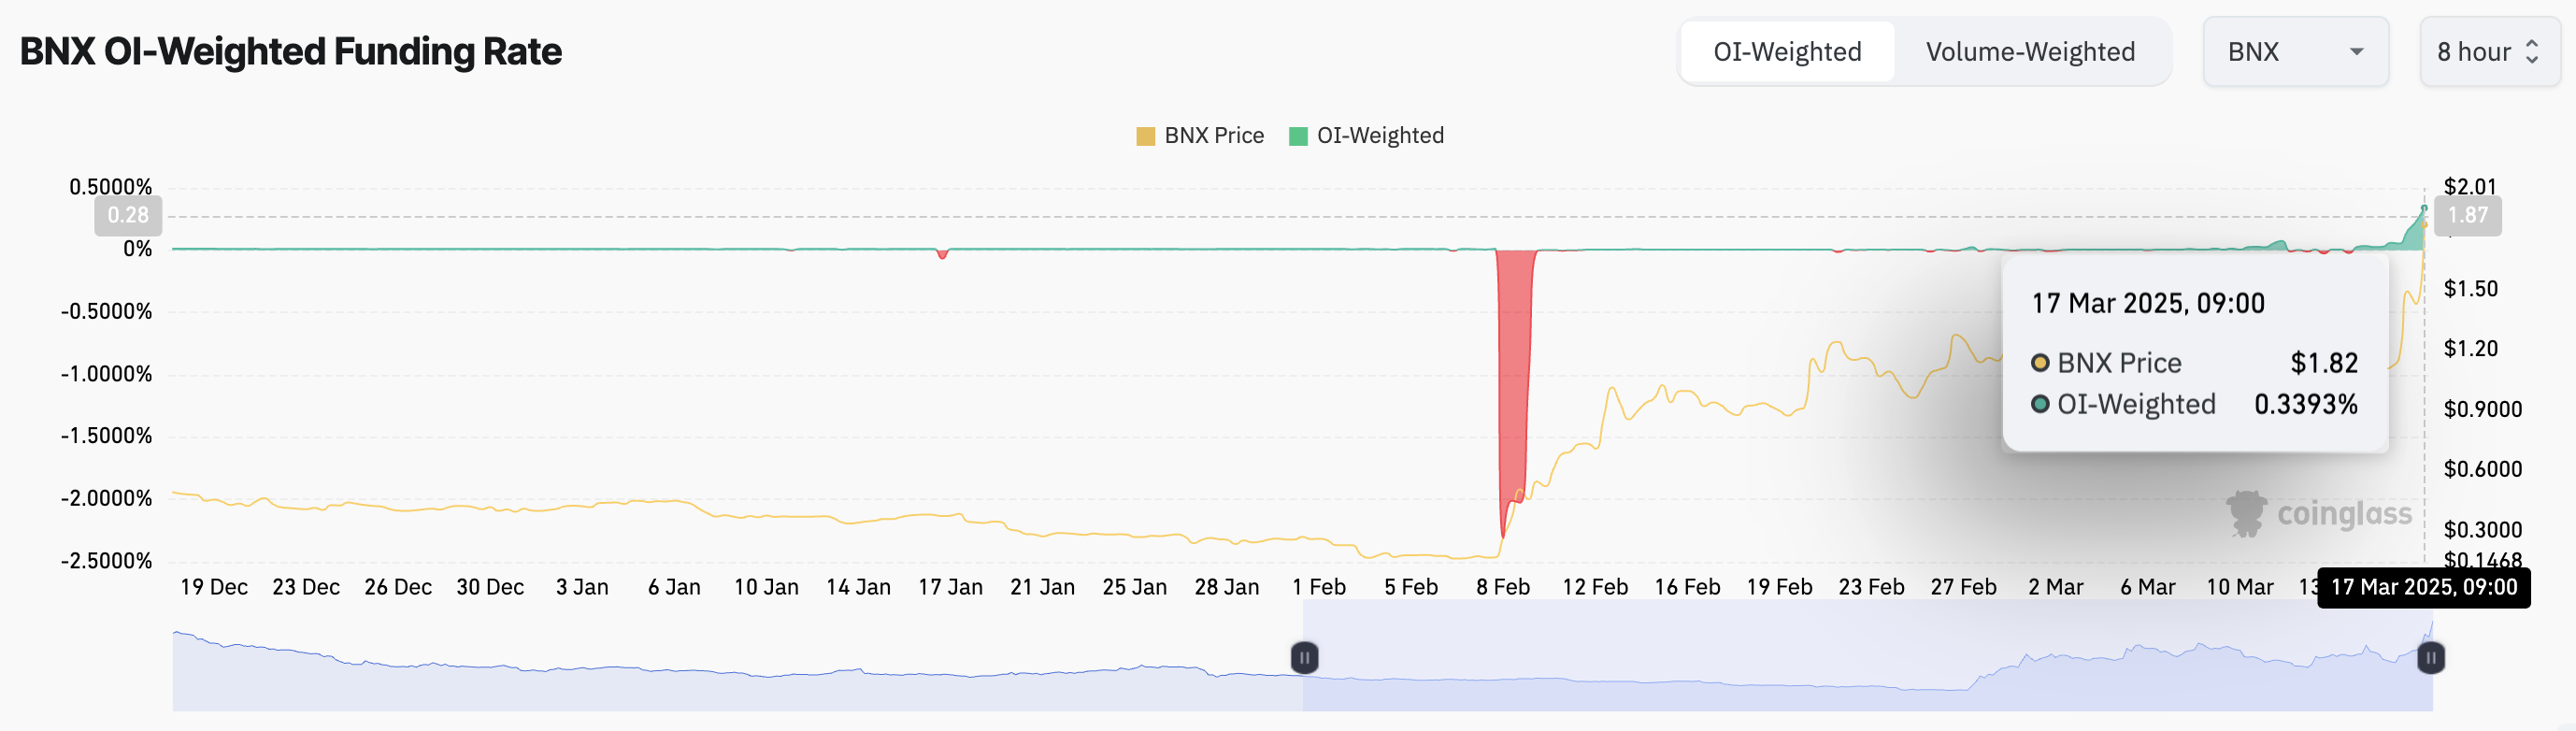
The funding rate is a periodic fee exchanged between long and short traders in perpetual futures contracts to keep prices aligned with the spot market. A positive funding rate such as this means long traders are paying short traders. It indicates strong buying pressure among BNX traders and confirms the bullish sentiment in the market.
BNX Trades Above Key EMA—Can Bulls Push It Past $1.85?
BNX trades above its 20-day exponential moving average (EMA) at its current price. This key moving average measures an asset’s price over the past 20 trading days, giving more weight to recent prices to help identify short-term trends.
When it sits below an asset’s price, it is a bullish signal suggesting that the market is in an uptrend and buyers are in control.
If BNX buyers strengthen their control and demand soars, they could drive the altcoin’s price past the resistance at $1.77 and toward $2.19.
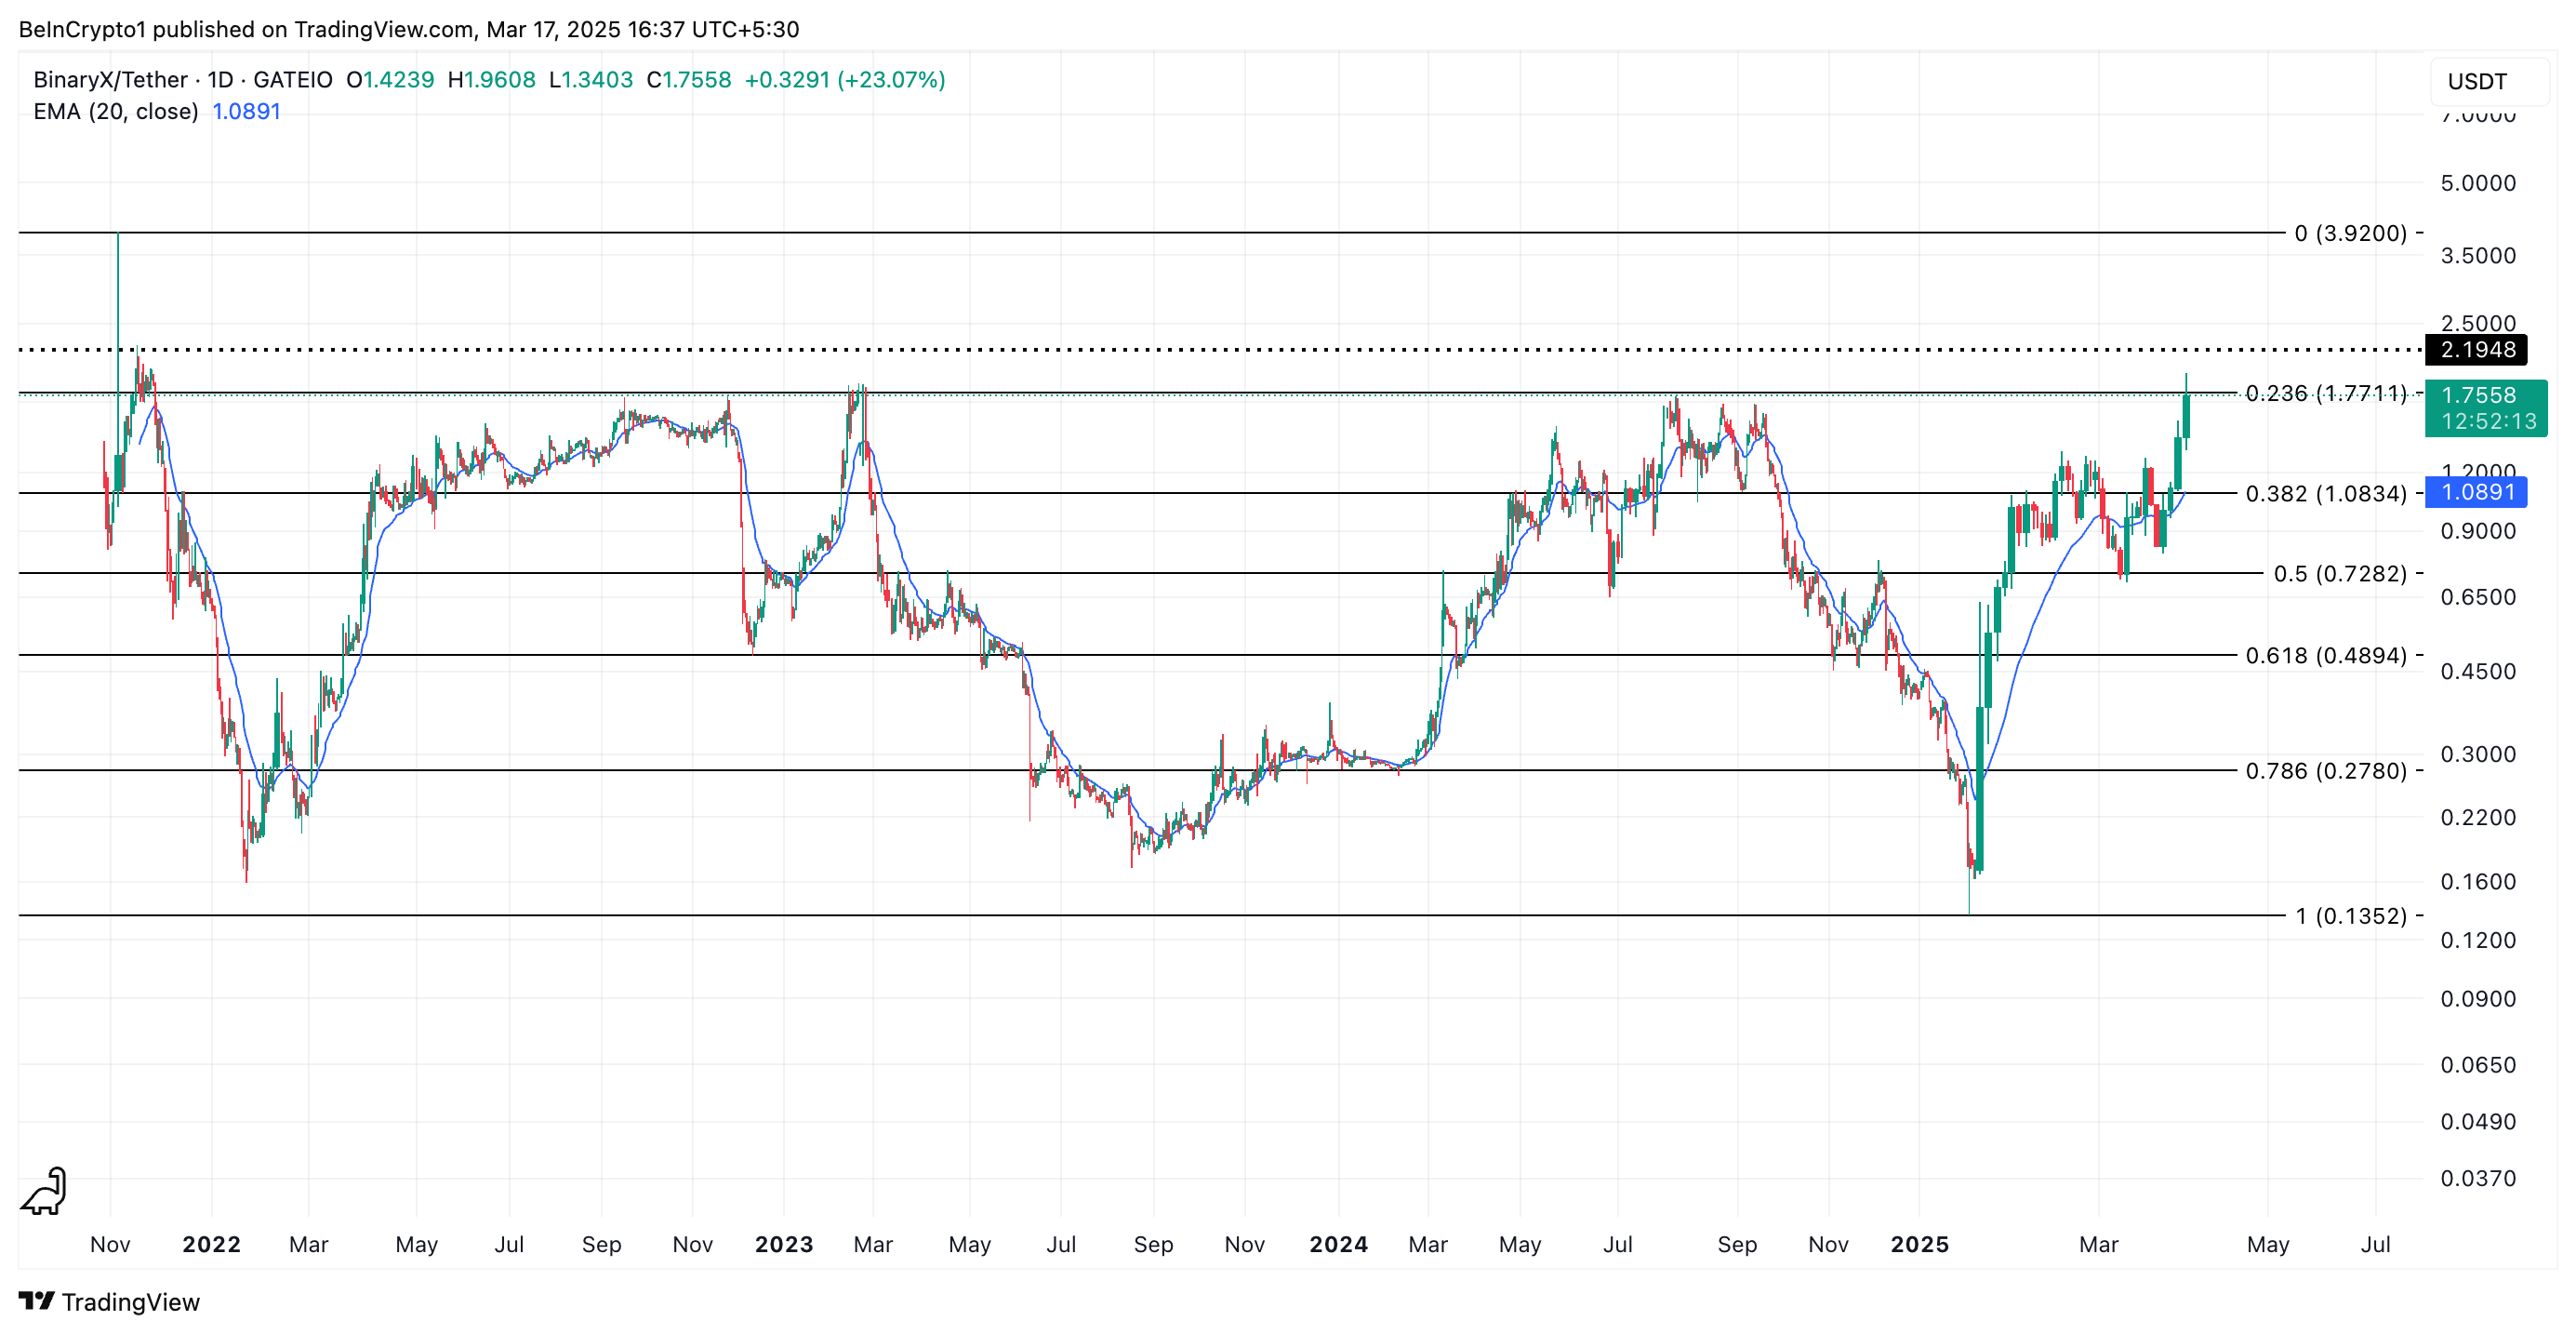
However, if selloffs gain momentum, BNX could shed its recent gains and plunge to $1.77.
Disclaimer
In line with the Trust Project guidelines, this price analysis article is for informational purposes only and should not be considered financial or investment advice. BeInCrypto is committed to accurate, unbiased reporting, but market conditions are subject to change without notice. Always conduct your own research and consult with a professional before making any financial decisions. Please note that our Terms and Conditions, Privacy Policy, and Disclaimers have been updated.

Cardano (ADA) Bulls Advance as Sellers Lose Grip
Extreme USDT Volatility Recorded On Chain

Ethereum Price Remains In Deep Correction As Standard Chartered Slashes ETH Target By 60%

BinaryX Token Swap Drives 41% Price Rally
XRP Price Targets $30 As Analyst Reveals Bullish Double Bottom Breakout

PancakeSwap (CAKE) Surges 40%, Is the Buying Phase Over?

2.52 Million Altcoins Are Ruining Crypto’s Future

Animoca Brands Valuation Tanks 75% In Two Years, Here’s Why

Crypto exchange BingX hacked for $43 million

Are The Big Players Losing Interest?

Hong Kong’s Securities Association Tips Authorities On Crypto Self-Regulation

Coinbase cbBTC Set to go Live on Solana
2.52 Million Altcoins Are Ruining Crypto’s Future
Animoca Brands Valuation Tanks 75% In Two Years, Here’s Why
Crypto exchange BingX hacked for $43 million
Are The Big Players Losing Interest?
Hong Kong’s Securities Association Tips Authorities On Crypto Self-Regulation
Coinbase cbBTC Set to go Live on Solana
-
 Altcoin16 hours ago
Binance Unveils Major Backing For MKR, EPIC, & These 3 Crypto, What’s Happening?
-
 Altcoin19 hours ago
BNB Price Can Hit Fresh ATH As Mubarak Leads Meme Coin Frenzy
-

 Bitcoin17 hours ago
Bitcoin Bulls Eye Comeback After $10 Billion Liquidation Shakeout—Analyst
-

 Bitcoin16 hours ago
Why Bitcoin And Crypto Will Not Recover Before US Equities Market: Expert
-

 Bitcoin13 hours ago
Why Are the Purchases Shrinking?
-

 Market13 hours ago
Chaos Labs, Monad & Voltix
-
 Altcoin18 hours ago
Lawyers React As Expert Hints At Ripple Vs SEC Case End
-

 Market18 hours ago
Solana Price’s Biggest Test: Breaching $180 Resistance