
Market
PEPE Whales Propel 11% Rally, Fueling Market Optimism

The frog-themed meme coin PEPE has surged 11% in the past 24 hours, significantly outpacing leading meme assets.
While Dogecoin (DOGE) and Shiba Inu (SHIB) have managed modest gains of 3% and 1%, respectively, PEPE has soared by double digits and is looking to extend its rally.
Whales Fuel PEPE’s Surge
PEPE’s rally comes amid a trend of significant whale acquisitions, which have fueled increased demand and bullish momentum for the meme coin.
In a March 12 post on X, on-chain sleuth Lookonchain noted that three whale wallets recently acquired 689.79 billion PEPE, valued at $5 million at current market prices, with all funds originating from Tornado Cash.
According to Lookonchain, the largest buyer, wallet 0x7A7D, spent 1,413.4 ETH ($2.72 million) for 437.7 billion PEPE, while 0x9212 and 0x7779 purchased 158.58 billion PEPE ($1 million) and 93.51 billion PEPE ($574,000), respectively.
Although the move has sparked speculation about the source of these funds, it has also triggered a resurgence in new demand for the meme coin. As its price grows, its daily trading volume also rallies. Over the past 24 hours, volume has surged by 18%, totaling $1.05 billion at press time.

When an asset’s price and trading volume surge simultaneously, it indicates strong market demand and increased buying activity, possibly driven by retail FOMO (fear of missing out) in PEPE’s case. This combination suggests bullish momentum in the meme coin’s market, signaling more gains if the trend continues.
Moreover, in the futures market, PEPE’s rising open interest highlights the capital inflow into it. As of this writing, the metric is at $120 million, rocketing 21% in the past 24 hours.
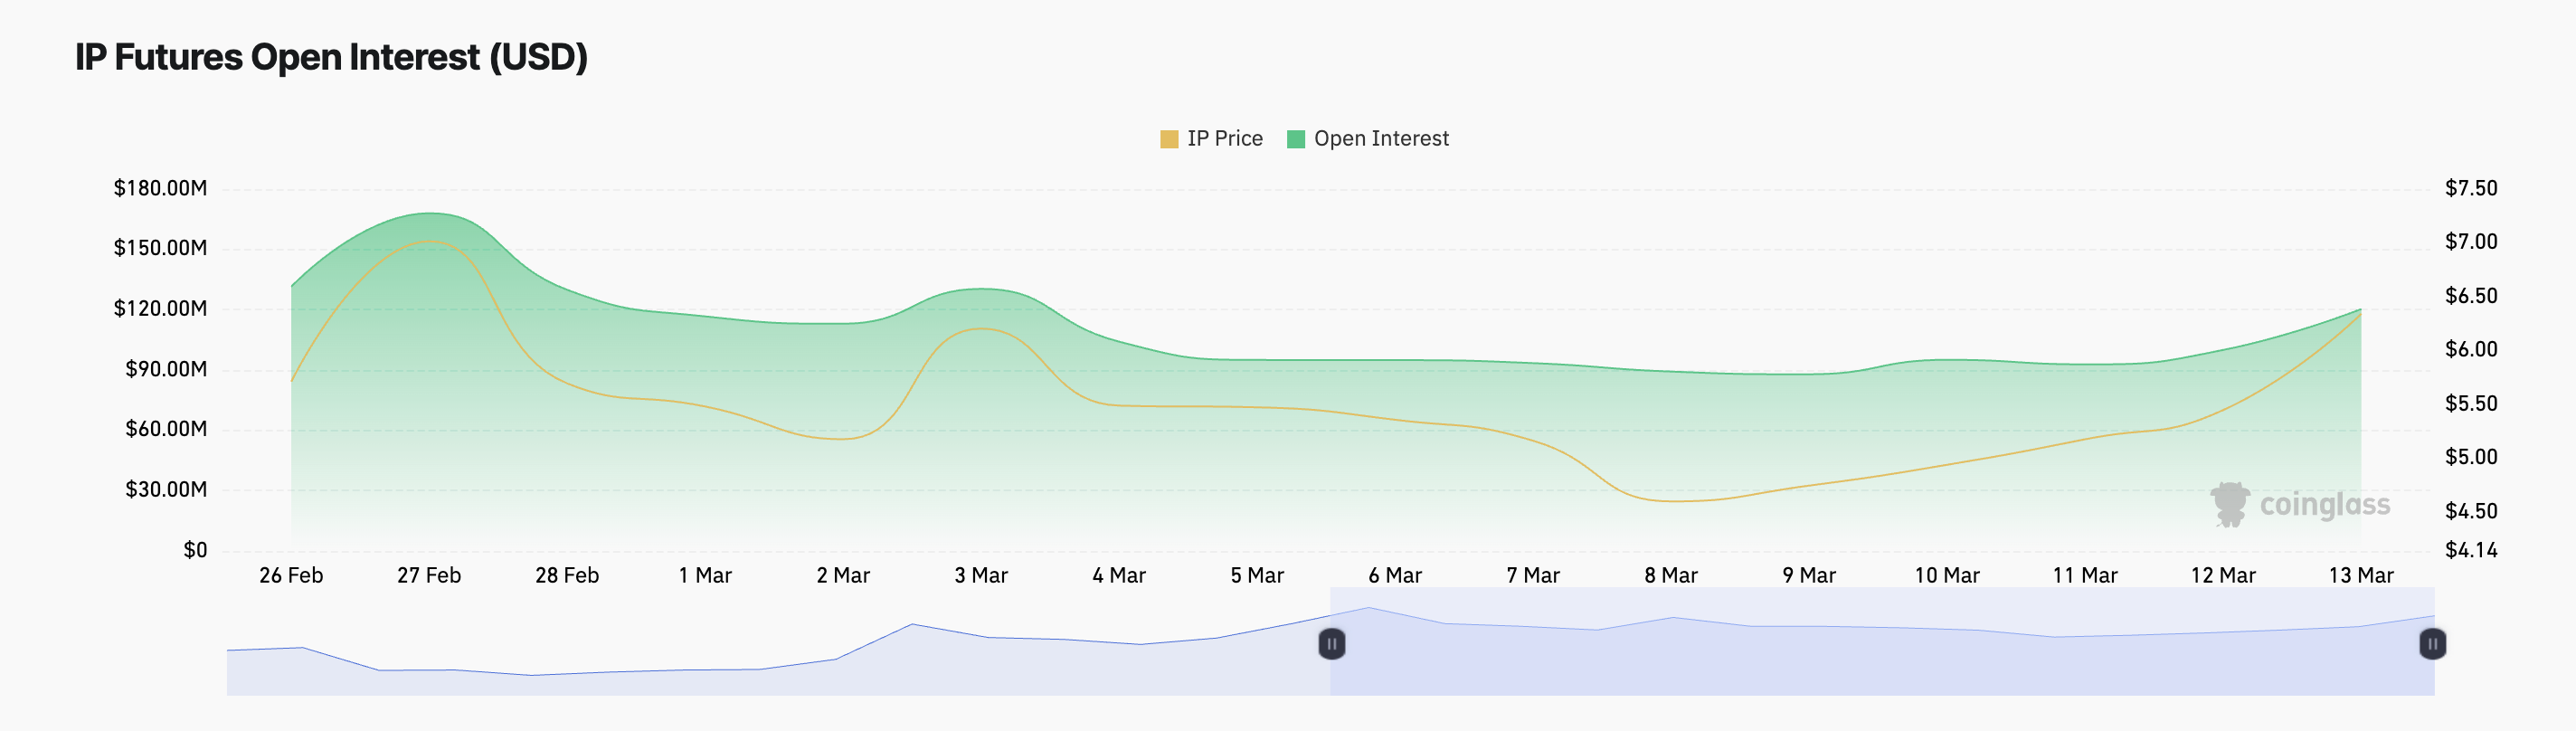
When an asset’s open interest climbs, especially during a price rally, it indicates increased market participation and capital inflow. If macro factors remain favorable and market sentiment remains bullish, there is a strong likelihood of a sustained PEPE rally.
PEPE Bulls Are Back: Key Indicator Confirms Strength
PEPE’s Elder-Ray Index has returned a positive value for the first time since January 19. This confirms the bullish shift in investors’ sentiment toward the altcoin.
The indicator measures the strength of bulls and bears in the market by analyzing the relationship between an asset’s price and a moving average.
When the Index is positive, it indicates that bulls are in control, suggesting upward momentum and potential price gains. If sustained, this trend could drive PEPE’s price toward $0.0000083.

Conversely, if buying activity weakens, PEPE could break below the support at $0.0000062 and fall to $0.0000048.
Disclaimer
In line with the Trust Project guidelines, this price analysis article is for informational purposes only and should not be considered financial or investment advice. BeInCrypto is committed to accurate, unbiased reporting, but market conditions are subject to change without notice. Always conduct your own research and consult with a professional before making any financial decisions. Please note that our Terms and Conditions, Privacy Policy, and Disclaimers have been updated.


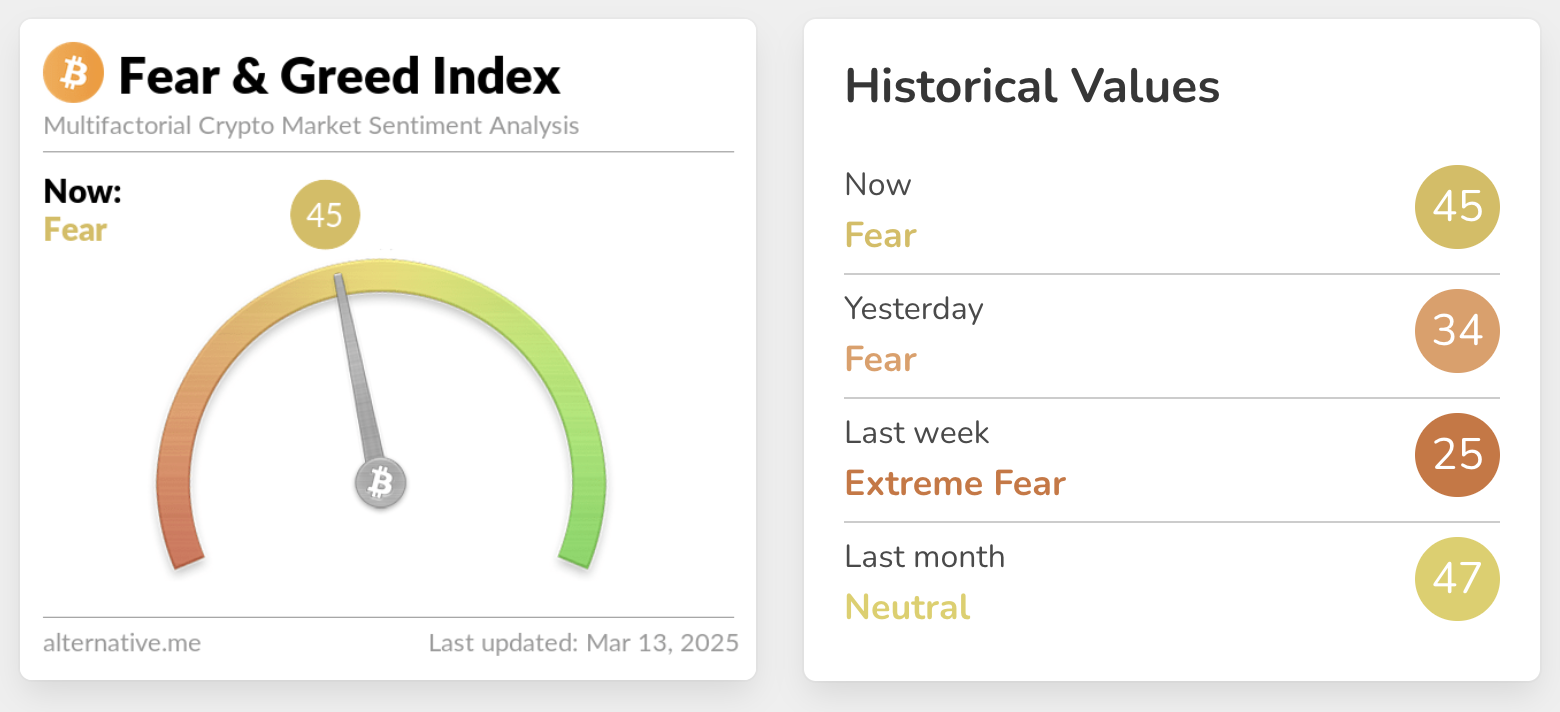
The Crypto Fear and Greed Index rebounded from its recent lows, showing diminished concerns of a bear market. However, several crypto stocks have posted huge losses, and gold is surging towards an all-time high.
The constant market volatility has helped exhaust short-term and speculative traders, rebuilding a little stability. The latest US CPI report was better than expected, and it may help create interest rate cuts for a more long-term solution.
Have We Avoided a Crypto Bear Market?
Over the past few weeks, rumors of a bear market have circulated through the crypto space. Two weeks ago, the Crypto Fear and Greed Index reached its lowest level since the FTX collapse, and recession fears have kept markets reeling.
However, the Index now reports a significant rebound, and crypto traders are evidently regaining some confidence.
The pertinent question, then, is why has this happened. By all accounts, crypto investors have a lot of reasons to fear a bear market.
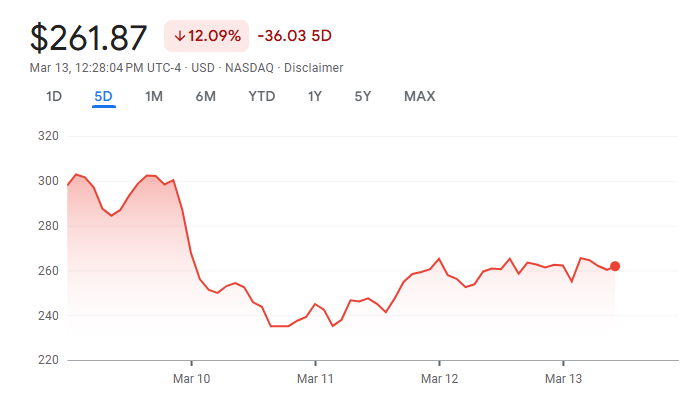
Several private firms that maintain significant Bitcoin holdings, like Metaplanet, MicroStrategy, and Marathon, all recorded double-digit percentage drops in their stock value this week.
Meanwhile, traditional assets like gold are spiking.
Gold is a risk-off asset, and cryptoassets are generally considered risk-on. If fears of an imminent recession define the TradFi market, this will have a negative impact on investments in the crypto space.
However, a few points could diminish fears of a crypto bear market. For one, the US CPI report for February was less bad than expected, which may help fuel future cuts to US interest rates.
Since the report dropped, Bitcoin and other cryptoassets recovered a little, and some corporate BTC holders like Tesla also posted a slight rebound. This optimism may or may not prove fragile, but it’s helped keep the market upright.
More importantly, the constant volatility in this market might be causing some benefits. As President Trump repeatedly flip-flopped on tariffs, crypto sentiment has yo-yoed between bear market fears and resurgent optimism.
This has exhausted most of the short-term and speculative traders in this market, at least for the time being.
In short, all capital markets are in chaos right now. Parts of the crypto market are showing cautious optimism, but all the ingredients of a bear market are still in play.
The industry has been agitating for interest rate cuts, but it may face serious hurdles. Ultimately, we’ll need a major bullish development to dispel these lingering market fears.
Disclaimer
In adherence to the Trust Project guidelines, BeInCrypto is committed to unbiased, transparent reporting. This news article aims to provide accurate, timely information. However, readers are advised to verify facts independently and consult with a professional before making any decisions based on this content. Please note that our Terms and Conditions, Privacy Policy, and Disclaimers have been updated.

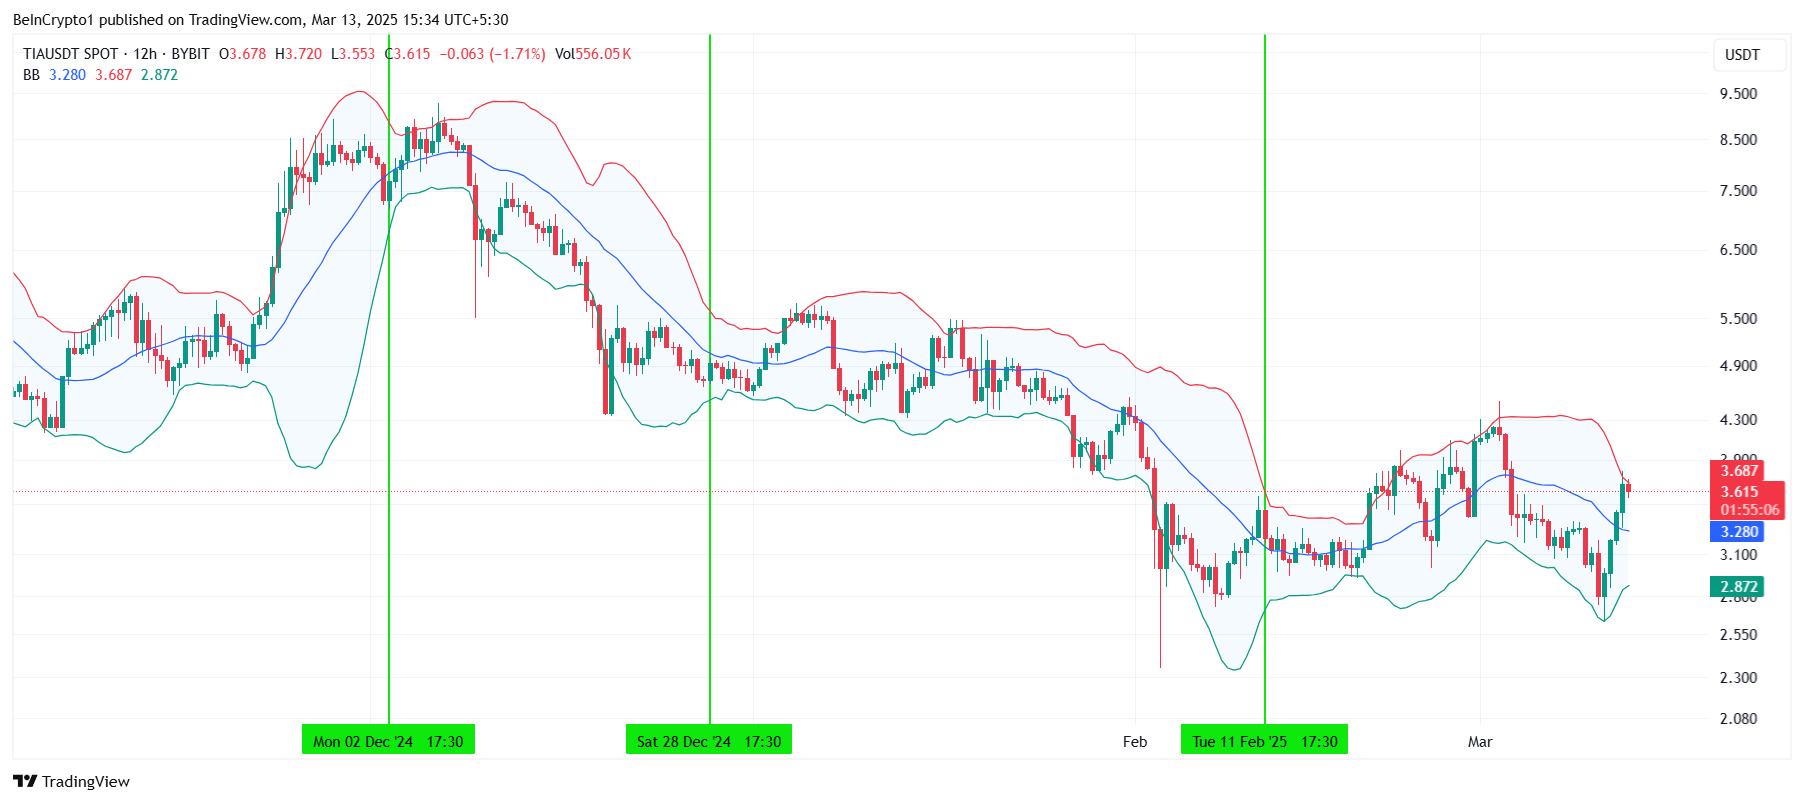
Celestia (TIA) has shown a recent recovery, reaching $3.60 after a 31% rise in the past 48 hours. This price action helped the altcoin recover most of its recent losses.
However, despite the positive movement, further gains might be challenging as signs point to potential consolidation in the near future.
Celestia Is Heading In No Direction
The Bollinger Bands are closing in on a squeeze, signaling that volatility in Celestia’s price could be coming to an end. Historically, such squeezes have often been followed by periods of price stabilization, where the price moves sideways.
This suggests that while TIA has seen some positive movement, it may struggle to pick a clear direction in the short term. During this time, TIA might hover between the support and resistance levels, awaiting stronger market cues to spark a breakout in either direction.
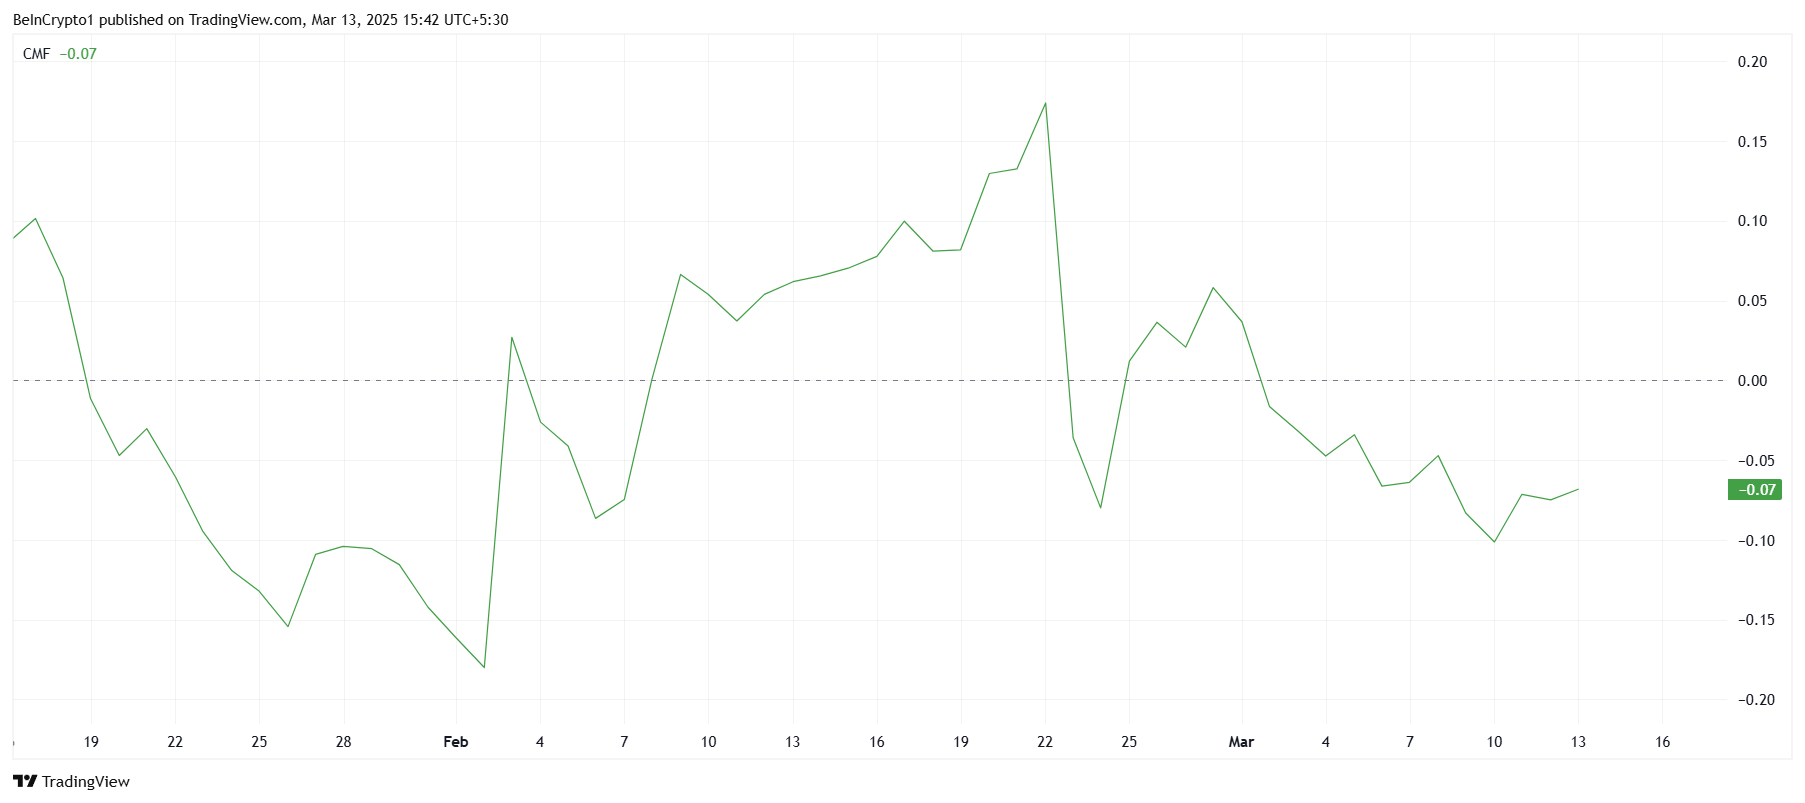
In terms of macro momentum, Celestia’s market sentiment is being influenced by the Chaikin Money Flow (CMF), which has remained below the zero line for the past few days. This indicator shows that capital inflows into Celestia have been relatively weak.
While the CMF’s position below the zero line typically signals bearish sentiment, the absence of strong volatility could prevent further declines. This lack of momentum may keep TIA from experiencing a sharp drop, but it also limits its ability to build on recent gains.
TIA Price Needs A Push
At the time of writing, Celestia’s price is holding steady at $3.60, comfortably above the $3.50 support level. However, it is still under the resistance of $3.83, which has historically been a challenging barrier for the altcoin. Despite the 31% rise over the last 48 hours, this resistance may continue to pose challenges for Celestia’s upward movement.
Given the current market conditions, Celestia is likely to face some struggle beneath the $3.83 resistance. The price could consolidate within a range between $3.83 and $3.50 until stronger market signals prompt a breakout. The consolidation phase may keep the price contained, delaying further price movement for the time being.
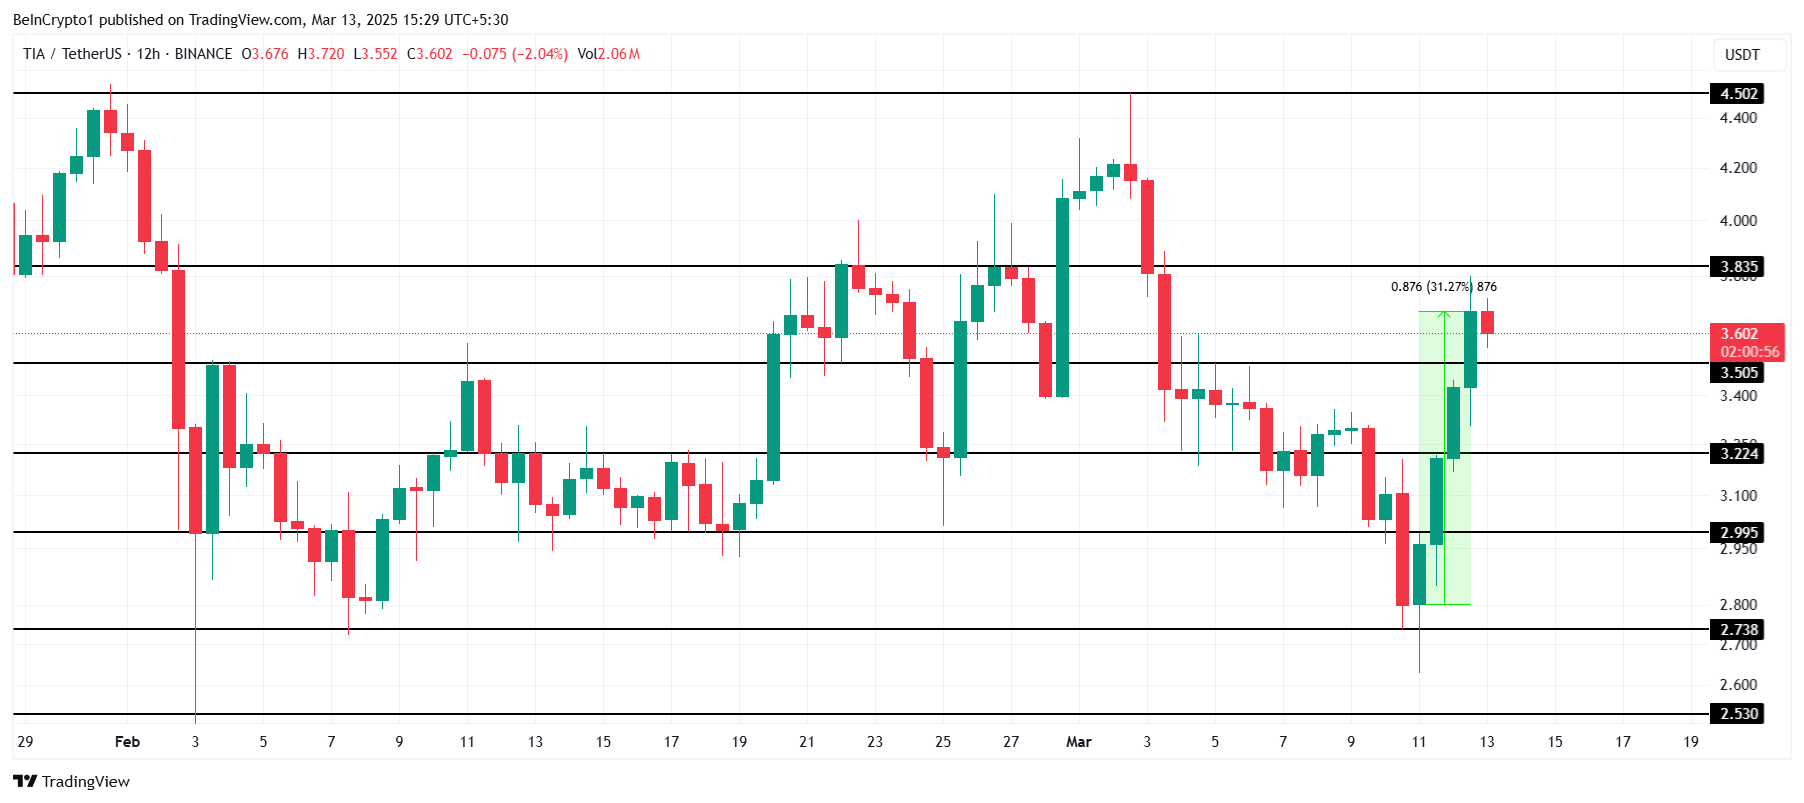
On the other hand, if Celestia successfully breaches the $3.83 resistance level, it could pave the way for further recovery, potentially driving the price to $4.50. A successful breakout beyond this level would invalidate the bearish-neutral outlook and could trigger a new phase of growth for Celestia.
Disclaimer
In line with the Trust Project guidelines, this price analysis article is for informational purposes only and should not be considered financial or investment advice. BeInCrypto is committed to accurate, unbiased reporting, but market conditions are subject to change without notice. Always conduct your own research and consult with a professional before making any financial decisions. Please note that our Terms and Conditions, Privacy Policy, and Disclaimers have been updated.

Onyxcoin has taken a significant hit, plunging 15% over the past week amid broader market volatility. At press time, the altcoin exchanges hands at $0.0132, noting a 1% price dip amid the general market rally.
While other assets attempt to recover, XCN remains trapped in a strong bearish cycle, with technical indicators pointing to the possibility of further losses.
XCN Bears Dominate as Price Trades Under Major Resistance Zones
Readings from the XCN/USD one-day chart show the altcoin trading below its 20-day exponential moving average (EMA). This forms resistance above its price at $0.0137.
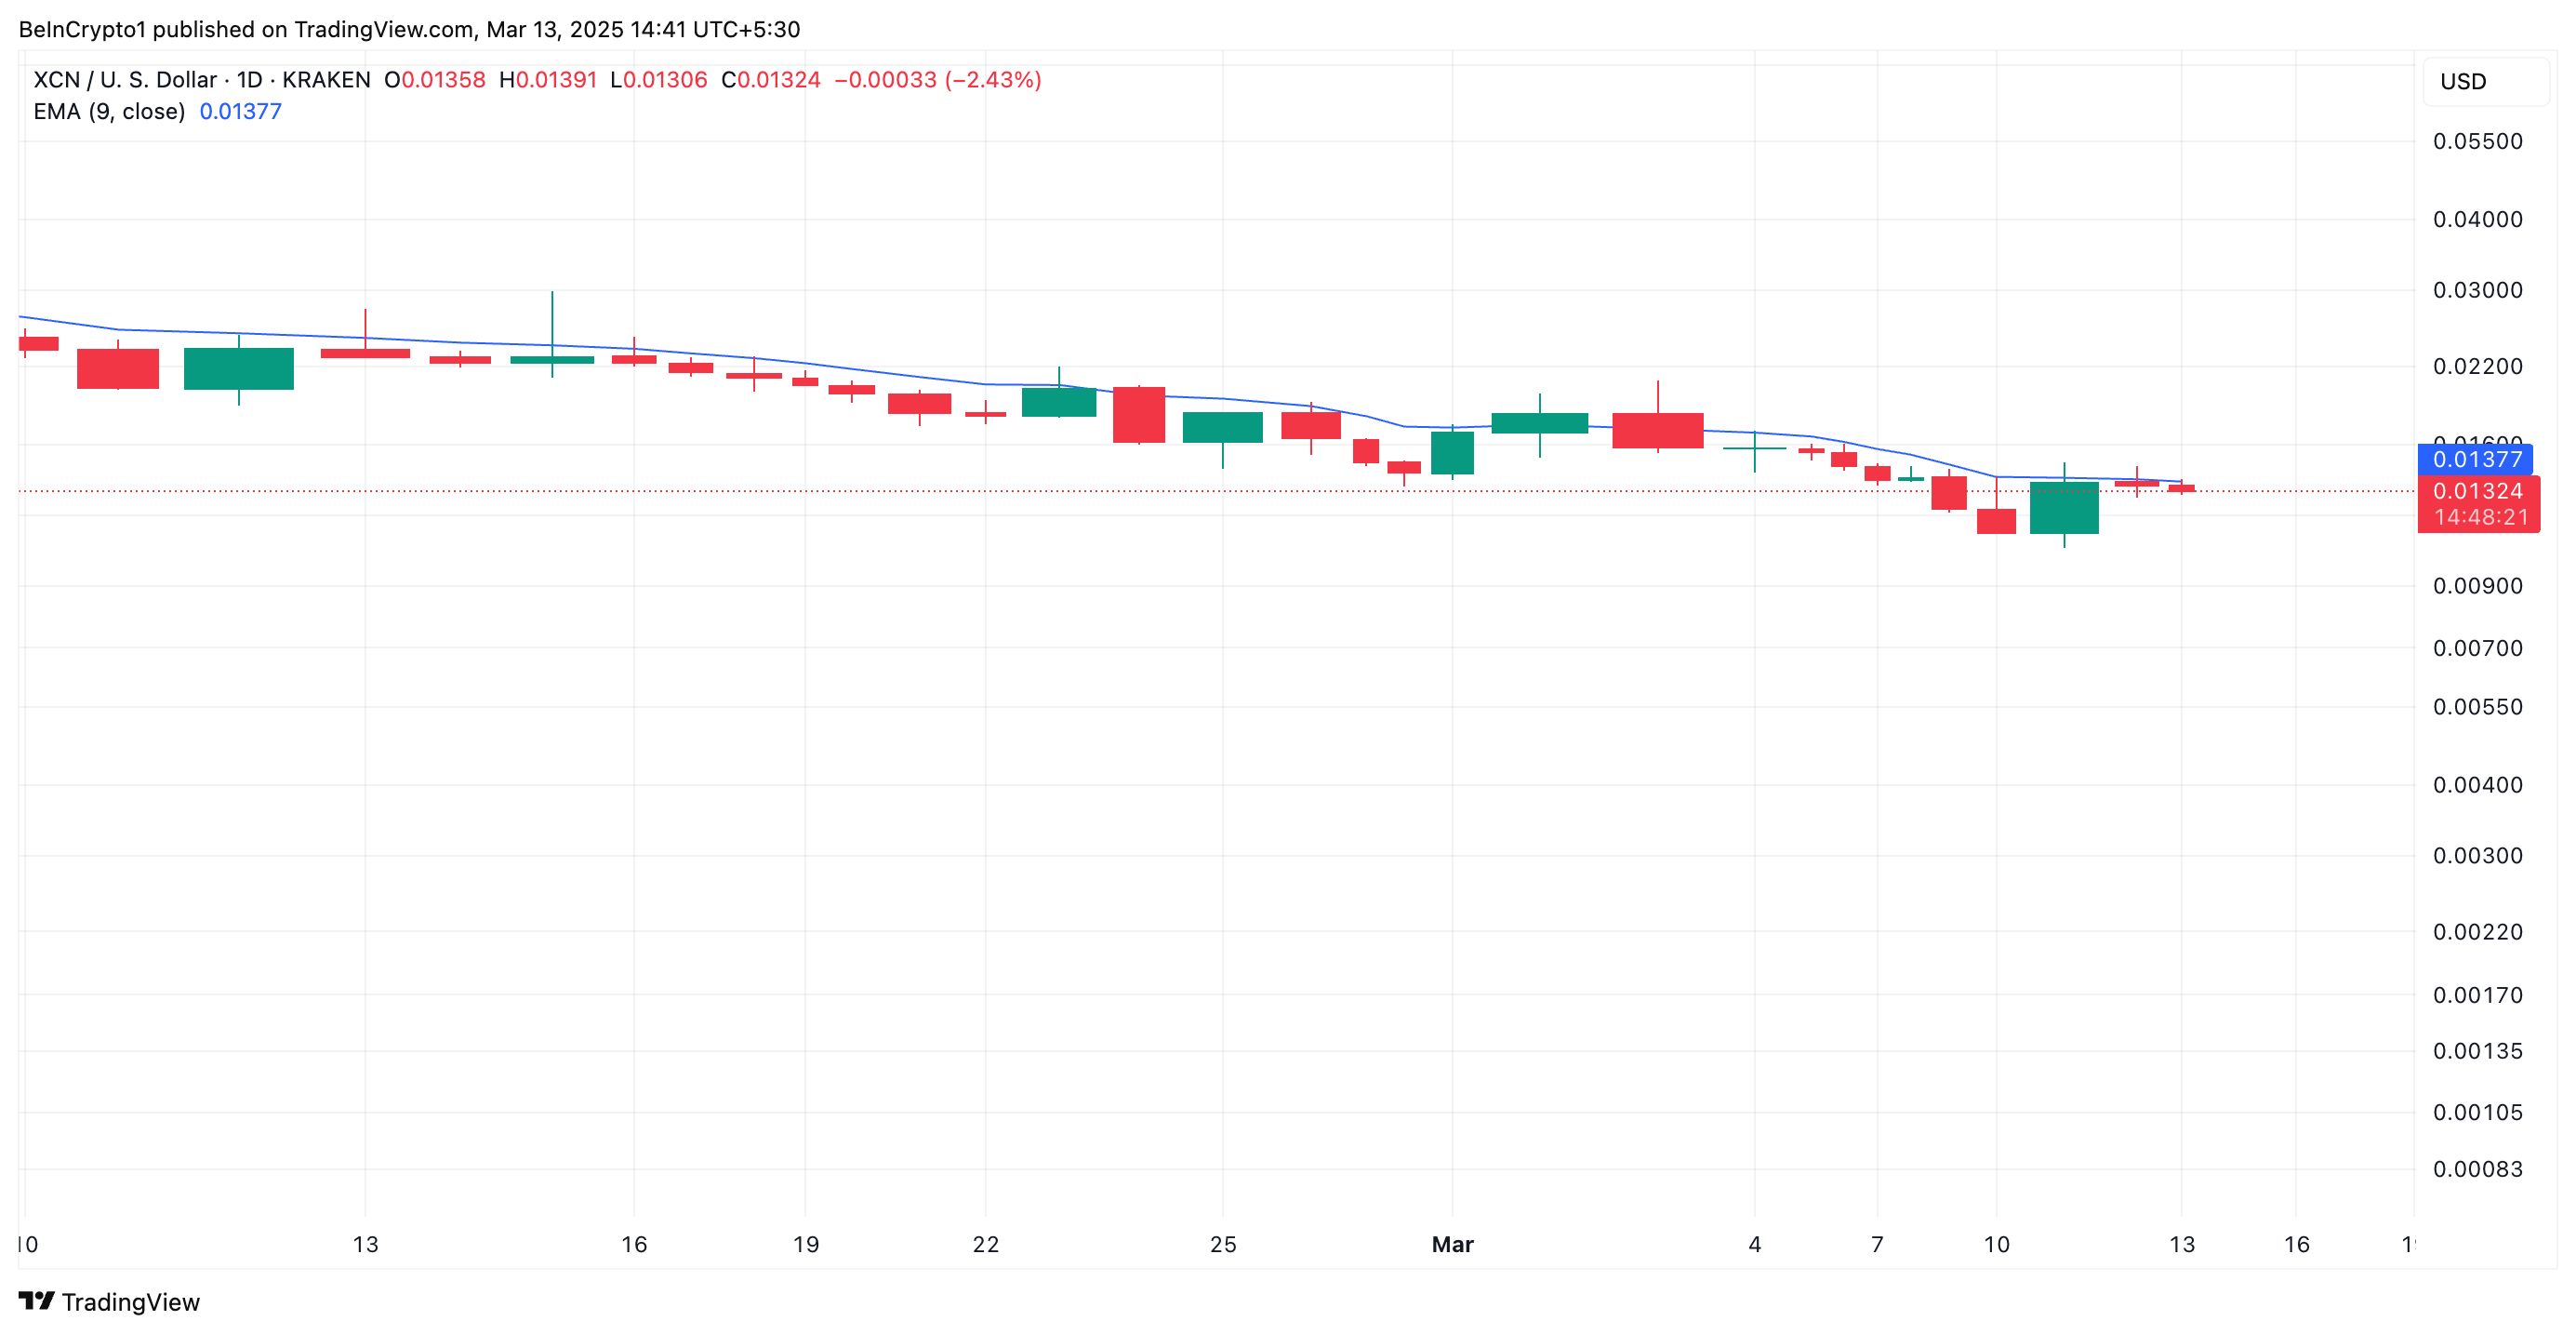
The 20-day EMA measures an asset’s average trading price over the past 20 days, giving more weight to recent prices for a smoother trend analysis.
When the price falls below this key moving average, it signals weakening momentum and a downtrend as sellers gain control. This indicates that XCN could face further losses unless strong buying pressure reverses the decline.
Furthermore, the altcoin trades significantly below the Leading Spans A and B of its Ichimoku Cloud, supporting this bearish outlook.
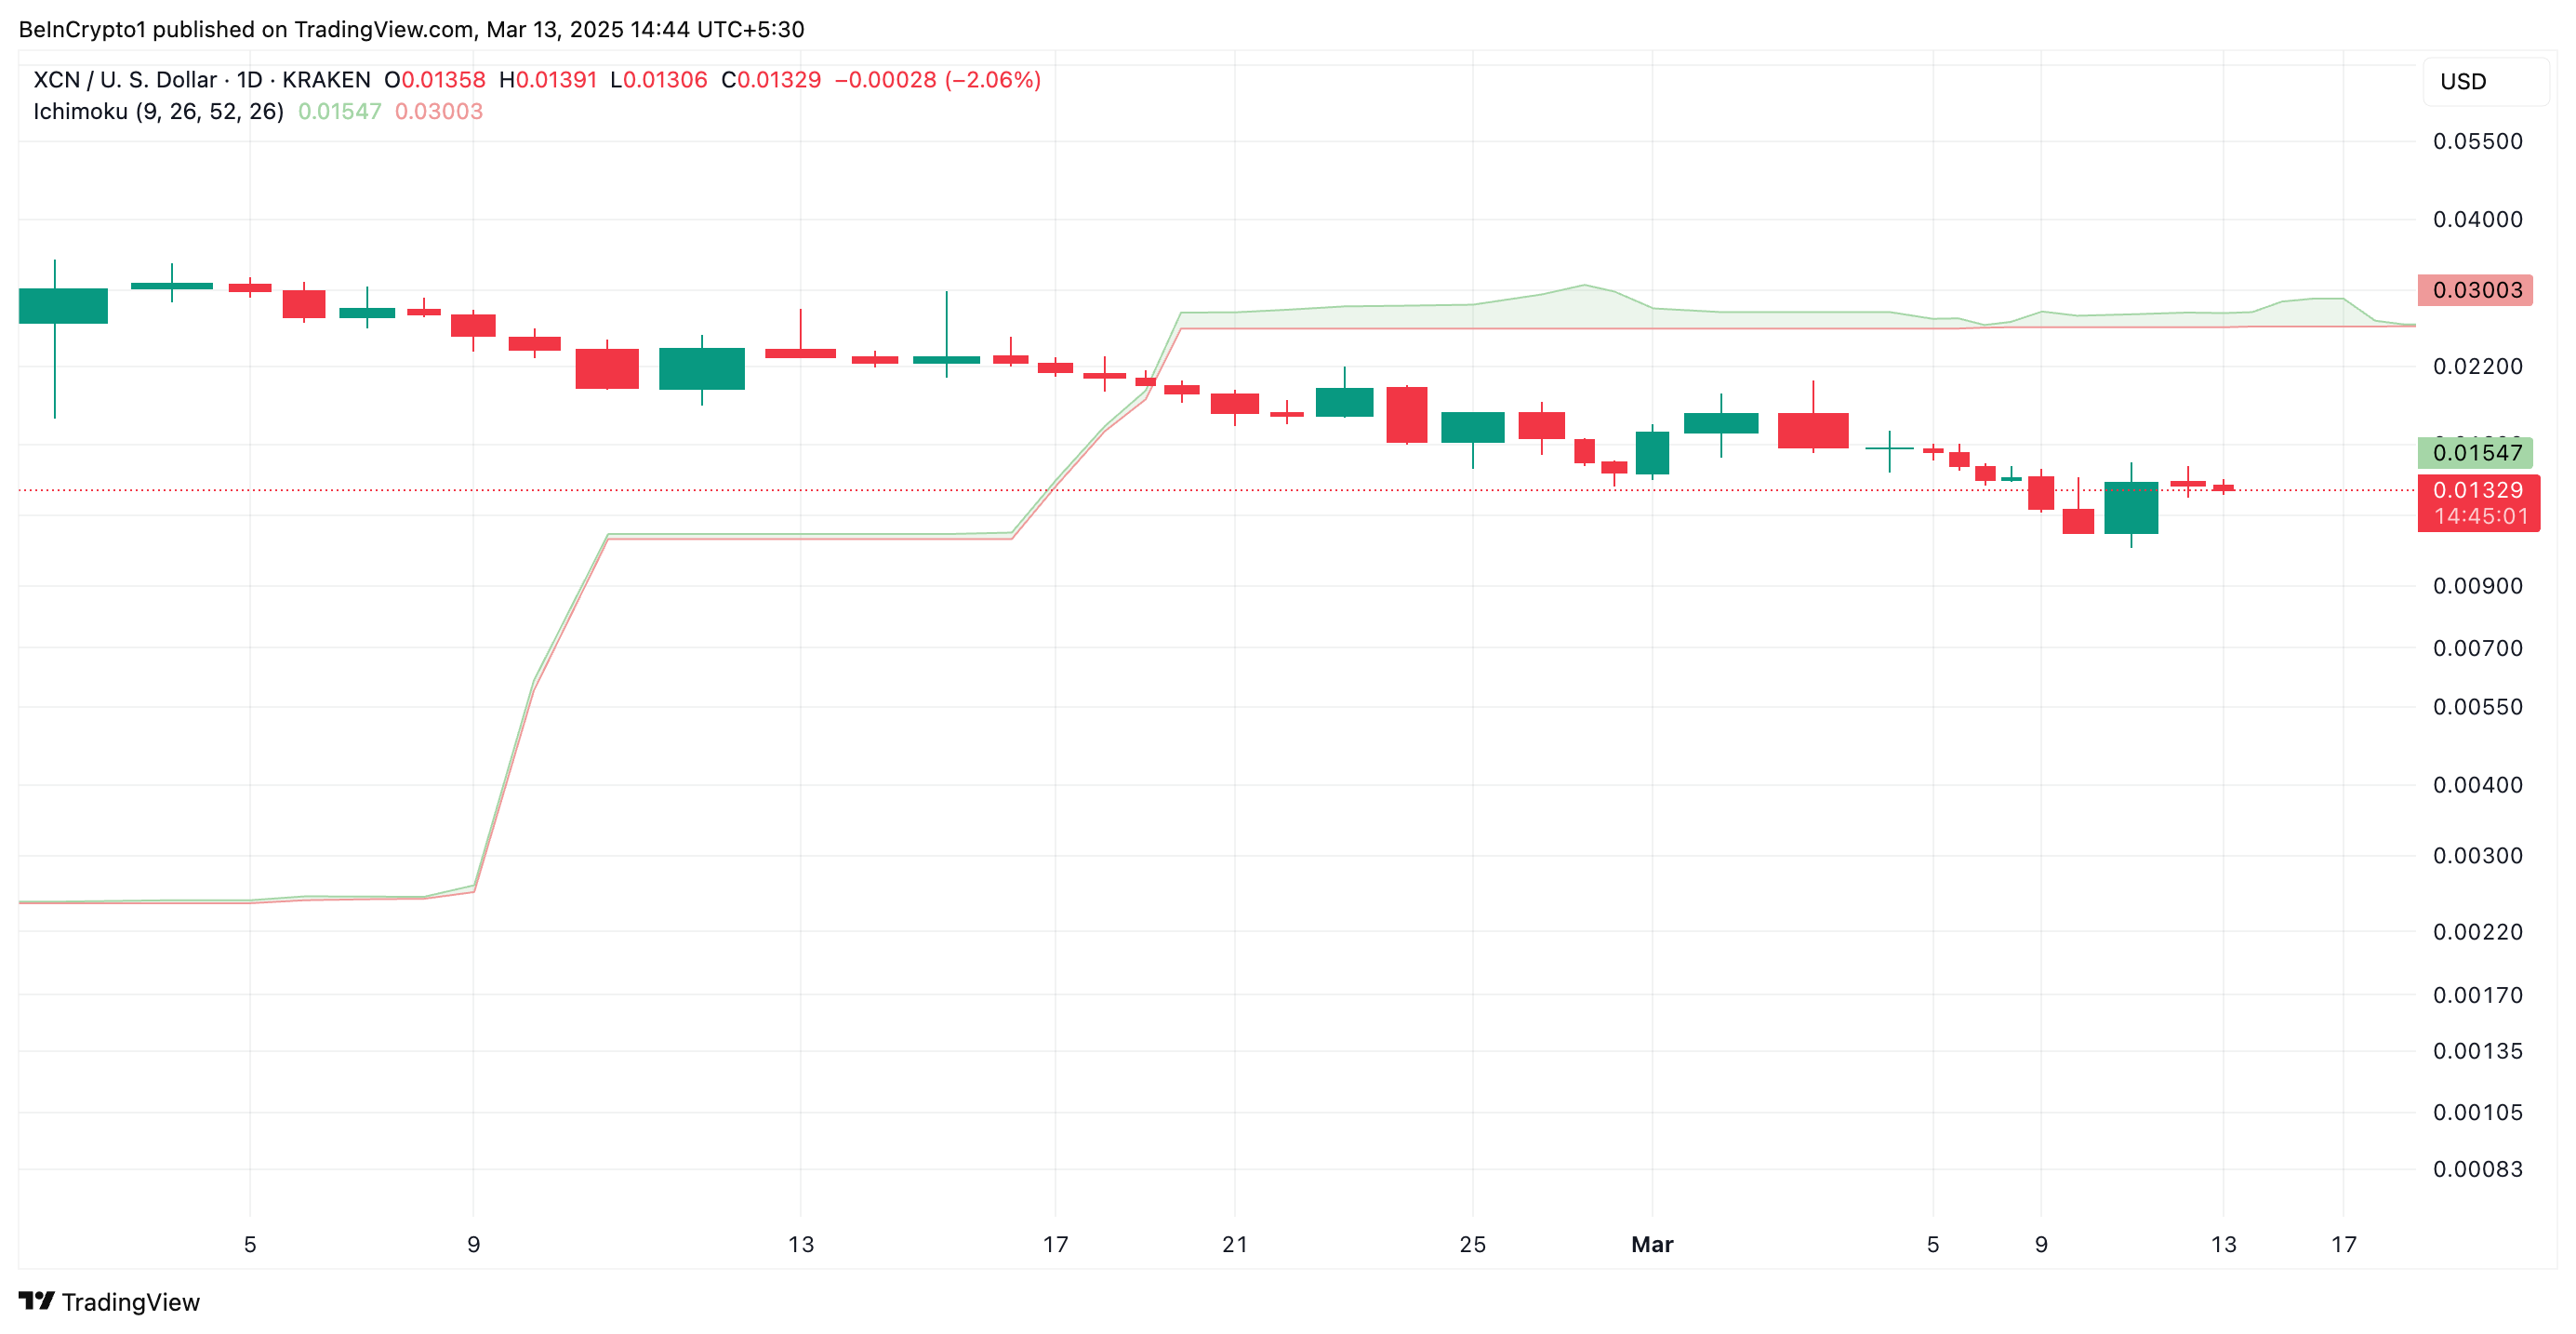
This indicator measures the momentum of an asset’s market trends and identifies potential support/resistance levels. When the price falls below this cloud, the asset in question is witnessing a downtrend. In this scenario, the cloud also acts as a dynamic resistance zone, reinforcing the downtrend.
For XCN, its Ichimoku Cloud forms dynamic resistance above its price at $0.0154 and $0.0300, highlighting the strong downward pressure on the coin’s price.
XCN Bears in Control – Breakout or Breakdown Next?
XCN’s price has remained within a descending parallel channel that has kept its price in decline since January 25. With strengthening selling activity, the altcoin may stay in this bearish pattern and extend its decline.
If this happens, XCN’s price could plunge to $0.0117.
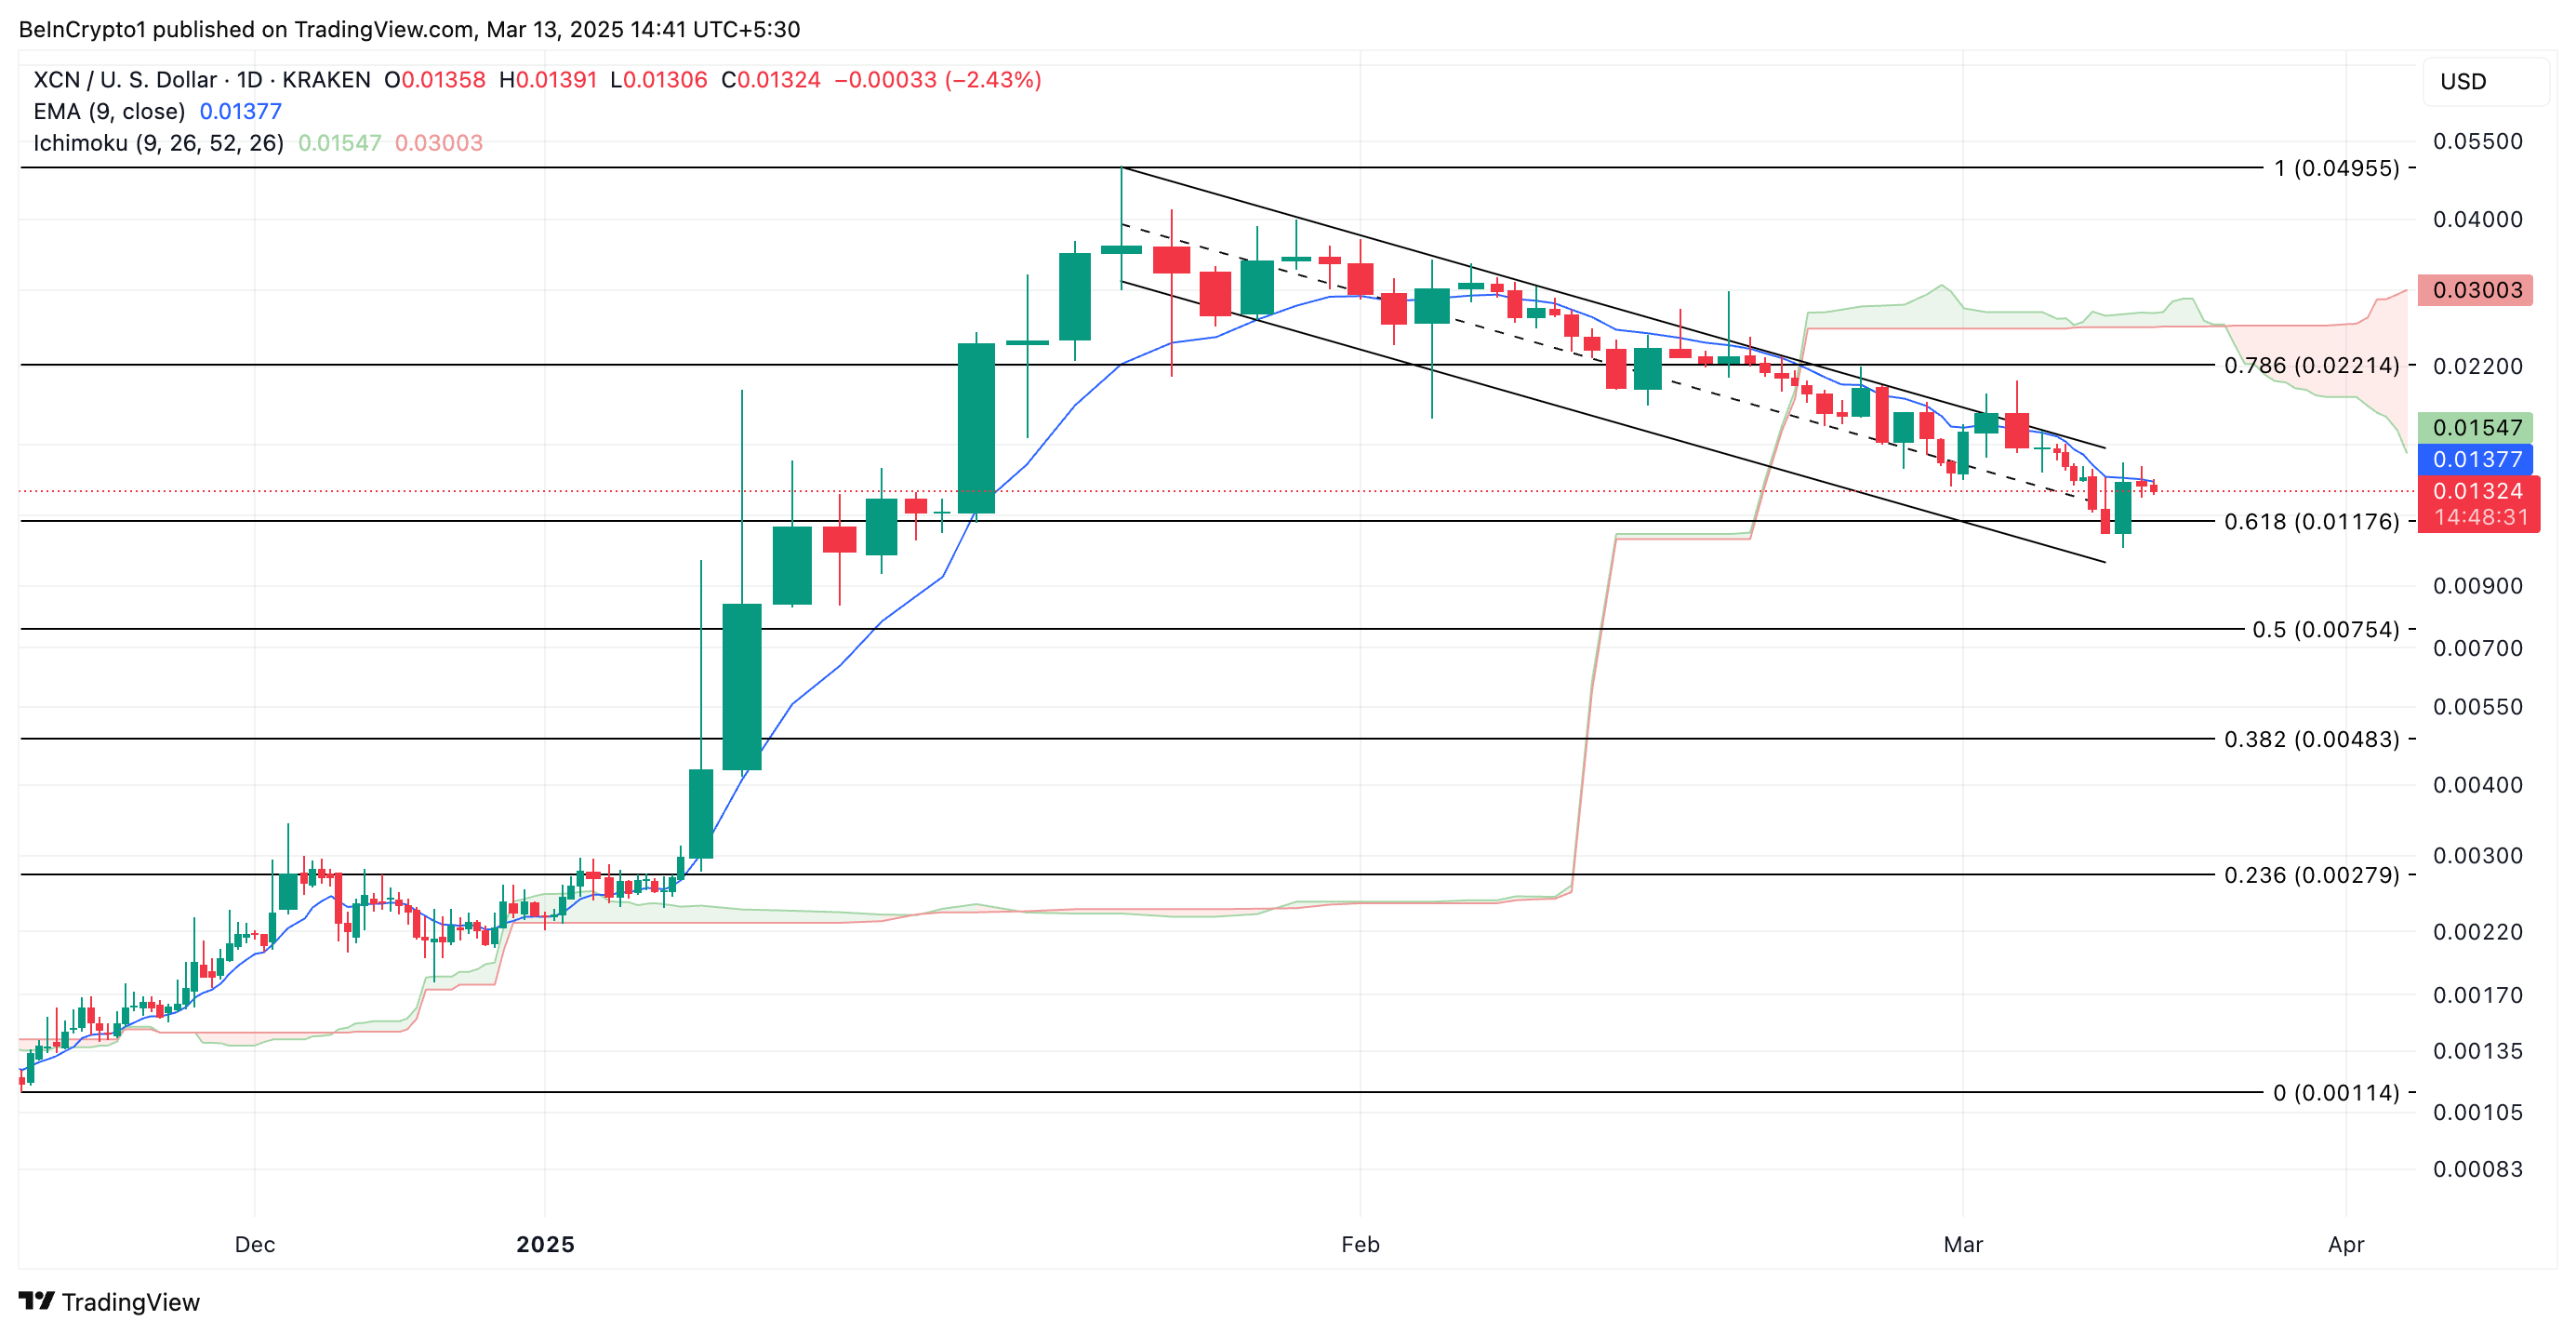
However, if buying pressure gains momentum, XCN’s price could rally past the $0.0137 resistance of its 20-day EMA and attempt to cross $0.0154.
Disclaimer
In line with the Trust Project guidelines, this price analysis article is for informational purposes only and should not be considered financial or investment advice. BeInCrypto is committed to accurate, unbiased reporting, but market conditions are subject to change without notice. Always conduct your own research and consult with a professional before making any financial decisions. Please note that our Terms and Conditions, Privacy Policy, and Disclaimers have been updated.

Crypto Stocks Post Losses, But Bear Market Fears Diminish

Ethereum Net Taker Volume Signals Huge Selling Pressure – Can Bulls Hold Key Levels?

Celestia TIA) Price Nears Consolidation After 31% Rally

Ripple Moves $457 Million XRP Amid Potential US SEC Settlement

XCN Dip Signals More Downside as Bearish Indicators Intensify

Aave Horizon RWA Product To Unlock Trillions in Tokenized Assets

2.52 Million Altcoins Are Ruining Crypto’s Future

Animoca Brands Valuation Tanks 75% In Two Years, Here’s Why

Crypto exchange BingX hacked for $43 million

Are The Big Players Losing Interest?

Hong Kong’s Securities Association Tips Authorities On Crypto Self-Regulation

Coinbase cbBTC Set to go Live on Solana
2.52 Million Altcoins Are Ruining Crypto’s Future
Animoca Brands Valuation Tanks 75% In Two Years, Here’s Why
Crypto exchange BingX hacked for $43 million
Are The Big Players Losing Interest?
Hong Kong’s Securities Association Tips Authorities On Crypto Self-Regulation
Coinbase cbBTC Set to go Live on Solana
-
 Altcoin23 hours ago
Analyst Reveals When The XRP Price Will Hit Double & Triple Digits
-

 Market23 hours ago
Ethereum Price Below $2,000 Triggers Bullish Signal After 2 Years
-
 Altcoin17 hours ago
Solana Price At Risk As Alameda Unstakes $23 Million SOL
-

 Market22 hours ago
Why Bitcoin Reserve Bills Fail: VeChain Executive Weighs In
-

 Market11 hours ago
Solana (SOL) Faces Many Challenges—Can Bulls Hold the Line?
-
 Market24 hours ago
ADA Long-Term Holders Show Confidence Amid 22% Price Decline
-

 Market9 hours ago
XRP Bulls Ready to Charge—Upside Break May Spark Rally
-
 Bitcoin8 hours ago
US Strategic Bitcoin Reserve Sparks Crypto Regulation Surge