
Market
WLFI Token Sale Reaches 99.3% Completion
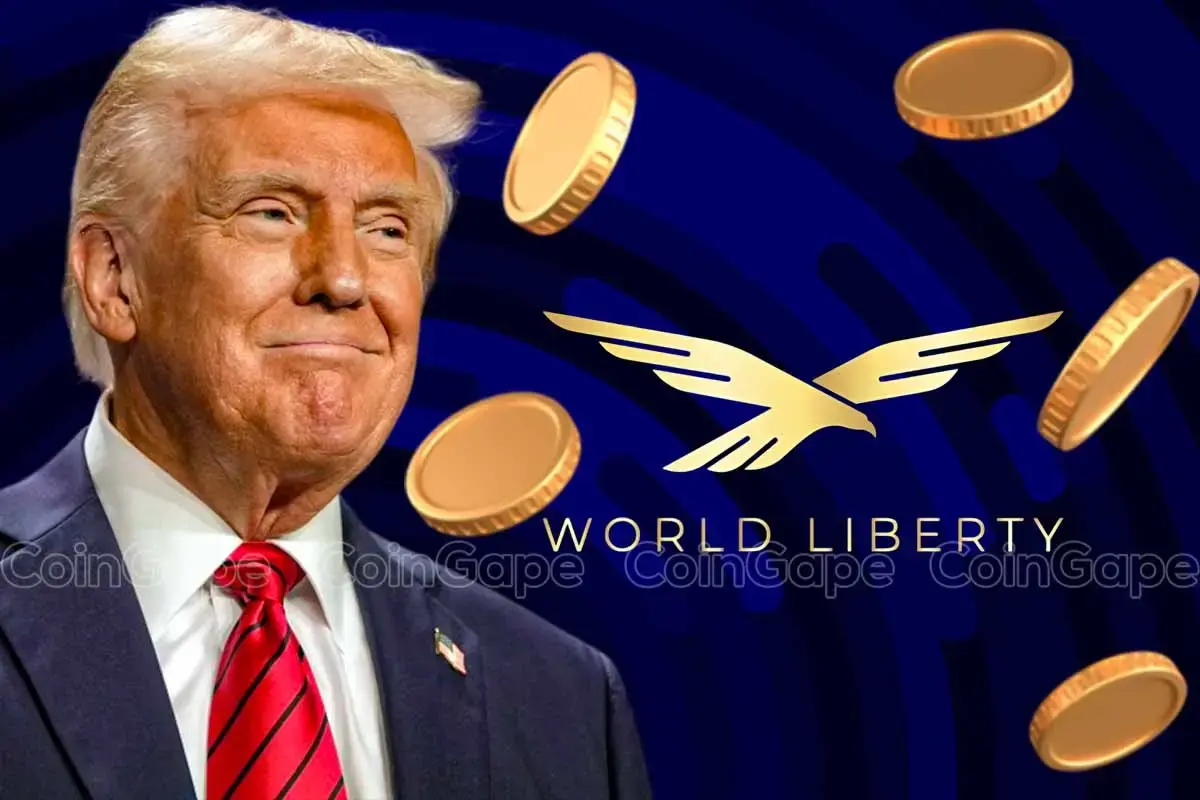
World Liberty Financial (WLF), a decentralized finance (DeFi) project backed by the Trump family, has successfully sold 99.3% of its recently issued 5 billion WLFI tokens.
The tokens went on sale on January 20, following a surge in demand after the initial public sale.
WLFI Token Achieves Major Milestone
According to the data on the project’s official website, World Liberty Financial has now sold a total of 24.97 billion WLFI tokens out of a 25 billion token supply allocated for public sale.

For context, the total supply of WLFI tokens is 100 billion, with an initial allocation of 20 billion tokens designated for the first public sale. This sale commenced on October 15, 2024, with the token priced at $0.015. Furthermore, the project restricted access to individuals who qualified through a whitelist.
The initial target for the WLFI token sale was set at $300 million. Nonetheless, weak demand in the early stages led to a drastic reduction of the presale target to $30 million.
Despite the initial setback, the tides shifted after Official Trump (TRUMP) and Melania Meme (MELANIA) meme coins were launched. This launch sparked renewed interest in World Liberty Financial, leading to a surge in demand for WLFI tokens.
By January 20, World Liberty Financial had completed its initial token sale, selling 20% of its total token supply. However, seeing the surge in demand, the project released an additional 5% of its token supply at a price of $0.05 per token.
“An additional 5% of our token supply is now available to purchase on our website. We appreciate the overwhelming support and look forward to welcoming so many new people to our community!” the project posted on X.
At the time of writing, only 34.6 million tokens of the 5 billion public sale allocation remain available.
The WLFI token’s primary purpose is governance within the World Liberty Financial Protocol. It allows token holders to propose, discuss, and vote on key protocol decisions. This gives token owners an equal voice in shaping the platform’s development, ensuring fair and democratic changes to its ecosystem.
As an added measure, the tokens will remain non-transferable for the first 12 months post-launch. Moreover, any community-approved changes to this restriction will not take effect until the one-year period concludes.
The milestone comes shortly after World Liberty Financial announced a partnership with Sui (SUI). The aim of this collaboration is to explore opportunities in DeFi. It will also integrate Sui’s technology into WLFI’s token reserve, “Macro Strategy,” supporting leading DeFi projects.
Disclaimer
In adherence to the Trust Project guidelines, BeInCrypto is committed to unbiased, transparent reporting. This news article aims to provide accurate, timely information. However, readers are advised to verify facts independently and consult with a professional before making any decisions based on this content. Please note that our Terms and Conditions, Privacy Policy, and Disclaimers have been updated.


The state of security across the crypto and blockchain space has changed significantly in the past few months. Traditional smart contracts exploited or brute force attacks on blockchain networks are being superseded by crypto scams like rug pulls and pump-and-dump schemes.
BeInCrypto spoke with a spokesperson from security firm CertiK to understand how blockchain and security threats are evolving and how projects and users can safeguard against future exploits.
Over the past few months, the crypto community has seen a rise in social media-related hacks. This increasingly common tendency has pivoted away from the orchestration of more sophisticated blockchain attacks that have traditionally plagued headlines.
Whereas smart contract exploits or blockchain hacks require more knowledge, hackers have found an easier avenue by targeting social media accounts instead.
“Social media accounts have become attractive targets due to their broad reach and the trust followers place in verified profiles. Compared to complex blockchain attacks, hijacking a social media account offers a quicker, less technically demanding way to spread scams to a massive audience. The growing frequency of such breaches suggests hackers are focusing more on social engineering and credential theft over direct blockchain exploitation,” a CertiK spokesperson told BeInCrypto.
The accessibility of social media hacking has, in turn, expanded the pool of malicious actors capable of these attacks.
“This trend may also be due to, in part, a skills gap among malicious actors. For instance, drainer-as-a-service has opened doors to scammers who don’t necessarily understand how to manipulate smart contracts. Many of these scammers are from the younger generation, which means they are more likely to speak about their financial pursuits online, which fuels more users attempting to use social media for malicious purposes,” the spokesperson added.
X (formerly Twitter) has quickly become the social media platform of choice among Web3 hackers.
After US President Donald Trump launched his meme coin only two days before assuming office, hackers began to take advantage of the hype to hack high-profile X accounts and convince followers to invest in scam meme coins.
Last month, anonymous hackers took over the X account of the former Malaysian Prime Minister Mahathir Mohamad to promote MALAYSIA, a fake meme coin promoted as the country’s official cryptocurrency.
The post was removed within an hour, but the damage was done. Analysis shows that these hackers were probably related to the infamous Russian Evil Corp and that they stole $1.7 million in this rug pull.
“Given that X is the most popular crypto social media application, it makes sense that popular accounts on the platform have been targeted to attract the most victims,” Certik spokesperson said.
The MALAYSIA token scam happened only two weeks after hackers exploited former Brazilian President Jair Bolsonaro’s social media account. In that instance, scammers promoted the BRAZIL token, which rose over 10,000% in minutes, netting the scammers over $1.3 million.
These scams have also affected technological companies.
Attacks on Tech Companies
In December, AI research and development company Anthropic also saw its X account hacked. A fraudulent post claimed that a fake token called CLAUDE would incentivize AI and crypto projects and included a wallet address for investors.
Attackers managed to collect around $100,000 from speculative investors.
“The trend is real and concerning. The breaches of accounts belonging to global leaders and tech companies highlight how threat actors are targeting platforms with wide-reaching influence, using them to amplify fraudulent crypto schemes. It reflects a shift in tactics where social media is becoming a primary vector for crypto-related scams,” the CertiK spokesperson told BeInCrypto.
These situations also highlight a broader issue of weak account security on social media platforms. As a result, even prominent individuals are susceptible to security breaches that directly affect the crypto community.
TRUMP Meme Coin Launch Was a Catalyst For Crypto Scams
After the launch of TRUMP, the frequency of socially engineered scams has become more apparent. In January, Ethereum co-founder Vitalik Buterin published a cathartic social media post criticizing TRUMP and meme coins.
“Now is the time to talk about the fact that large-scale political coins cross a further line: they are not just sources of fun, whose harm is at most contained to mistakes made by voluntary participants, they are vehicles for unlimited political bribery, including from foreign nation states,” Buterin claimed.
Buterin highlighted the tokens’ role in enabling scams and political corruption in crypto and blamed a regulatory loophole former SEC Chair Gary Gensler created for allowing bad actors to exploit governance tokens.
However, these crypto scams extend beyond political themes.
Growth of Social Engineering Exploits
A week after Buterin cautioned against political meme coins, a Coinbase user lost $11.5 million after falling victim to a social engineering scam on Base.
Crypto sleuth ZackXBT uncovered the exploit, pointing out that this incident is part of a growing trend, with multiple Coinbase users suffering similar losses. He also estimates that crypto scams of this nature have drained at least $150 million from Coinbase customers.
“Coinbase has a serious fraud problem. I just uncovered many more recent thefts from Coinbase users. The $150 million stolen from Coinbase users in a year is just from thefts I independently confirmed. So it’s more than likely multiples of this number,” ZachXBT stated.
In social engineering scams, attackers use phishing emails, spoofed calls, and other deceptive tactics to trick victims into revealing private keys or login credentials. Once they gain access, they drain wallets, move funds, and take control of accounts.
For CertiK, these situations stipulate the need for stronger security measures.
“Web3 security platforms are adapting by expanding their focus beyond smart contract vulnerabilities to include broader threat detection, particularly around social engineering risks. Many are integrating AI-driven monitoring tools to flag unusual account activity, especially on social media, and are educating users about the dangers of impersonation scams. The evolving threat landscape has prompted a more holistic approach to security, blending traditional blockchain defenses with social platform safeguards,” the spokesperson said.
Addressing these security challenges is crucial as new crypto projects increase exponentially.
Prioritizing Proactive Security in a Rapidly Growing Industry
The Web3 sector is experiencing consistent growth, marked by a surge in new crypto project launches. This innovative momentum is expected to continue, but it’s also fueling security concerns.
Notably, the increasing rate of scams and hacks in the first three months of 2025 makes it clear that security efforts are struggling to keep up with innovation.
A study by Precedence Research estimates the Web 3.0 market will expand from USD 4.62 billion in 2025 to approximately USD 99.75 billion by 2034, with a projected compound annual growth rate (CAGR) of 41.18% during that period.

Yet, CertiK believes that project developers are pushing security considerations toward the end of the priority list.
“Despite the surge in new projects, adherence to proper audit protocols remains inconsistent. While some projects prioritize thorough smart contract audits, others rush to the market, sidelining security to capitalize on market trends in an attempt to generate rapid profits,” said the CertiK spokesperson.
Understandably, the considerable rise in Web3 projects makes it more difficult for security firms to keep up with the pace and width of demand.
“Although there is growing awareness around the importance of audits, the pace of new launches often outstrips the capacity of security firms, leading to such gaps. Consequently, many projects are vulnerable to exploits, highlighting the need for more standardized auditing requirements across the space,” the spokesperson concluded.
As the Web3 ecosystem evolves, a proactive and adaptive security approach is critical. Prioritizing both blockchain integrity and social media vigilance will be essential for safeguarding the growing Web3 ecosystem.
The battle against these exploits requires a future where security is not an afterthought but a foundational pillar of every Web3 project and user interaction.
Disclaimer
Following the Trust Project guidelines, this feature article presents opinions and perspectives from industry experts or individuals. BeInCrypto is dedicated to transparent reporting, but the views expressed in this article do not necessarily reflect those of BeInCrypto or its staff. Readers should verify information independently and consult with a professional before making decisions based on this content. Please note that our Terms and Conditions, Privacy Policy, and Disclaimers have been updated.

Cardano price started a fresh decline below the $0.720 zone. ADA is correcting some losses and might face resistance near the $0.7750 level.
- ADA price started a recovery wave from the $0.650 zone.
- The price is trading below $0.720 and the 100-hourly simple moving average.
- There is a connecting bearish trend line forming with resistance at $0.7050 on the hourly chart of the ADA/USD pair (data source from Kraken).
- The pair could start another increase if it clears the $0.720 resistance zone.
Cardano Price Faces Hurdles
In the past few days, Cardano saw a bearish wave below the $0.7750 level, like Bitcoin and Ethereum. ADA declined below the $0.750 and $0.720 support levels.
Finally, it tested the $0.650 zone. A low was formed at $0.6495 and the price recently started a recovery wave. The price climbed above the $0.6950 and $0.70 level. The price even spiked above the 50% Fib retracement level of the downward move from the $0.8170 swing high to the $0.6495 low.
Cardano price is now trading below $0.720 and the 100-hourly simple moving average. There is also a connecting bearish trend line forming with resistance at $0.7050 on the hourly chart of the ADA/USD pair.
On the upside, the price might face resistance near the $0.7050 zone. The first resistance is near $0.7520 or the 61.8% Fib retracement level of the downward move from the $0.8170 swing high to the $0.6495 low. The next key resistance might be $0.7750.

If there is a close above the $0.7750 resistance, the price could start a strong rally. In the stated case, the price could rise toward the $0.80 region. Any more gains might call for a move toward $0.850 in the near term.
Another Drop in ADA?
If Cardano’s price fails to climb above the $0.720 resistance level, it could start another decline. Immediate support on the downside is near the $0.6880 level.
The next major support is near the $0.650 level. A downside break below the $0.650 level could open the doors for a test of $0.6350. The next major support is near the $0.620 level where the bulls might emerge.
Technical Indicators
Hourly MACD – The MACD for ADA/USD is losing momentum in the bearish zone.
Hourly RSI (Relative Strength Index) – The RSI for ADA/USD is now below the 50 level.
Major Support Levels – $0.6880 and $0.6500.
Major Resistance Levels – $0.7520 and $0.7750.

The United States Bankruptcy Court for the District of Delaware granted a motion allowing the joint liquidators of Three Arrows Capital (3AC) to amend their original proof of claim in the FTX bankruptcy proceedings. This increases their claims from $120 million to $1.53 billion.
The amended filing broadened 3AC’s allegations against FTX to include breach of contract, breach of fiduciary duty, unjust enrichment, and proprietary restitutionary claims.
3AC’s Liquidators Secure Major Victory in FTX Case
The ruling stems from a motion filed by 3AC’s liquidators, Russell Crumpler and Christopher Farmer. For context, the liquidators initially filed their proof of claim in June 2023.
It sought to recover funds related to preference, conversion, and other avoidance actions tied to a $120 million loan allegedly owed by 3AC to FTX. Nonetheless, after further investigation, the liquidators determined that 3AC’s dealings with FTX were far more extensive.
“The information obtained by the Liquidators in the year since they filed their Original POC led them to the new conclusion that just two weeks before the commencement of the 3AC Liquidation, the $1.53 billion of assets that 3AC had on the FTX platform were liquidated to satisfy $1.3 billion in liabilities to FTX,” the document read.
Furthermore, according to court documents, the liquidators faced substantial obstacles during their investigation. This included a lack of proper records from 3AC. In addition, the cooperation was minimal from the company’s founders, Kyle Davies and Su Zhu.
Delays in receiving critical documents and data compounded these challenges. Much of the key information was only made available in late 2023 and early 2024. This came after FTX itself had filed for bankruptcy in November 2022. The exchange collapsed amid allegations of fraud and mismanagement under former CEO Sam Bankman-Fried.
This delay prevented the liquidators from fully understanding the scope of 3AC’s transactions with FTX until after the original claims deadline had passed.
“The evidence makes clear that the description of the facts contained in the Original POC was based on the limited information that the Liquidators had available to them at that time,” Judge John T. Dorsey wrote.
Meanwhile, FTX objected to the motion. They argued that the amendment was filed too late and expanded the scope of the claims, violating the bankruptcy process. The debtors claimed that the original proof of claim did not provide sufficient notice of the nature or the amount of the newly proposed claims.
However, the court dismissed FTX’s objections, siding with 3AC’s liquidators and approving the expanded claim. Additionally, the court found that much of the delay in filing the amended claim was attributable to FTX’s failure to provide the necessary documents to the liquidators promptly.
“Having considered all the evidence presented, I find that the balance of the equities is in favor of allowing the Amended POC,” Judge Dorsey noted.
This latest development occurs alongside Bankman-Fried’s ongoing efforts to secure a pardon from President Donald Trump. To strengthen his case, Bankman-Fried has sought to align himself with right-wing figures.
He recently appeared on Tucker Carlson’s show and has reportedly consulted with a lawyer linked to Trump. Despite Trump’s history of pardons, skepticism remains due to SBF’s lack of support in the crypto community.
Disclaimer
In adherence to the Trust Project guidelines, BeInCrypto is committed to unbiased, transparent reporting. This news article aims to provide accurate, timely information. However, readers are advised to verify facts independently and consult with a professional before making any decisions based on this content. Please note that our Terms and Conditions, Privacy Policy, and Disclaimers have been updated.

CertiK Expert Discusses Surge in Social Engineering Crypto Scams

Cardano (ADA) Struggle Persists—Is a Rebound Still Possible?

Court Ruling Raises 3AC’s FTX Claim to $1.53 Billion

$3.29 Billion Bitcoin & Ethereum Options Expiry

XRP Price Builds Base—Short-Term Rally May Be Brewing
SEI Price Jumps 7.3% As World Liberty Financial Loads Up 541,242 Coins

2.52 Million Altcoins Are Ruining Crypto’s Future

Animoca Brands Valuation Tanks 75% In Two Years, Here’s Why

Crypto exchange BingX hacked for $43 million

Are The Big Players Losing Interest?

Hong Kong’s Securities Association Tips Authorities On Crypto Self-Regulation

Coinbase cbBTC Set to go Live on Solana
2.52 Million Altcoins Are Ruining Crypto’s Future
Animoca Brands Valuation Tanks 75% In Two Years, Here’s Why
Crypto exchange BingX hacked for $43 million
Are The Big Players Losing Interest?
Hong Kong’s Securities Association Tips Authorities On Crypto Self-Regulation
Coinbase cbBTC Set to go Live on Solana
-

 Market23 hours ago
PEPE Whales Propel 11% Rally, Fueling Market Optimism
-

 Market21 hours ago
Solana Hit by Bearish Signal After 3 Years, Price at Risk
-

 Market18 hours ago
Celestia TIA) Price Nears Consolidation After 31% Rally
-

 Ethereum17 hours ago
Ethereum Net Taker Volume Signals Huge Selling Pressure – Can Bulls Hold Key Levels?
-

 Market17 hours ago
Crypto Stocks Post Losses, But Bear Market Fears Diminish
-
 Altcoin23 hours ago
Lawyer Explains Why the SEC Delay Is Not a Big Issue
-
 Market22 hours ago
This Crypto Analyst Correctly Predicted XRP Price Crash Below $2, Here’s The Rest Of The Forecast
-

 Market20 hours ago
Aave Horizon RWA Product To Unlock Trillions in Tokenized Assets