
Market
Solana (SOL) Faces Many Challenges—Can Bulls Hold the Line?

Solana started a recovery wave above the $120 resistance zone. SOL price is now consolidating and might struggle to recover above the $132 resistance.
- SOL price started a fresh decline below the $150 and $140 levels against the US Dollar.
- The price is now trading below $130 and the 100-hourly simple moving average.
- There is a short-term rising channel forming with support at $124 on the hourly chart of the SOL/USD pair (data source from Kraken).
- The pair could start a fresh increase if the bulls clear the $132 zone.
Solana Price Faces Resistance
Solana price struggled to clear the $155 resistance and started a fresh decline, like Bitcoin and Ethereum. SOL declined below the $140 and $132 support levels.
It even dived below the $120 level. The recent low was formed at $114 before the price recovered some losses. It climbed above the $120 and $122 levels. The price surpassed the 23.6% Fib retracement level of the downward move from the $151 swing high to the $114 swing low.
Solana is now trading below $130 and the 100-hourly simple moving average. There is also a short-term rising channel forming with support at $124 on the hourly chart of the SOL/USD pair.
On the upside, the price is facing resistance near the $128 level. The next major resistance is near the $130 level. The main resistance could be $132 and the 50% Fib retracement level of the downward move from the $151 swing high to the $114 swing low.

A successful close above the $132 resistance zone could set the pace for another steady increase. The next key resistance is $140. Any more gains might send the price toward the $150 level.
Another Decline in SOL?
If SOL fails to rise above the $132 resistance, it could start another decline. Initial support on the downside is near the $124 zone. The first major support is near the $120 level.
A break below the $120 level might send the price toward the $114 zone. If there is a close below the $114 support, the price could decline toward the $100 support in the near term.
Technical Indicators
Hourly MACD – The MACD for SOL/USD is losing pace in the bullish zone.
Hourly Hours RSI (Relative Strength Index) – The RSI for SOL/USD is near the 50 level.
Major Support Levels – $124 and $120.
Major Resistance Levels – $128 and $132.


Solana (SOL) has faced significant price challenges in recent weeks, with a notable drawdown that has left it struggling to recover.
This decline has triggered concerns in the market, further compounded by a key bearish signal. There is a rising concern among investors that these factors could lead to even more bearishness in the short term.
Solana Faces Strong Bearishness
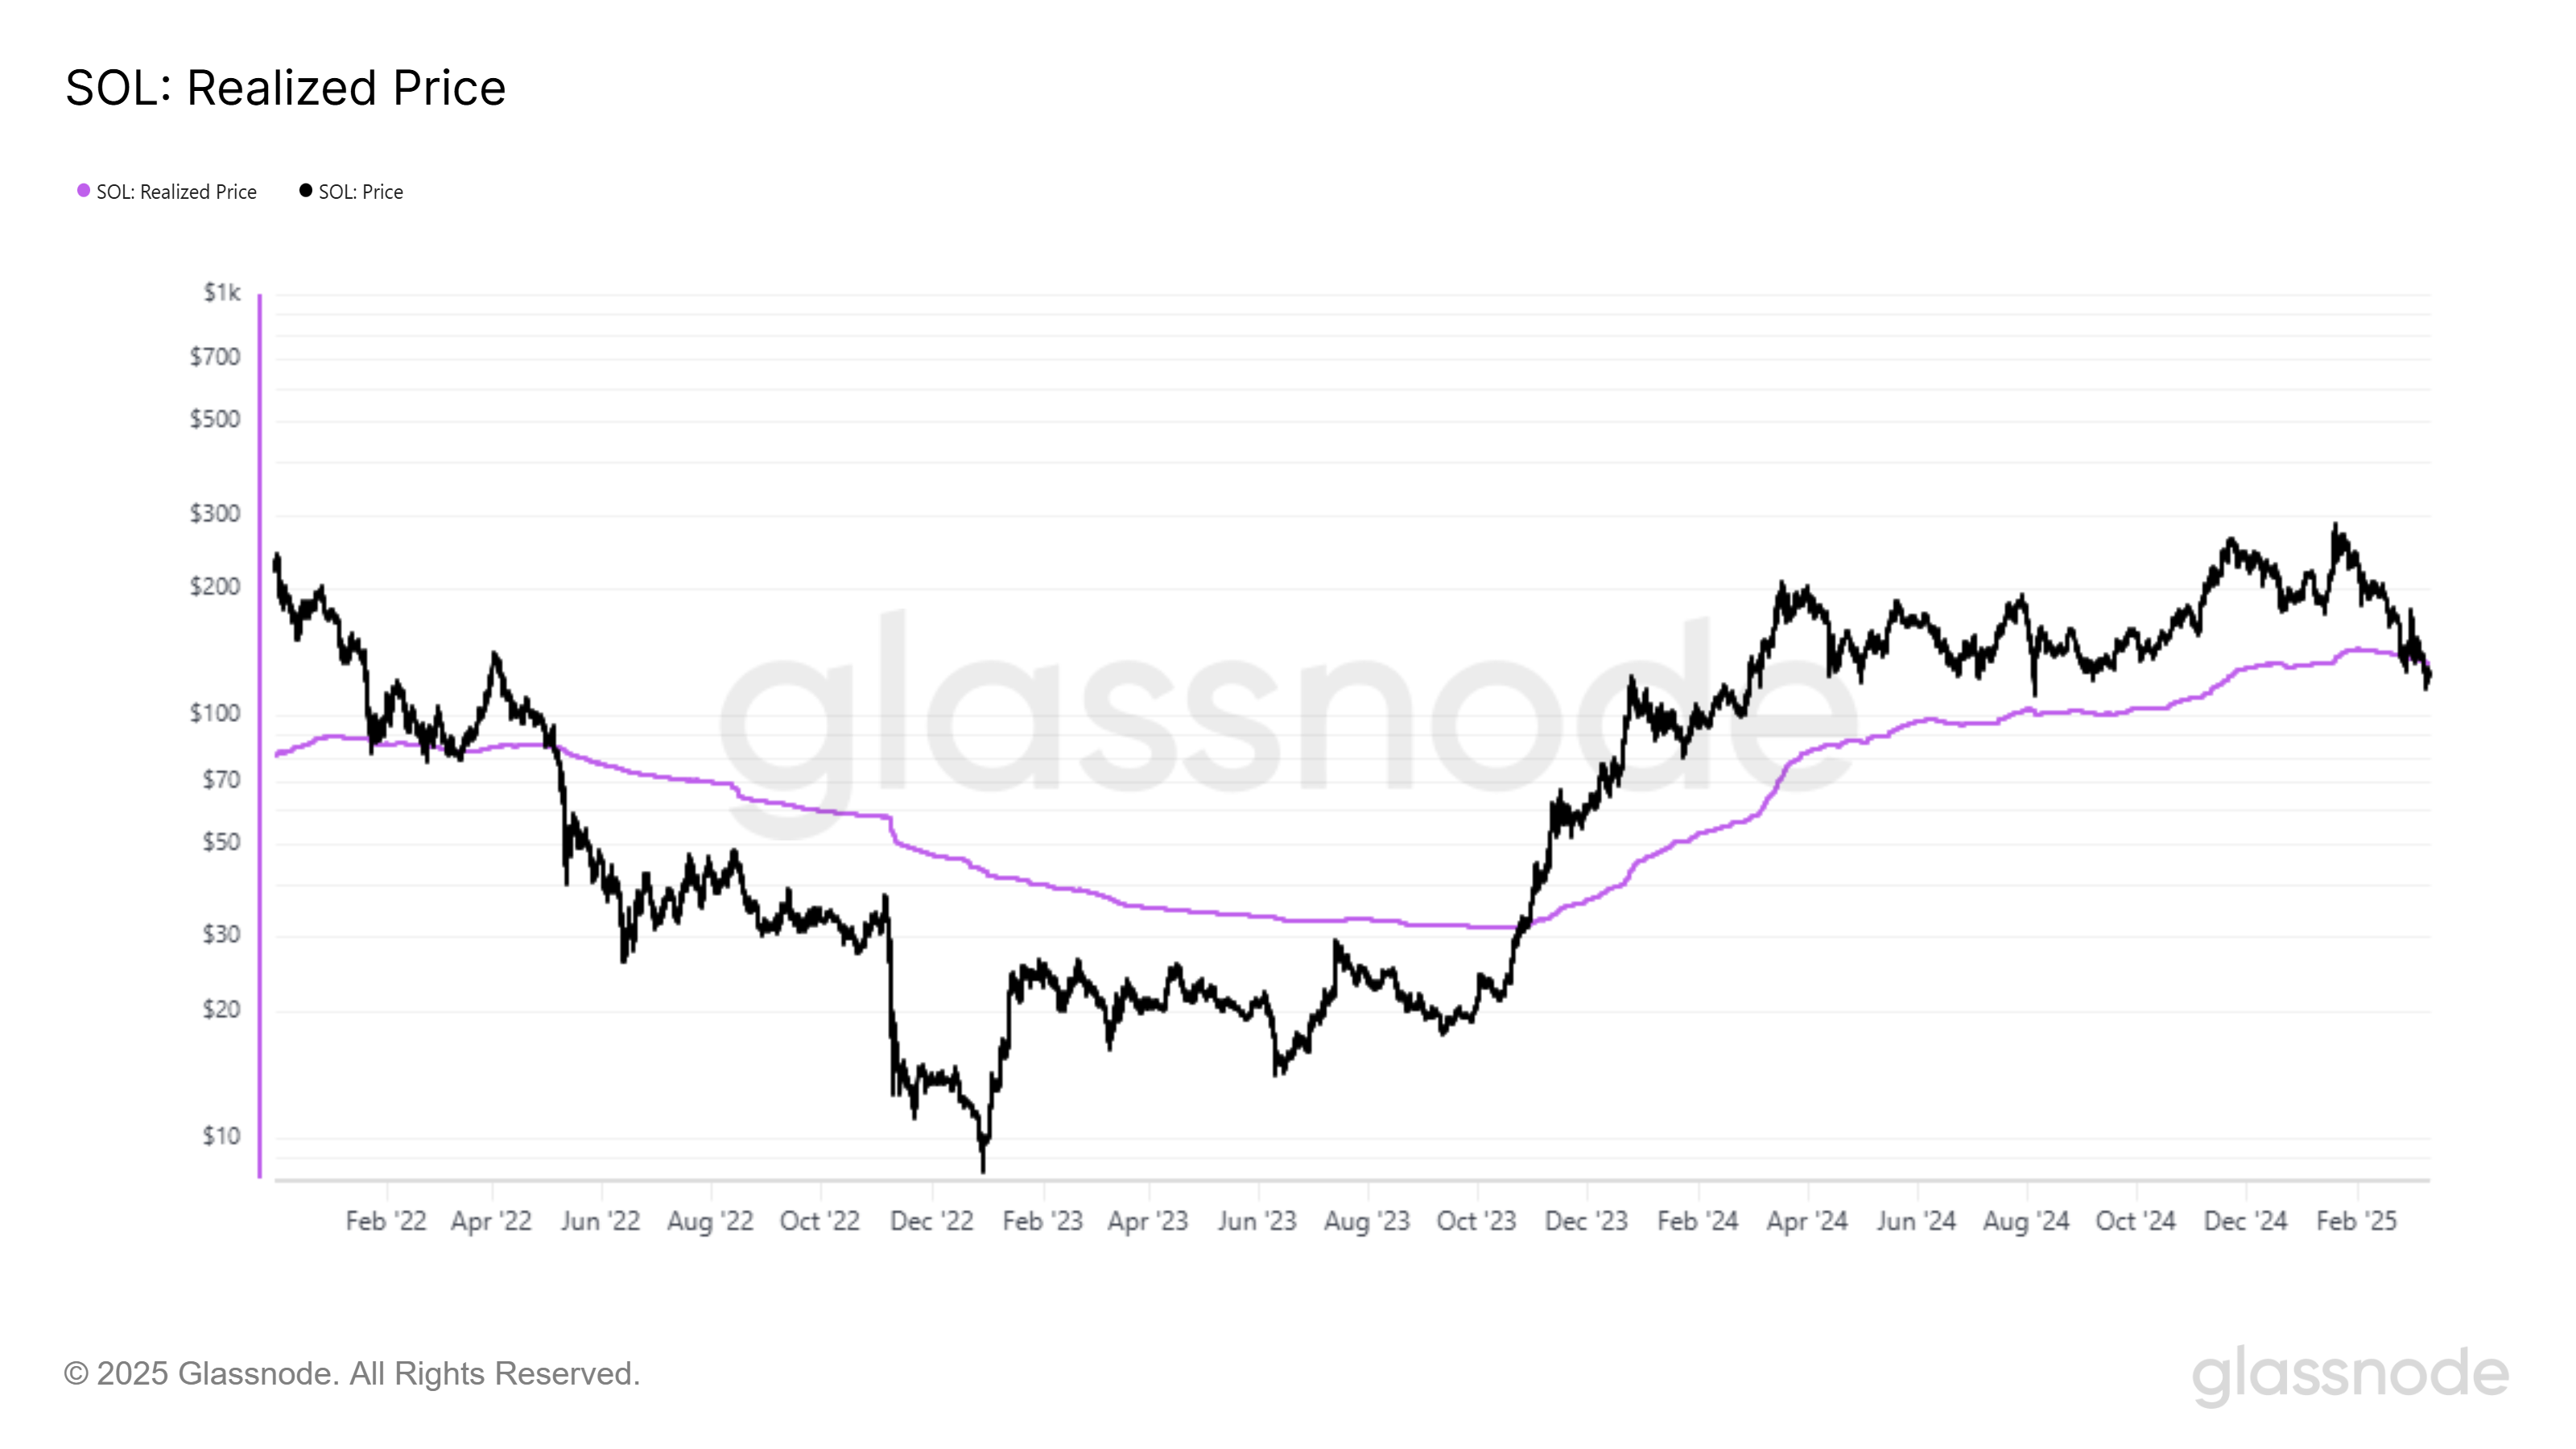
Solana’s price has slipped below the realized price for the first time in almost 3 years. The realized price is a key metric that represents the average price at which an asset was last moved. When the spot price falls below this, it signals that the holders of Solana are collectively experiencing net unrealized losses.
This situation is often considered a bearish signal, as it suggests that investors are sitting on losses, which may prompt some to sell in an attempt to avoid further declines. As a result, the potential for panic selling increases when the price trades below the realized price.
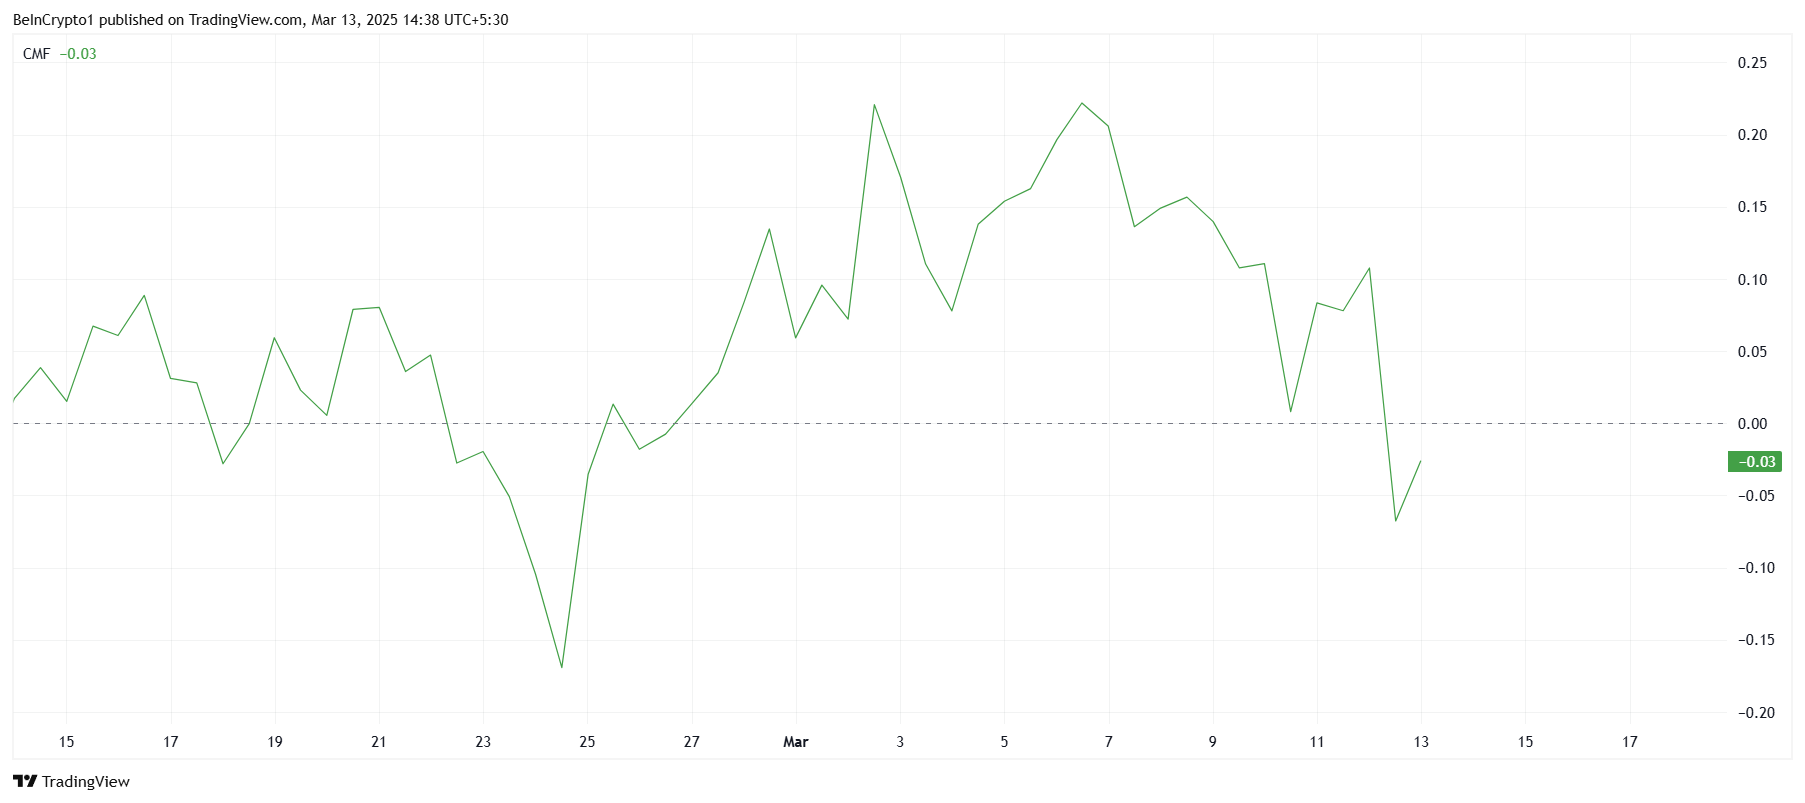
On a broader scale, Solana is also experiencing weak macro momentum, highlighted by the technical indicators. The Chaikin Money Flow (CMF), which measures the volume-weighted flow of money into and out of an asset, has noted a sharp downtick. The CMF is currently below the zero line, indicating that outflows are dominating inflows.
As the CMF remains negative, it suggests that Solana’s price recovery could be hindered. The lack of buying interest and the dominance of selling activity are likely to limit any significant upward movement.
SOL Price Is Vulnerable To A Decline
Solana’s price has been down nearly 30% over the last ten days, and it is currently trading at $125, just under the critical $126 resistance level. Despite recently bouncing off the support at $118, the overall sentiment and market conditions suggest that recovery may be short-lived. The price remains under pressure, with further declines possible if key levels fail to hold.
If Solana fails to secure $126 as support, the altcoin could drop back to $118 or even lower, possibly reaching $109. This scenario would reinforce the bearish outlook and prolong the struggle for recovery. Without a strong rally, Solana could face more losses in the short term.
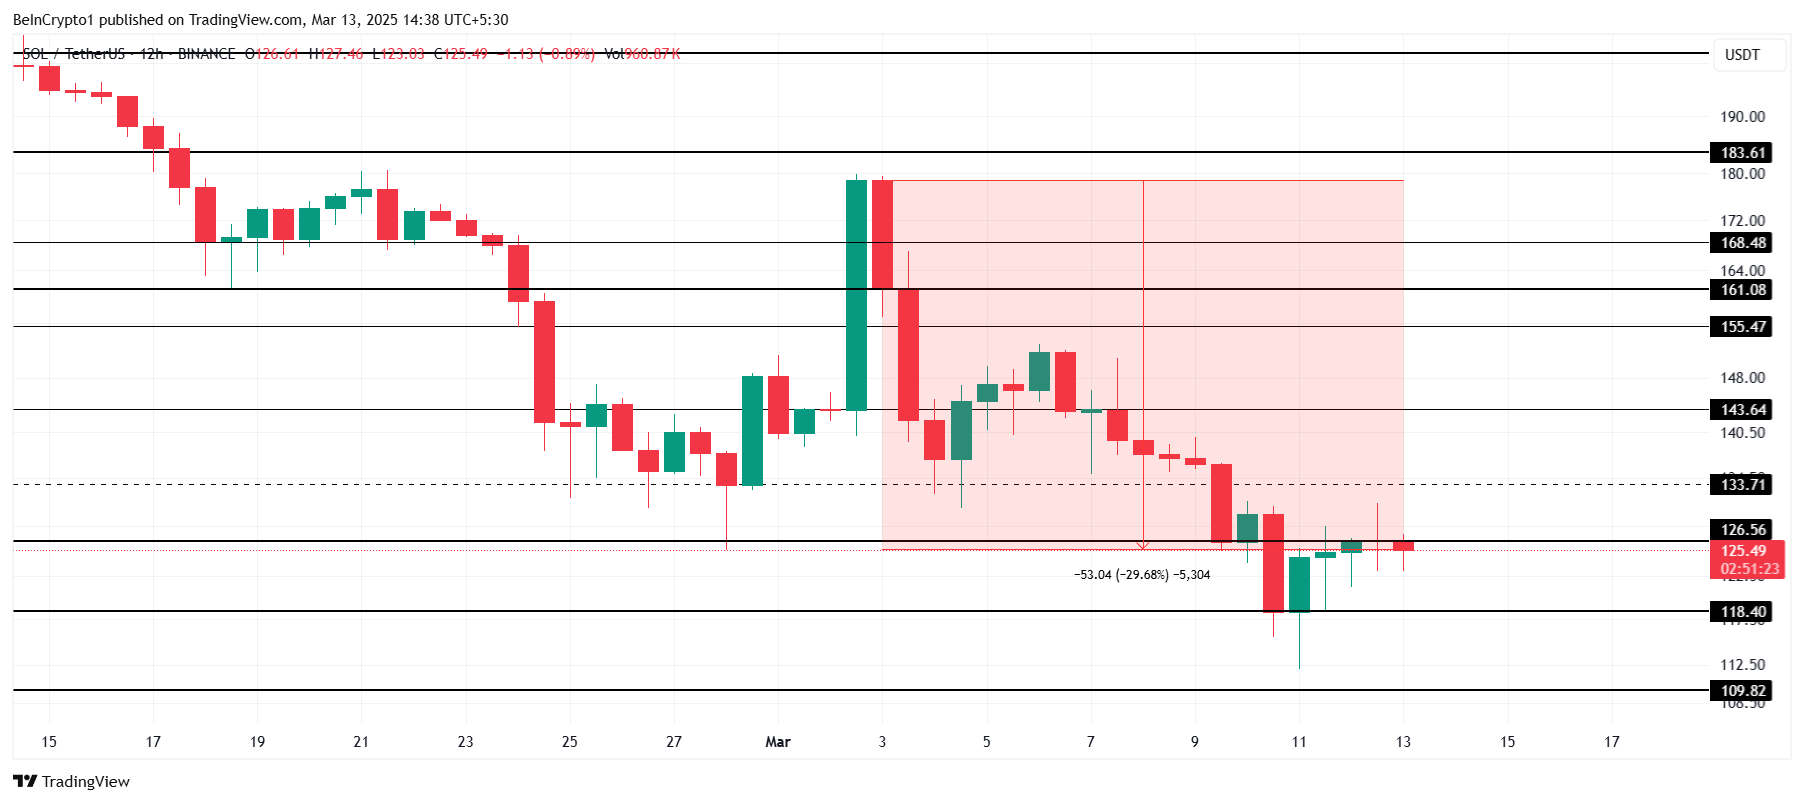
However, if Solana manages to breach and flip $126 into support, it could trigger a bounce toward $133, followed by potential resistance at $143. A successful breach of $143 would invalidate the current bearish thesis and signal a more strong recovery. If this occurs, Solana could regain some of the losses it has recently suffered, offering hope for investors.
Disclaimer
In line with the Trust Project guidelines, this price analysis article is for informational purposes only and should not be considered financial or investment advice. BeInCrypto is committed to accurate, unbiased reporting, but market conditions are subject to change without notice. Always conduct your own research and consult with a professional before making any financial decisions. Please note that our Terms and Conditions, Privacy Policy, and Disclaimers have been updated.
Market
This Crypto Analyst Correctly Predicted XRP Price Crash Below $2, Here’s The Rest Of The Forecast
Reason to trust
![]()
Strict editorial policy that focuses on accuracy, relevance, and impartiality
Created by industry experts and meticulously reviewed
The highest standards in reporting and publishing
Strict editorial policy that focuses on accuracy, relevance, and impartiality
Morbi pretium leo et nisl aliquam mollis. Quisque arcu lorem, ultricies quis pellentesque nec, ullamcorper eu odio.
A new XRP price forecast has emerged, offering insights into the cryptocurrency’s next bearish move. A crypto analyst who previously predicted XRP‘s crash below $2 has provided a more comprehensive outlook, outlining key support and resistance areas that will determine XRP’s next target.
According to TradingView crypto analyst, ‘MMBTrader,’ the XRP price is set to dump below the $2 threshold. As of writing, CoinMarketCap reports that XRP is trading at $2.2, reflecting a modest 3% increase in value in the last 24 hours.
XRP Price Projected To Crash To $1.5
Related Reading
The TradingView crypto expert has identified a Head and Shoulder pattern on the XRP daily chart, consisting of three peaks: left shoulder, head, and right shoulder. Typically, a classic Head and Shoulder pattern is considered one of the most common indicators of a potential price breakdown, with the price of a cryptocurrency expected to reverse from bullish to bearish.
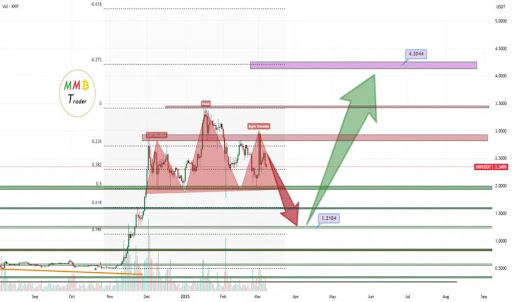
Looking at the price chart, a break below the pattern’s neckline around the $1.95 price point would confirm XRP’s bearish position. If the cryptocurrency fails to hold the $1.95 support level, a sharp drop, possibly up to 50%, is expected. This massive crash would effectively place the price around the $1.5 level or even as low as $1.2.
While he expects a possible crash to $1.5, MMBTrader also projects an alternative bullish scenario in which the XRP price initiates a strong rebound. The analyst revealed that if the cryptocurrency consolidates near $2 without breaking lower, then a bounce to new highs could follow.
Additionally, the TradingView expert believes that the asset could also experience a significant rally toward $5 after its projected 50% price crash. He highlights that if XRP can hold the support level near $1.5, then a strong reversal could occur, potentially triggering a bullish move between $4 and $4.5.
Whales Scoop Up $385 Million Amid Market Downtrend
While XRP experiences slow momentum due to the market’s recent decline, whales are seizing the opportunity to buy the dip, accumulating a significant amount of the token. According to crypto analyst Brett, an XRP whale has executed a large-scale transaction, buying over 167 million XRP, valued at $368.4 million, in a single purchase.
Related Reading
Brett revealed that this whale purchase was made as the market panicked over increasing volatility and price declines. Over the past few weeks, XRP has struggled to recover from bearish trends, joining the ranks of top cryptocurrencies like Bitcoin and Ethereum, which recorded a major price crash earlier in February.
CoinMarketCap’s data shows that the the altcoin’s price has fallen by 11.6% in just one week. This decline comes as the broader crypto market faces massive liquidations totaling hundreds of millions of dollars.
Featured image from Adobe Stock, chart from Tradingview.com

The frog-themed meme coin PEPE has surged 11% in the past 24 hours, significantly outpacing leading meme assets.
While Dogecoin (DOGE) and Shiba Inu (SHIB) have managed modest gains of 3% and 1%, respectively, PEPE has soared by double digits and is looking to extend its rally.
Whales Fuel PEPE’s Surge
PEPE’s rally comes amid a trend of significant whale acquisitions, which have fueled increased demand and bullish momentum for the meme coin.
In a March 12 post on X, on-chain sleuth Lookonchain noted that three whale wallets recently acquired 689.79 billion PEPE, valued at $5 million at current market prices, with all funds originating from Tornado Cash.
According to Lookonchain, the largest buyer, wallet 0x7A7D, spent 1,413.4 ETH ($2.72 million) for 437.7 billion PEPE, while 0x9212 and 0x7779 purchased 158.58 billion PEPE ($1 million) and 93.51 billion PEPE ($574,000), respectively.
Although the move has sparked speculation about the source of these funds, it has also triggered a resurgence in new demand for the meme coin. As its price grows, its daily trading volume also rallies. Over the past 24 hours, volume has surged by 18%, totaling $1.05 billion at press time.

When an asset’s price and trading volume surge simultaneously, it indicates strong market demand and increased buying activity, possibly driven by retail FOMO (fear of missing out) in PEPE’s case. This combination suggests bullish momentum in the meme coin’s market, signaling more gains if the trend continues.
Moreover, in the futures market, PEPE’s rising open interest highlights the capital inflow into it. As of this writing, the metric is at $120 million, rocketing 21% in the past 24 hours.
When an asset’s open interest climbs, especially during a price rally, it indicates increased market participation and capital inflow. If macro factors remain favorable and market sentiment remains bullish, there is a strong likelihood of a sustained PEPE rally.
PEPE Bulls Are Back: Key Indicator Confirms Strength
PEPE’s Elder-Ray Index has returned a positive value for the first time since January 19. This confirms the bullish shift in investors’ sentiment toward the altcoin.
The indicator measures the strength of bulls and bears in the market by analyzing the relationship between an asset’s price and a moving average.
When the Index is positive, it indicates that bulls are in control, suggesting upward momentum and potential price gains. If sustained, this trend could drive PEPE’s price toward $0.0000083.

Conversely, if buying activity weakens, PEPE could break below the support at $0.0000062 and fall to $0.0000048.
Disclaimer
In line with the Trust Project guidelines, this price analysis article is for informational purposes only and should not be considered financial or investment advice. BeInCrypto is committed to accurate, unbiased reporting, but market conditions are subject to change without notice. Always conduct your own research and consult with a professional before making any financial decisions. Please note that our Terms and Conditions, Privacy Policy, and Disclaimers have been updated.

Solana Hit by Bearish Signal After 3 Years, Price at Risk

This Crypto Analyst Correctly Predicted XRP Price Crash Below $2, Here’s The Rest Of The Forecast

PEPE Whales Propel 11% Rally, Fueling Market Optimism
Lawyer Explains Why the SEC Delay Is Not a Big Issue

WLFI Token Sale Reaches 99.3% Completion
US Strategic Bitcoin Reserve Sparks Crypto Regulation Surge

2.52 Million Altcoins Are Ruining Crypto’s Future

Animoca Brands Valuation Tanks 75% In Two Years, Here’s Why

Crypto exchange BingX hacked for $43 million

Are The Big Players Losing Interest?

Hong Kong’s Securities Association Tips Authorities On Crypto Self-Regulation

Coinbase cbBTC Set to go Live on Solana
2.52 Million Altcoins Are Ruining Crypto’s Future
Animoca Brands Valuation Tanks 75% In Two Years, Here’s Why
Crypto exchange BingX hacked for $43 million
Are The Big Players Losing Interest?
Hong Kong’s Securities Association Tips Authorities On Crypto Self-Regulation
Coinbase cbBTC Set to go Live on Solana
-

 Market23 hours ago
Will Bittensor (TAO) Rally? Key Indicators Predict Price Rebound
-
Altcoin22 hours ago
Here Are The Possible Outcomes of the Ripple vs SEC Case
-

 Market21 hours ago
Binance Receives a Record $2 Billion Investment from Abu Dhabi
-
 Bitcoin24 hours ago
Bitcoin Price Jumps as US CPI Data Falls Below Expectations
-

 Market22 hours ago
AI Agents Thrive Without Crypto: Tokenization Not Required
-
 Altcoin19 hours ago
Analyst Reveals When The XRP Price Will Hit Double & Triple Digits
-

 Market17 hours ago
Why Bitcoin Reserve Bills Fail: VeChain Executive Weighs In
-
 Market19 hours ago
ADA Long-Term Holders Show Confidence Amid 22% Price Decline