
Market
Hyperliquid (HYPE) Hits 3-Month Lows Despite High Revenue

Hyperliquid is one of the most profitable platforms in crypto right now, yet its price has been struggling, dropping over 8% in the last 24 hours and more than 24% in the past seven days. Despite its strong fundamentals, bearish momentum has kept HYPE at its lowest levels since December 2024.
However, the network’s rising revenue has outpaced Solana, Ethereum, and Raydium. This suggests underlying strength that could fuel a rebound if market conditions shift. If HYPE breaks resistance at $14.65, it could trigger a rally toward $20 or even $25.87, but failure to reclaim momentum could send it below $12.
Hyperliquid RSI Has Been Neutral Since March 4
Hyperliquid’s RSI (Relative Strength Index) is currently at 32.59, remaining in neutral territory since March 4. Suspicious high-leverage trades are raising money laundering concerns, leading to the ongoing correction.
The RSI is a momentum oscillator that measures the speed and change of price movements on a scale from 0 to 100, with values above 70 indicating overbought conditions and below 30 signaling oversold conditions.
An RSI between 30 and 50 suggests weak momentum, often aligning with a downtrend or consolidation phase.
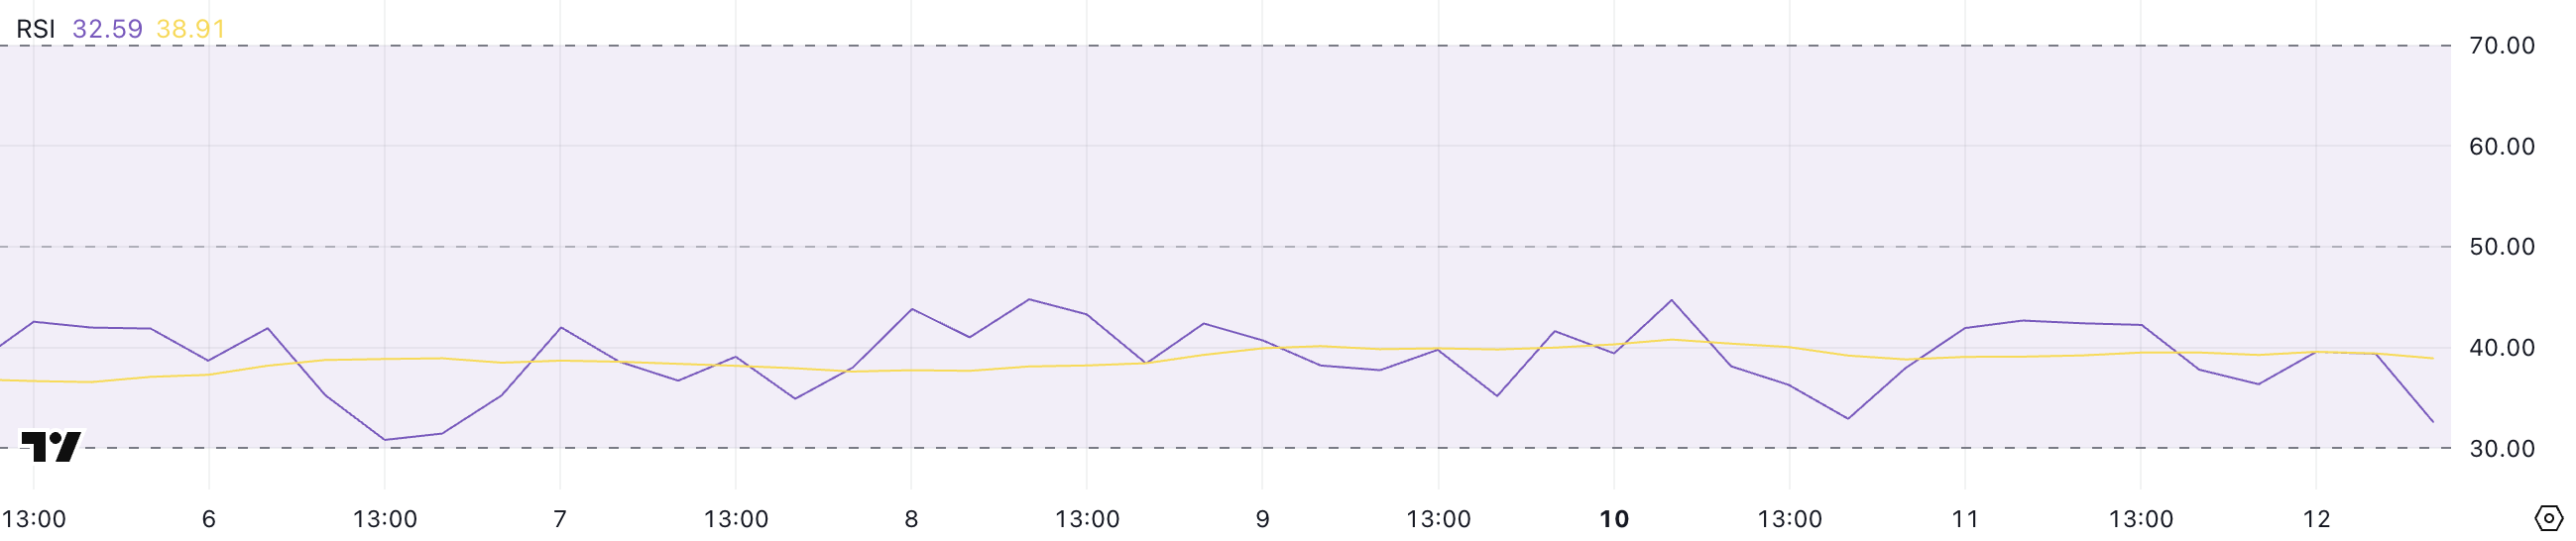
HYPE’s RSI has now stayed below 50 for nine consecutive days, reinforcing the lack of bullish momentum. With the current reading at 32.59, the asset is approaching oversold territory but hasn’t yet reached extreme levels.
This suggests that selling pressure remains dominant, but if RSI turns upward and crosses 50, it could signal the start of a stronger recovery.
Until then, Hyperliquid remains in a weak position, with price action struggling to gain upward traction.
HYPE BBTrend Has Been Negative For One Week
Hyperliquid’s BBTrend is currently at -16.69, remaining negative since March 5 and staying below -10 for the past six days.
BBTrend (Bollinger Band Trend) is an indicator that measures price momentum relative to Bollinger Bands, helping identify bullish or bearish trends.
Values above 10 indicate strong upward momentum, while values below -10 suggest strong downward pressure.
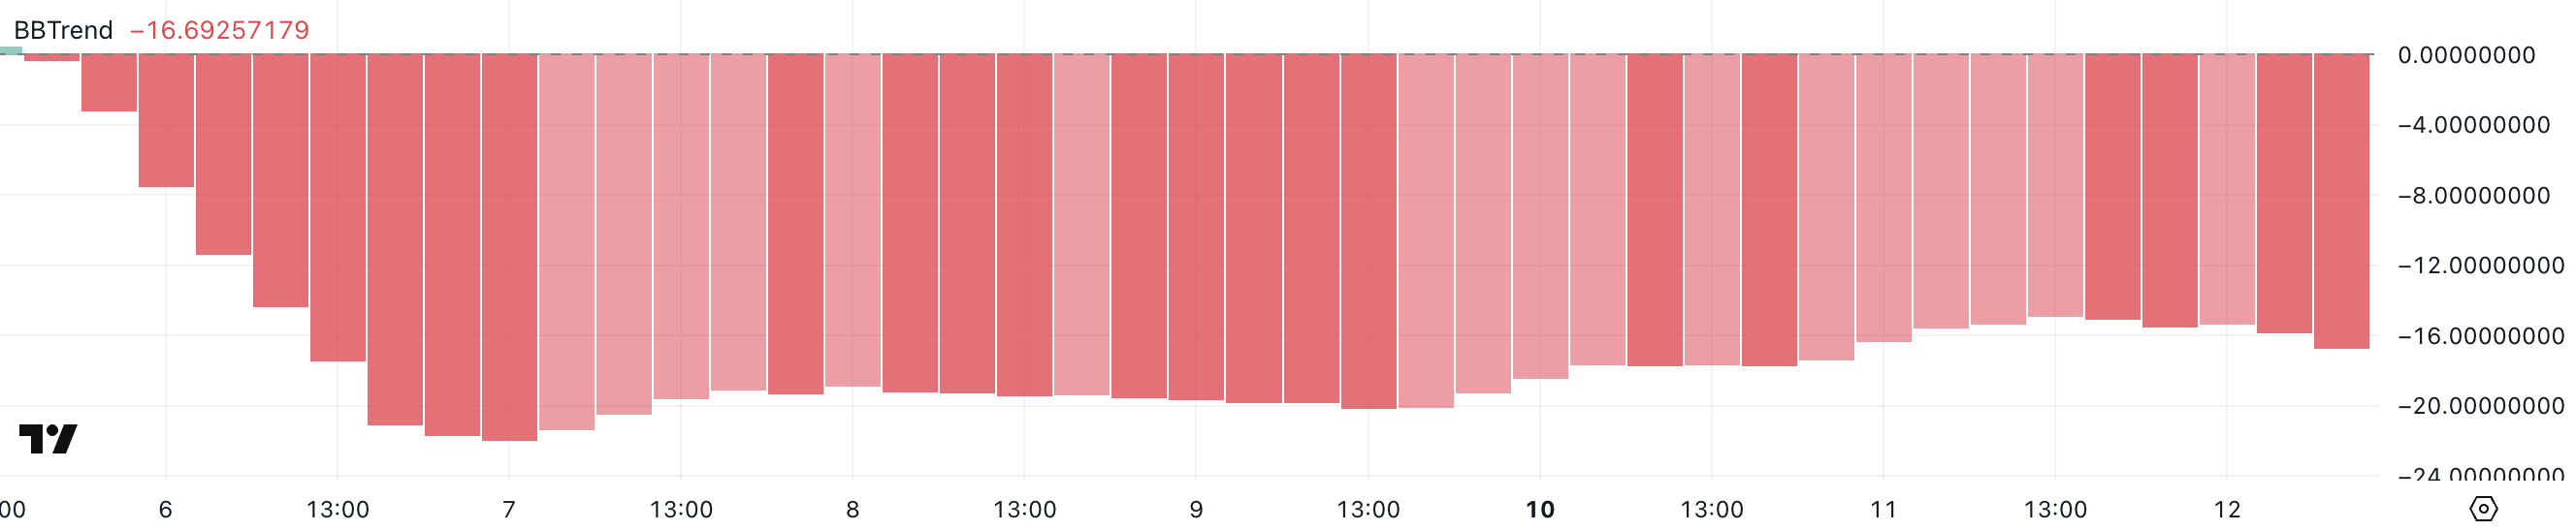
With HYPE BBTrend at -16.69, the bearish trend remains dominant, reinforcing the recent selling pressure.
Staying below -10 for several days suggests that downside momentum has been persistent, limiting any significant recovery attempts.
If the BBTrend starts moving toward 0, it could indicate a weakening downtrend, but for now, Hyperliquid remains in a clearly bearish phase.
Can HYPE Reclaim $20 In March?
Hyperliquid is currently trading at its lowest levels since December 2024, with its EMA lines signaling a strong bearish sentiment.
Short-term EMAs remain well below long-term ones, with large gaps between them indicating strong downside momentum. If the correction continues, HYPE could drop below $12, marking its lowest price in over three months.
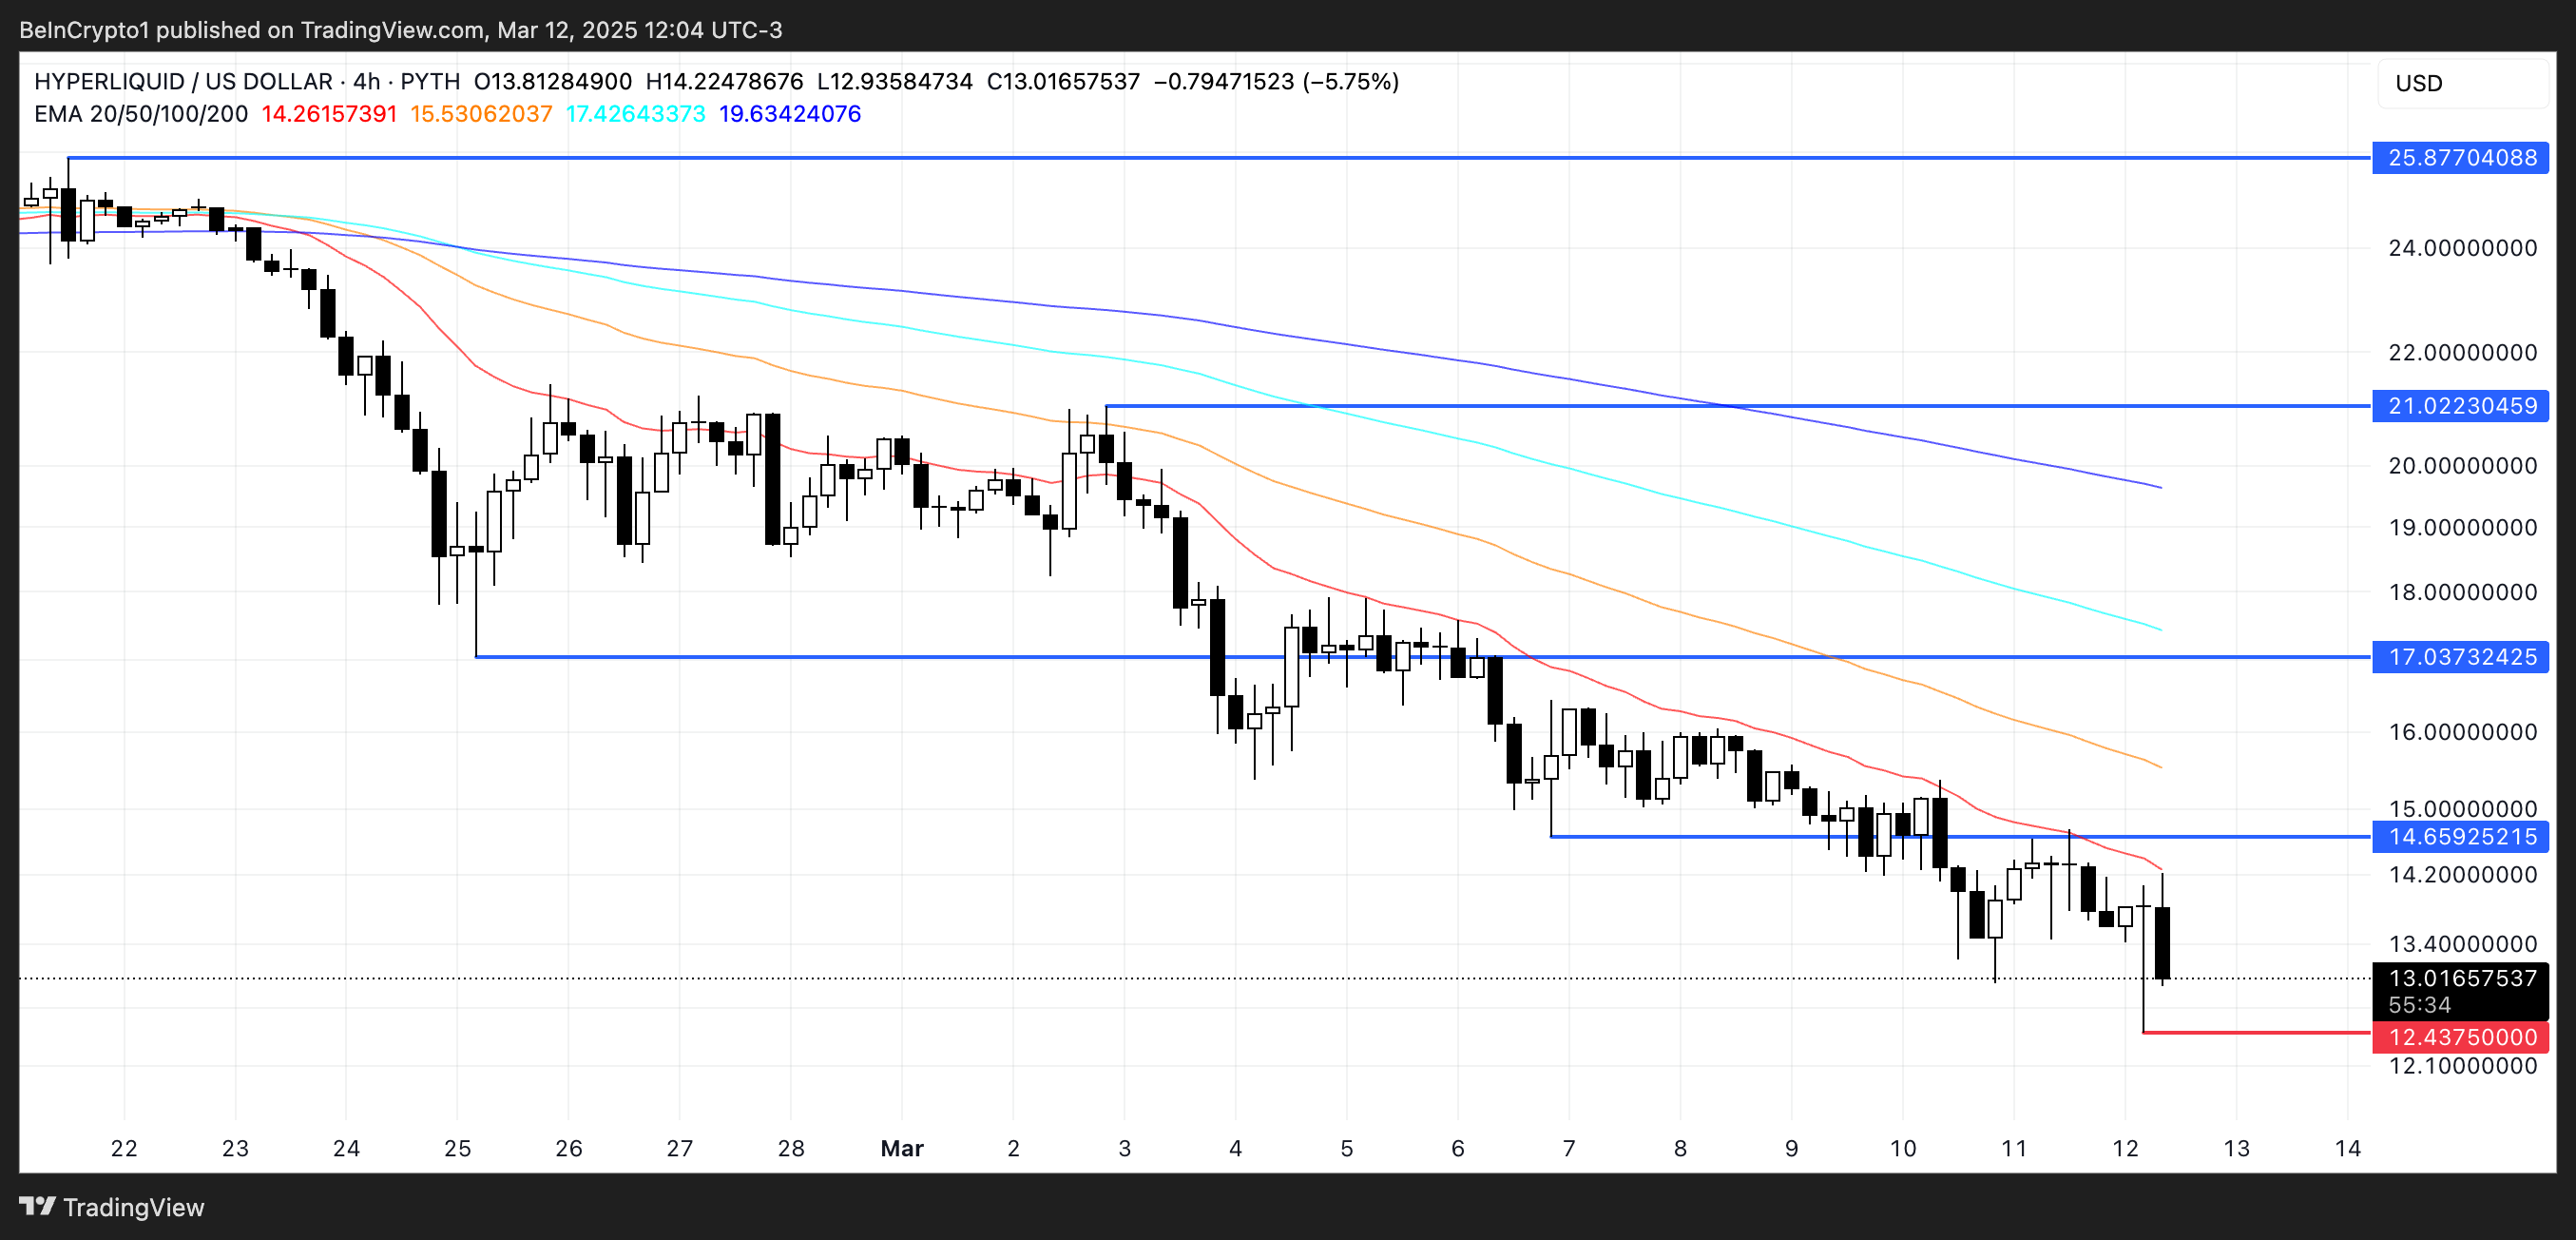
However, Hyperliquid revenue has surged past $11 million in the last seven days, outperforming major players like Pump, Solana, Ethereum, and Raydium.
If momentum returns, HYPE could test the $14.65 resistance, with a potential rally toward $17 if broken. A stronger uptrend could push the price above $20, potentially testing $21 and even $25.87 in the coming days.
Disclaimer
In line with the Trust Project guidelines, this price analysis article is for informational purposes only and should not be considered financial or investment advice. BeInCrypto is committed to accurate, unbiased reporting, but market conditions are subject to change without notice. Always conduct your own research and consult with a professional before making any financial decisions. Please note that our Terms and Conditions, Privacy Policy, and Disclaimers have been updated.


Cardano (ADA) has struggled over the past week, dropping more than 23% and remaining below $1 for over seven days. Despite this bearish pressure, technical indicators suggest that the current downtrend may be losing strength.
ADX readings show that selling momentum is fading, while whale addresses continue to decline, signaling that large investors have been offloading their holdings. Given these indicators, ADA price could soon test key resistance levels at $0.64.
Cardano’s Current Downtrend Is Fading
ADA’s Average Directional Index (ADX) has dropped to 23.4, declining from 34 yesterday and 37 two days ago. ADX is a key indicator used to measure the strength of a trend, regardless of direction, on a scale from 0 to 100.
Generally, readings above 25 indicate a strong trend, while values below 20 suggest weak or consolidating market conditions. A falling ADX signals that the current trend is losing strength, even if price movement continues in the same direction.
With ADA’s ADX declining significantly, it suggests that the ongoing downtrend may be weakening.
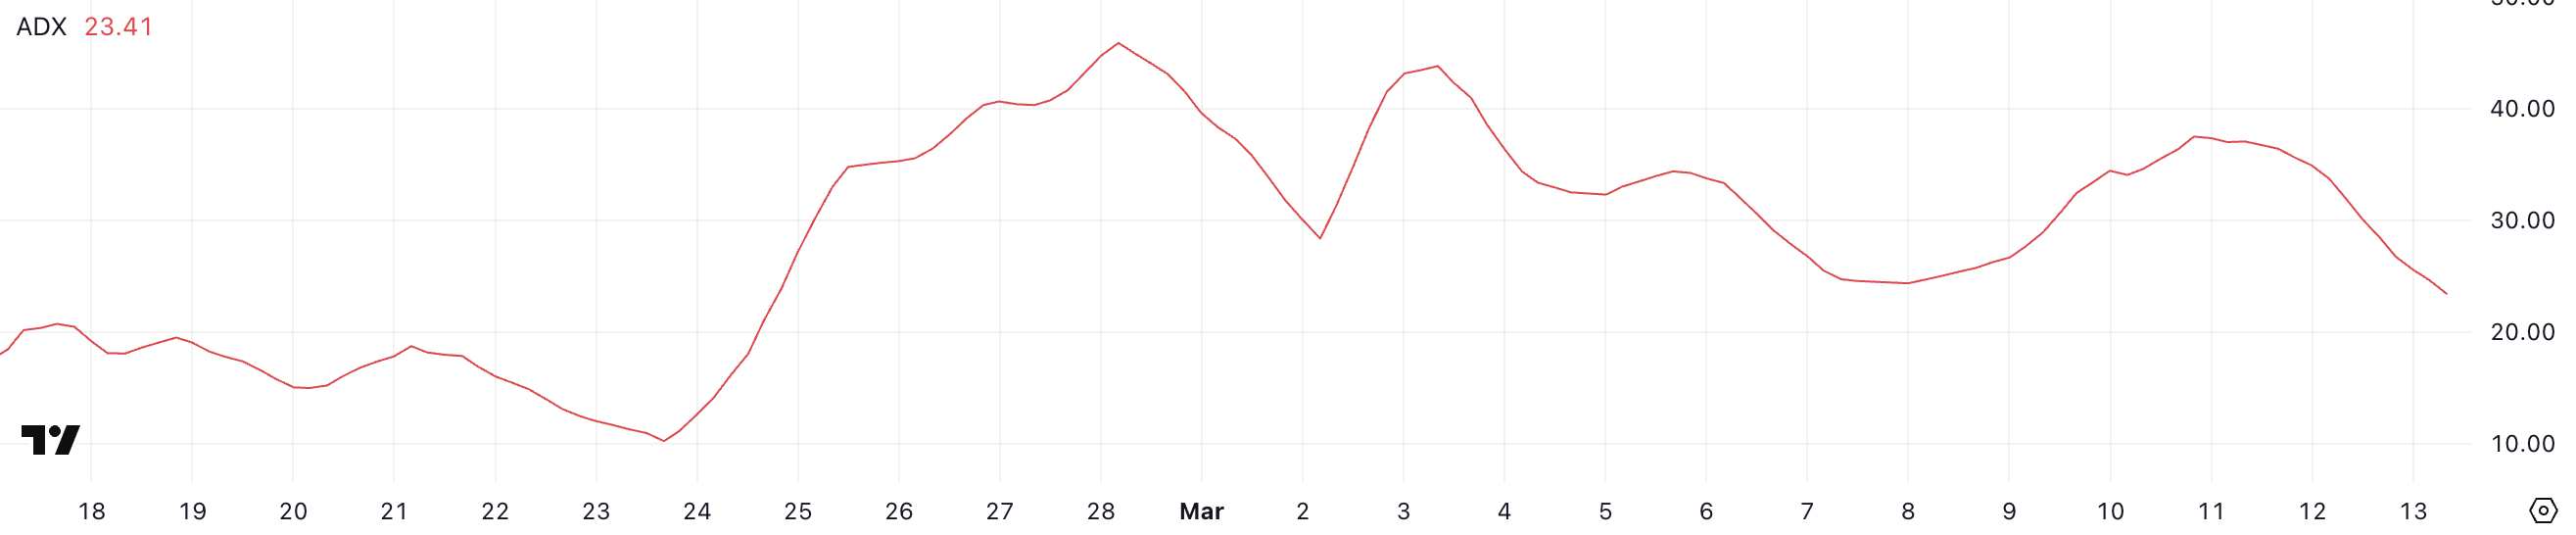
Since Cardano remains in a downtrend, the ADX drop to 23.4 indicates that bearish momentum is slowing, though it has not fully disappeared.
If ADX continues to decline and falls below 20, it would suggest that selling pressure is fading, potentially leading to consolidation or a reversal. However, for a true trend shift, ADA would need buying volume to increase alongside a rise in ADX, confirming renewed strength.
If the ADX stabilizes near current levels and turns upward again, the downtrend could regain momentum, keeping ADA under pressure in the short term.
ADA Whales Are Steadily Dropping In The Last Few Days
The number of Cardano whale addresses – those holding between 1 million and 10 million ADA – has dropped to 2,455, down from 2,484 on March 8.
This steady decline suggests that large holders have been offloading their positions over the past few days. Tracking whale activity is crucial because these high-value investors often influence market trends.
When whales accumulate, it signals confidence in the asset and can lead to price increases, while declining whale numbers suggest distribution, which can add selling pressure to the market.
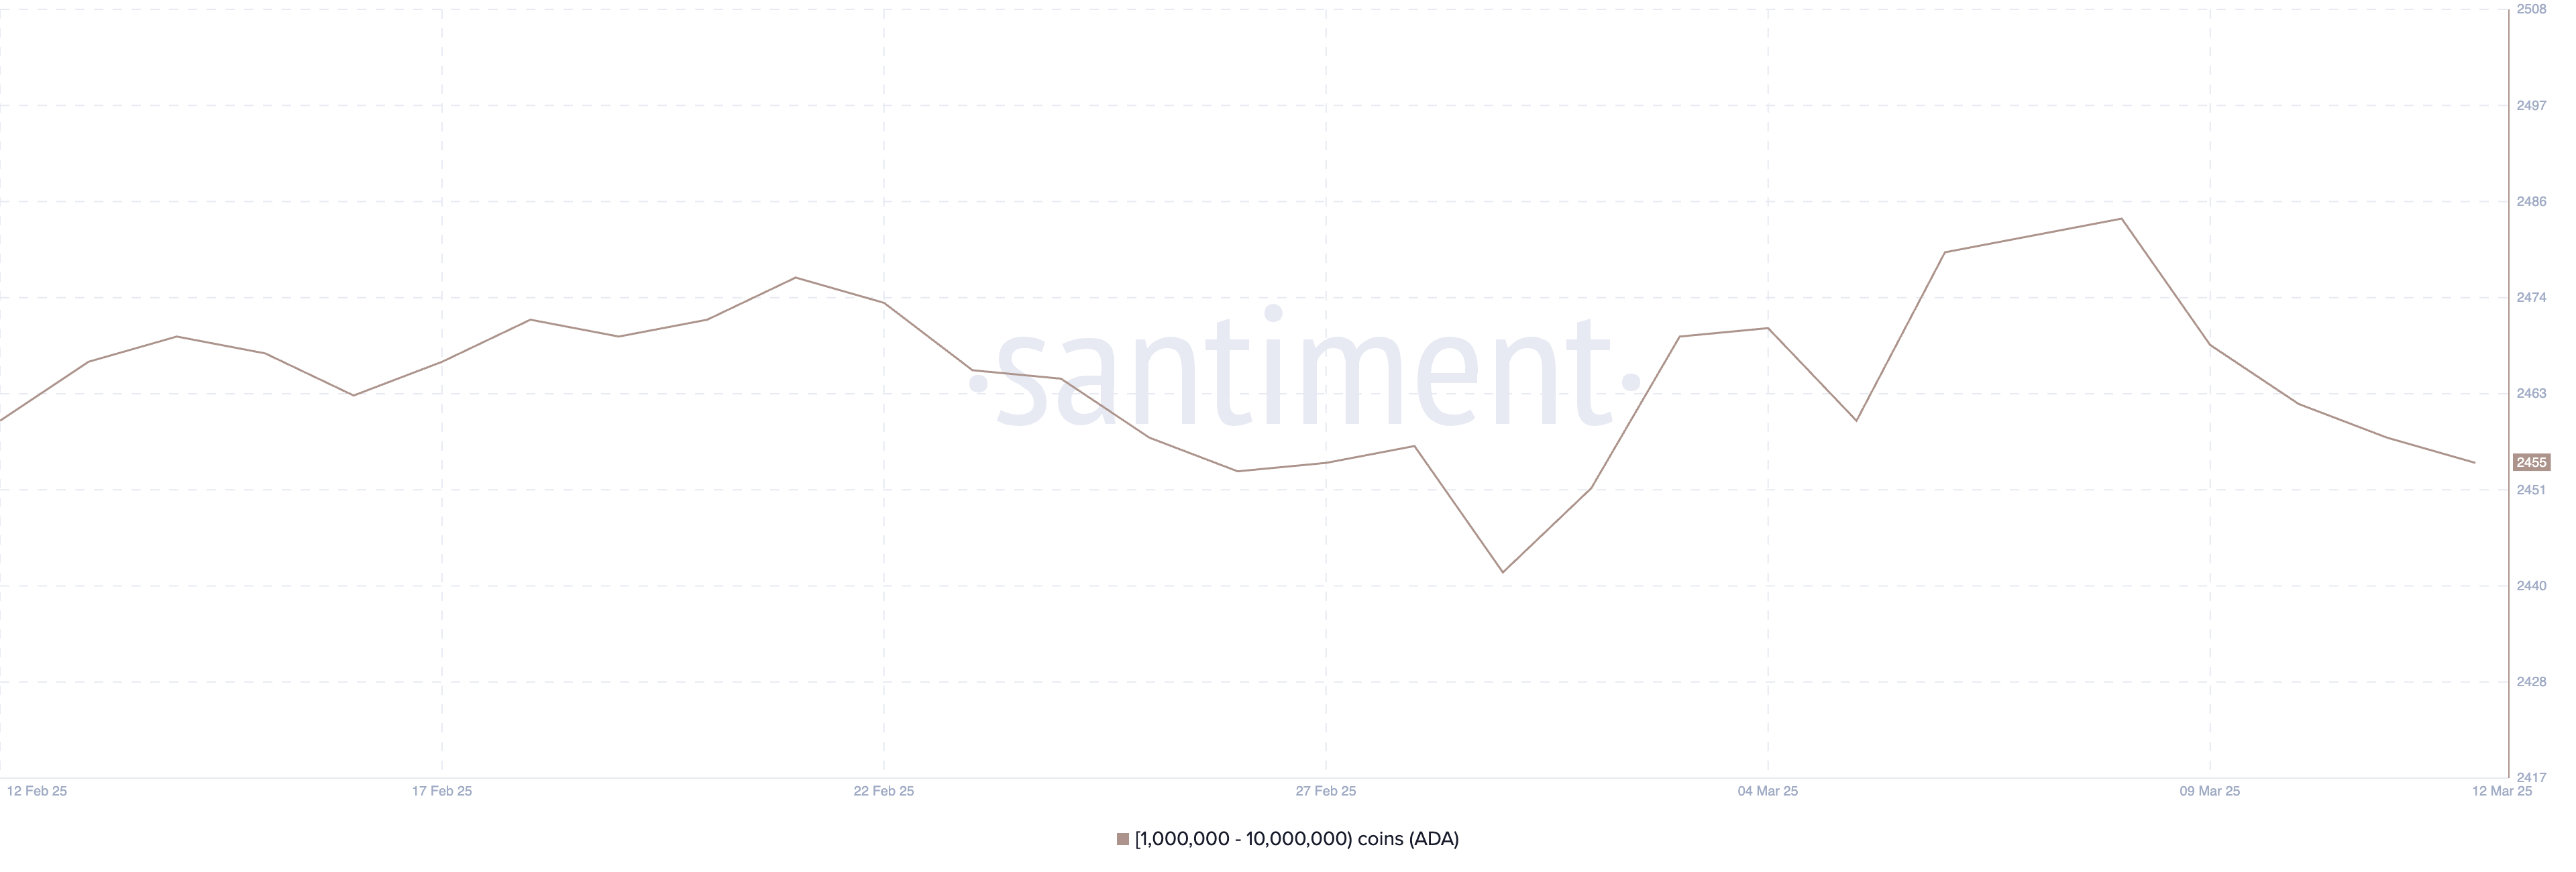
With ADA whale addresses now at their lowest level since March 2, this trend could indicate weakening confidence among large holders despite Cardano being included in the US strategic crypto reserve.
If this pattern continues, it may lead to increased volatility as smaller investors absorb the selling pressure. A sustained drop in whale holdings could also suggest that ADA lacks strong buy support at current levels, potentially prolonging its downtrend.
However, if whale numbers stabilize or begin to rise again, it could signal renewed accumulation, potentially helping ADA regain momentum.
Will Cardano Rise Back To $1 Soon?
ADA’s EMA lines indicate that Cardano is in a consolidation phase. The short-term EMAs remain below the long-term ones, but their gap is not significant.
This suggests that bearish momentum is not dominant, and a shift in trend could occur if buying pressure increases. If ADA can test the resistance at $0.75 and establish an uptrend, it could climb toward $0.81.
A stronger bullish breakout could push Cardano’s price higher. The potential upside targets are $1.02 and even $1.17, if momentum continues to build.
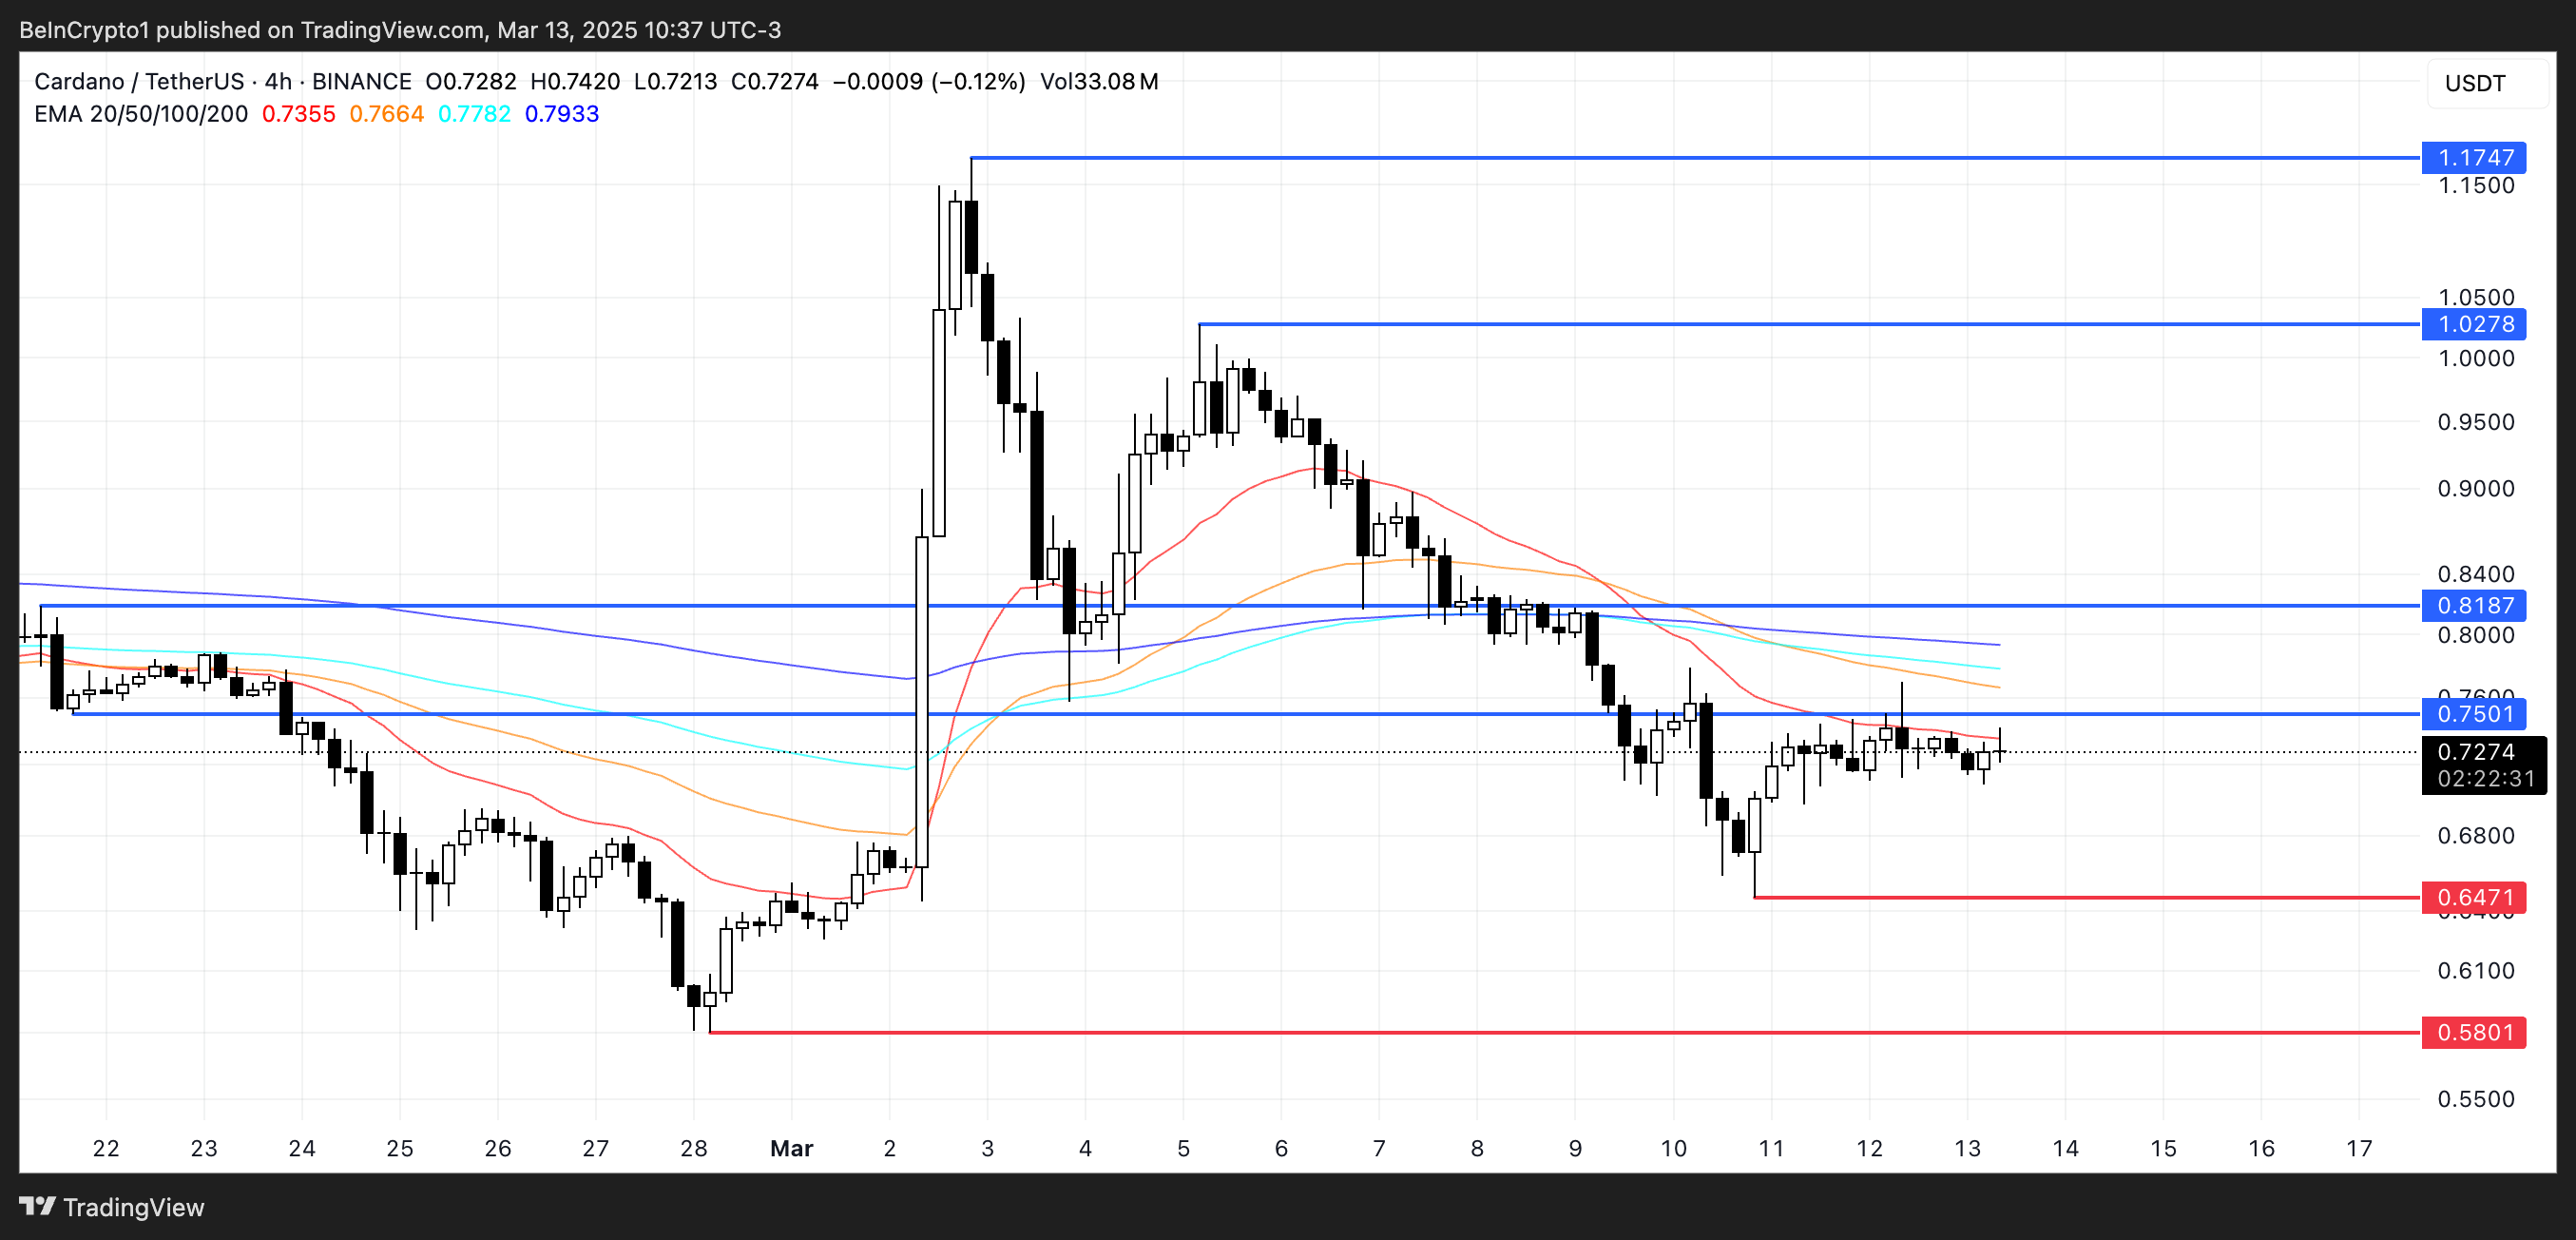
On the downside, if selling pressure intensifies, ADA could test its key support at $0.64.
Losing this level would weaken its structure and increase the likelihood of further declines, potentially sending the price down to $0.58.
The relatively close EMA lines indicate that Cardano is in a pivotal phase, during which either a breakout or a breakdown could occur.
Disclaimer
In line with the Trust Project guidelines, this price analysis article is for informational purposes only and should not be considered financial or investment advice. BeInCrypto is committed to accurate, unbiased reporting, but market conditions are subject to change without notice. Always conduct your own research and consult with a professional before making any financial decisions. Please note that our Terms and Conditions, Privacy Policy, and Disclaimers have been updated.


US inflation eased in February for the first time in four months; an aspect that has aided the much-awaited crypto recovery. Even so, most cryptocurrencies, including majors like Bitcoin, remain under selling pressure amid tariff jitters. The hype surrounding meme coins has also slowed in recent months with several recording double-digit losses.
However, revolutionary projects like Bitcoin Pepe continue to capture the attention of savvy investors worldwide. Less than a month since the launch of its presale, the crypto has sold out its initial five stages as meme coin lovers and Bitcoin enthusiasts alike rush to amass BPEP tokens at an affordable rate.
Pepe readies for a breakout as inflation data bolsters crypto recovery
Since early December 2024 when it hit its all-time high, Pepe has plunged by about 74%. Indeed, this is not an isolated case as some major meme coins like Dogecoin, Shiba Inu, and Popcat have also recorded double-digit losses during the same timeframe.
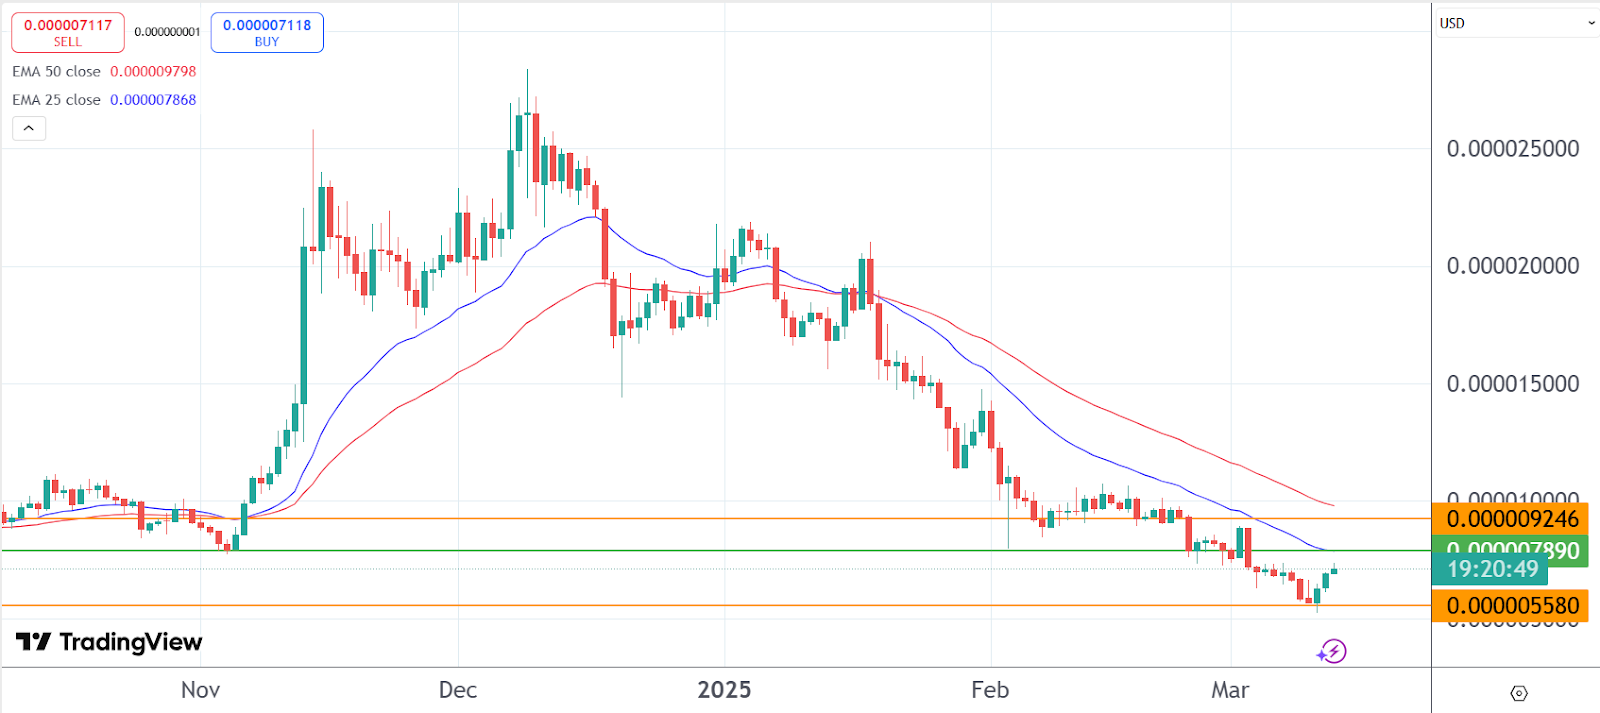
A look at Pepe’s daily price chart indicates that the crypto may successfully stage a breakout in the ensuing days or weeks. Earlier in the week, the meme coin hit its lowest level in over a year at $0.000005228 as the sell-off continued to weigh on cryptocurrencies. It has since rebounded to $0.000007130 as at the time of writing.
While it is still trading below the 25 and 50-day EMAs, its RSI indicator is facing upwards. Besides, the encouraging US CPI data released on Wednesday has contributed to the observed crypto recovery.
According to Labor Department, the country’s inflation has eased for the first time in four months; slowing beyond expectations in February. The headline CPI dropped to 2.8% from 3% while core inflation was down from 3.3% to 3.2%.
In the short term, the range between the support zone of $0.000005580 and the resistance level of $0.000009246 will be worth watching. Notably, the crypto may face some resistance along the 25-day EMA at $0.000007890 before gathering enough bullish momentum to rebound further.
Bitcoin Pepe’s potential to sustain its momentum growth
The hype surrounding meme coins has cooled in recent months as the bitcoin season persists. Even so, savvy investors are still on the look out for revolutionary projects with huge growth potential. Indeed, it is Bitcoin Pepe’s uniqueness and potential that has attracted a large number of investors in such a short period.
In less than a month, the project has already sold out its initial five stages and has raised over $4.6 million. As its momentum builds steadily, Bitcoin Pepe has secured its position as one of the ICOs crushing it in 2025.
Its vision of building Solana on Bitcoin is seen to be the network’s missing puzzle and investors are rushing to amass some BPEP tokens at an affordable price. Its Layer-2 solution creates an ideal meme trading platform that assures speed and security.
Besides, its pricing model favors long-term holders and early adopters. At the current stage 6, the initial investors have already secured gains of 27.6%. By the end of the 30 stages, their capital investment will have earned cumulative gains of 311.4%. As such, this is the opportune time for savvy investors to board this highly profitable bandwagon. Hurry up and buy Bitcoin Pepe here.
Shift in market sentiment to offer Bitcoin price another chance at retesting crucial zone
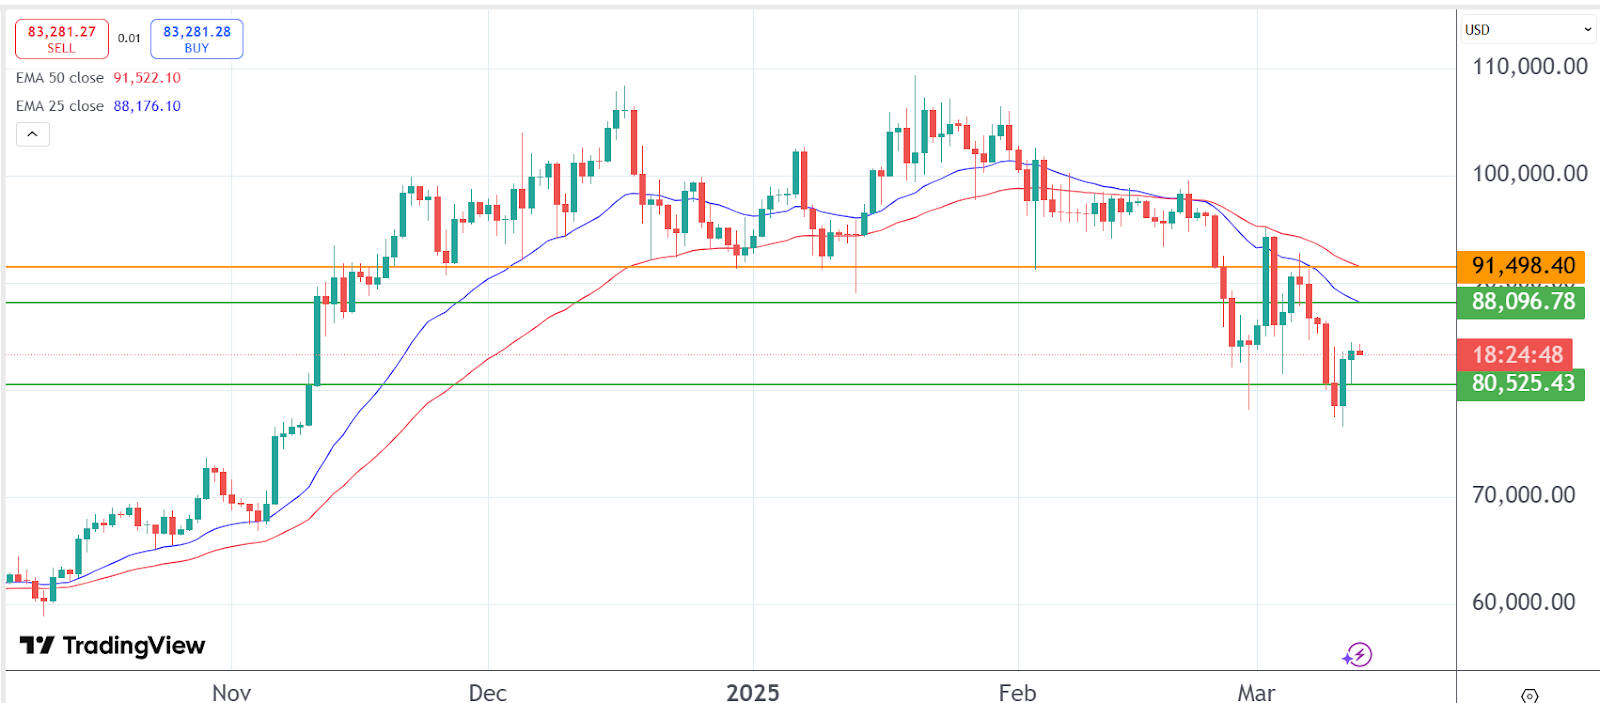
The crypto fear & greed index still exudes fear as the selling pressure continues to shape the sector. However, Bitcoin price appears to be finding its floor as the market reacts to the positive US inflation data.
A look at its daily chart indicates that the crypto is still trading below the 25 and 50-day EMAs; a sign that it is not out of the woods yet.
In the short term, the range between the support zone of $80,525 and the 25-day EMA at $88,096 will be worth watching. A shift in the market sentiment may have the bulls break that resistance for a chance to rebound past the crucial zone of $90,000. More specifically, the target will be along the 50-day EMA at $91,498.

Stellar (XLM) has surged more than 10% in the last 24 hours, attempting to recover from a 15% correction over the past month. Despite this rebound, XLM’s trend remains at an important point, with its market cap now standing at $8.6 billion.
Technical indicators show that buying pressure has increased significantly, with DMI and CMF both pointing to growing accumulation. However, XLM still faces key resistance levels, and whether it can sustain this momentum will determine if the price can break above $0.35 or if further consolidation is ahead.
XLM Chart Shows Buyers Are Now In Control
Stellar’s DMI chart shows that its Average Directional Index (ADX) has dropped to 28.7, down from 35.6 two days ago. ADX is a key indicator that measures the strength of a trend, regardless of direction, with values above 25 typically signaling a strong trend and values below 20 suggesting a weak or consolidating market.
A declining ADX, even while the price moves in a certain direction, indicates that the strength of the trend is fading.
In this case, the drop from 35.6 to 28.7 suggests that Stellar’s bearish trend is weakening, creating an opportunity for a possible shift in momentum.

Looking at the Directional Indicators, +DI has surged to 31.2 from 8, while -DI has dropped to 16.4 from 30.7. This major shift in buying and selling pressure suggests that bulls have regained control after a period of strong selling.
Since Stellar is attempting to transition from a downtrend into an uptrend, this increase in +DI is a positive signal. However, for the new trend to gain strength, ADX would need to stabilize and turn upward, confirming growing momentum.
If ADX continues declining, XLM could consolidate before making a decisive move, but if it rises alongside +DI, it will reinforce a stronger breakout to the upside.
XLM CMF Has Surged Since March 10
Stellar’s Chaikin Money Flow (CMF) indicator has risen to 0.13, recovering from -0.14 just three days ago, after briefly peaking at 0.18 a few hours ago. CMF measures buying and selling pressure by analyzing both price movement and volume on a scale from -1 to 1.
A positive CMF value suggests that buying pressure is dominant, while a negative reading indicates stronger selling activity.
Generally, values above 0.05 signal accumulation, whereas values below -0.05 indicate distribution, making CMF a useful tool for assessing whether capital is flowing into or out of an asset.

With Stellar’s CMF now at 0.13, buying pressure has clearly strengthened, reversing the prior bearish trend seen when CMF was negative.
This shift suggests that investors have been accumulating XLM over the past few days, supporting its recent price recovery. However, since CMF peaked at 0.18 before slightly declining, some short-term profit-taking may have occurred.
If CMF remains in positive territory and trends higher again, it will reinforce further upside potential, but if it starts dropping back toward negative values, it could signal weakening demand and a possible price pullback.
Will Stellar Surpass $0.35 In March?
Stellar’s EMA lines still indicate a bearish trend, with short-term EMAs positioned below the long-term ones. However, the recent upward movement in short-term EMAs suggests that momentum could be shifting, increasing the chances of a trend reversal.
If buying pressure continues, Stellar’s price could rise to test the resistance at $0.309, a key level that would determine whether the recovery can sustain itself.
A breakout above this resistance could fuel further upside, potentially pushing XLM toward $0.349. A stronger uptrend could lead to a rally toward $0.375.

On the downside, if the short-term recovery loses strength and buyers fail to establish an uptrend, Stellar could face renewed selling pressure.
In this scenario, the first key support level to watch would be $0.273, which has acted as a critical zone in previous price action. A breakdown below this level could expose XLM to further losses, with support at $0.252 as the next major level.
If bearish momentum intensifies, the price could decline further, potentially reaching $0.226, marking a deeper correction before any potential reversal.
Disclaimer
In line with the Trust Project guidelines, this price analysis article is for informational purposes only and should not be considered financial or investment advice. BeInCrypto is committed to accurate, unbiased reporting, but market conditions are subject to change without notice. Always conduct your own research and consult with a professional before making any financial decisions. Please note that our Terms and Conditions, Privacy Policy, and Disclaimers have been updated.

Cardano Whales Sell Off as ADA Faces Market Uncertainty

Bitcoin Pepe momentum gains steam as crypto market crashes

Dogecoin Price Set For Massive Rebound After Indicators Call The Bottom
Stellar (XLM) Jumps 10% as Bulls Take Charge: What’s Next?

Dogecoin Price Closes Daily Candle With Lower Wick, Why Another Crash Could Be Coming

PENGU and PNUT Still Bearish After Robinhood Listing

2.52 Million Altcoins Are Ruining Crypto’s Future

Animoca Brands Valuation Tanks 75% In Two Years, Here’s Why

Crypto exchange BingX hacked for $43 million

Are The Big Players Losing Interest?

Hong Kong’s Securities Association Tips Authorities On Crypto Self-Regulation

Coinbase cbBTC Set to go Live on Solana
2.52 Million Altcoins Are Ruining Crypto’s Future
Animoca Brands Valuation Tanks 75% In Two Years, Here’s Why
Crypto exchange BingX hacked for $43 million
Are The Big Players Losing Interest?
Hong Kong’s Securities Association Tips Authorities On Crypto Self-Regulation
Coinbase cbBTC Set to go Live on Solana
-

 Market20 hours ago
Solana (SOL) Faces Many Challenges—Can Bulls Hold the Line?
-

 Market15 hours ago
PEPE Whales Propel 11% Rally, Fueling Market Optimism
-

 Market22 hours ago
Bitcoin Price Recovery Possible Above $85K—Will Bulls Step In?
-
 Bitcoin16 hours ago
US Strategic Bitcoin Reserve Sparks Crypto Regulation Surge
-
 Altcoin20 hours ago
Dogecoin Price Eyes $3 Target As DOGE Bounces From Crucial Support
-

 Market18 hours ago
XRP Bulls Ready to Charge—Upside Break May Spark Rally
-
 Market23 hours ago
Ondo Finance (ONDO) Bulls Push for a Breakout Above $1
-
 Bitcoin20 hours ago
Bitcoin’s New Phase: Glassnode Reveals Distribution Shift