
Market
Solana ETF Delay Fuels Bearish Sentiment, $16M Pulled from SOL

On Tuesday, the US Securities and Exchange Commission (SEC) postponed its decision on multiple altcoin exchange-traded funds (ETFs), including Solana’s.
This development has further dampened investor sentiment toward SOL, which has continued to witness significant spot market outflows.
Solana Investors Exit Amid SEC Delay—$16 Million Pulled Under 24 Hours
In a series of filings made on March 11, the SEC announced its plans to postpone its decision on multiple ETFs tied to major assets, one of which is SOL. According to the regulator, it has “designated a longer period” to review the proposed rule changes that would enable the ETFs to become operational.
This has exacerbated the bearish sentiment toward SOL, which is reflected in the capital outflows from its spot markets over the past 24 hours. As of this writing, $16.43 million has been removed from the market, marking the seventh day of consecutive outflows, which have now exceeded $250 million.
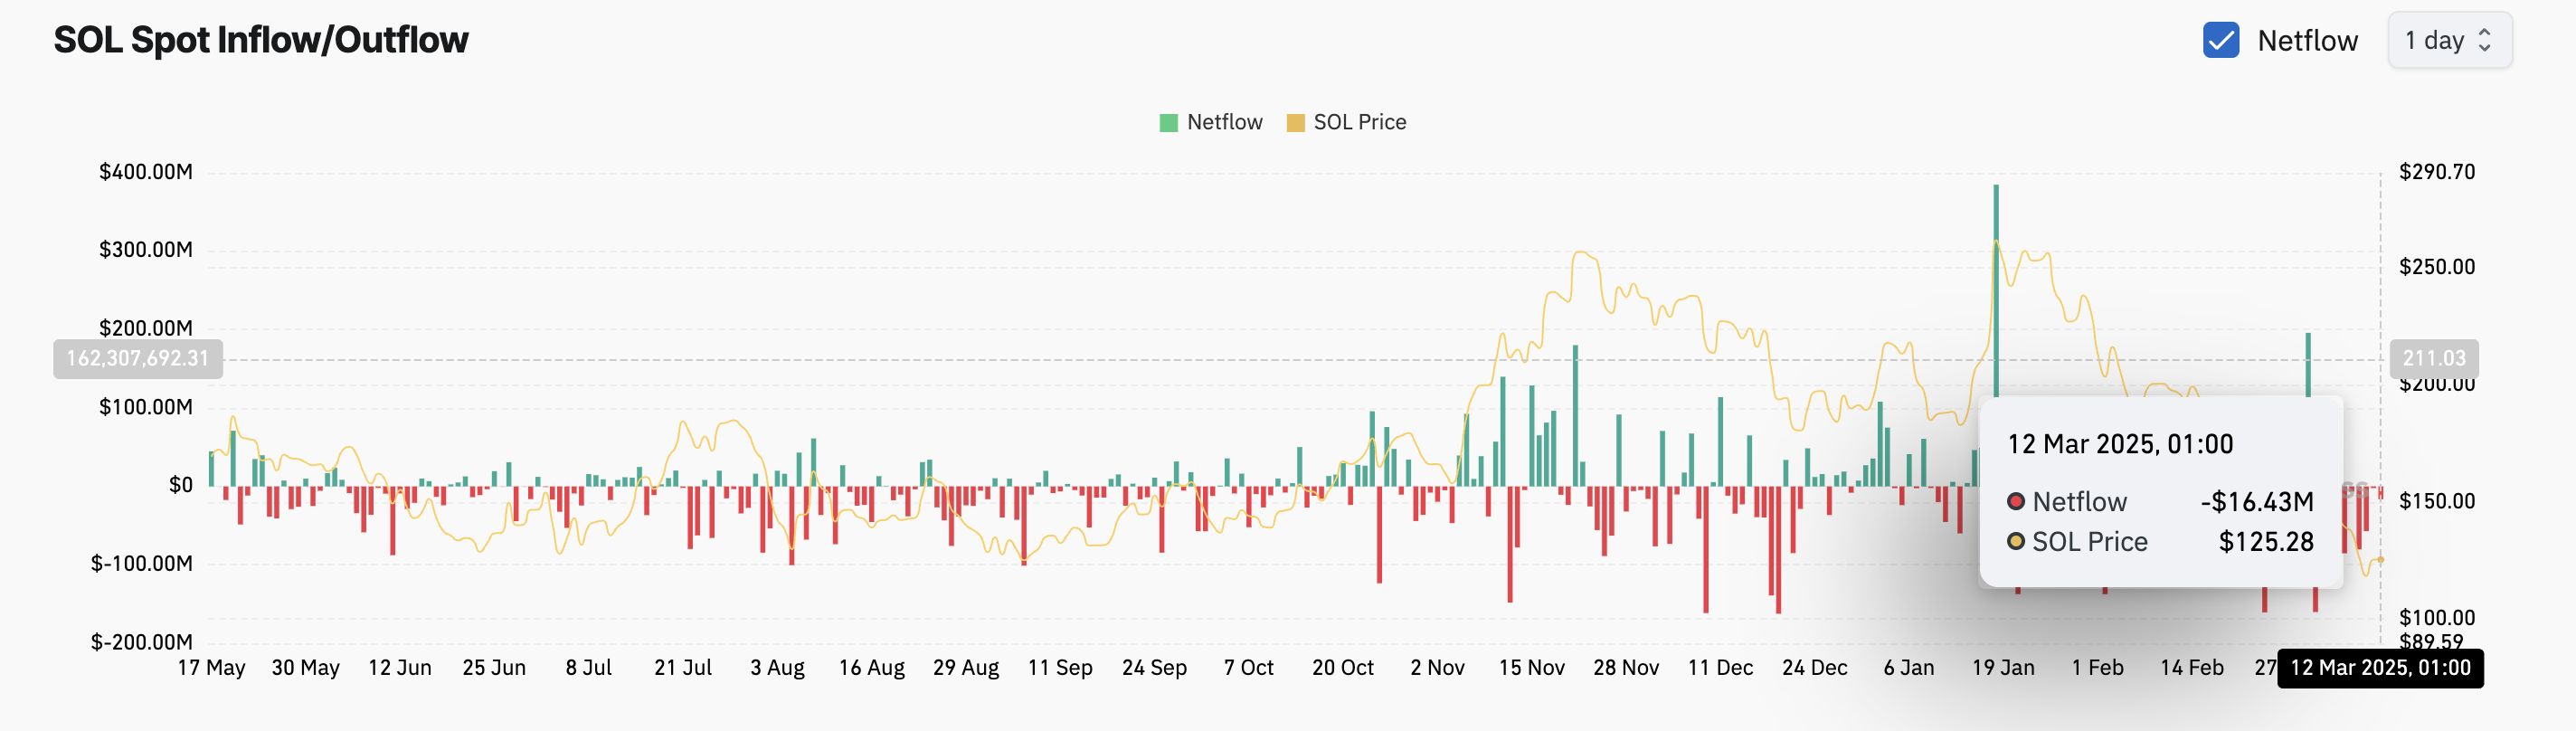
When an asset experiences spot outflows like this, its investors are selling their holdings. This trend reflects a lack of confidence in SOL’s short-term price recovery, with traders choosing to cash in their accrued gains to prevent further losses on investments.
Furthermore, SOL’s Moving Average Convergence Divergence (MACD) indicator, observed on a daily chart, supports this bearish outlook. As of this writing, the coin’s MACD line (blue) is below its signal line (orange).
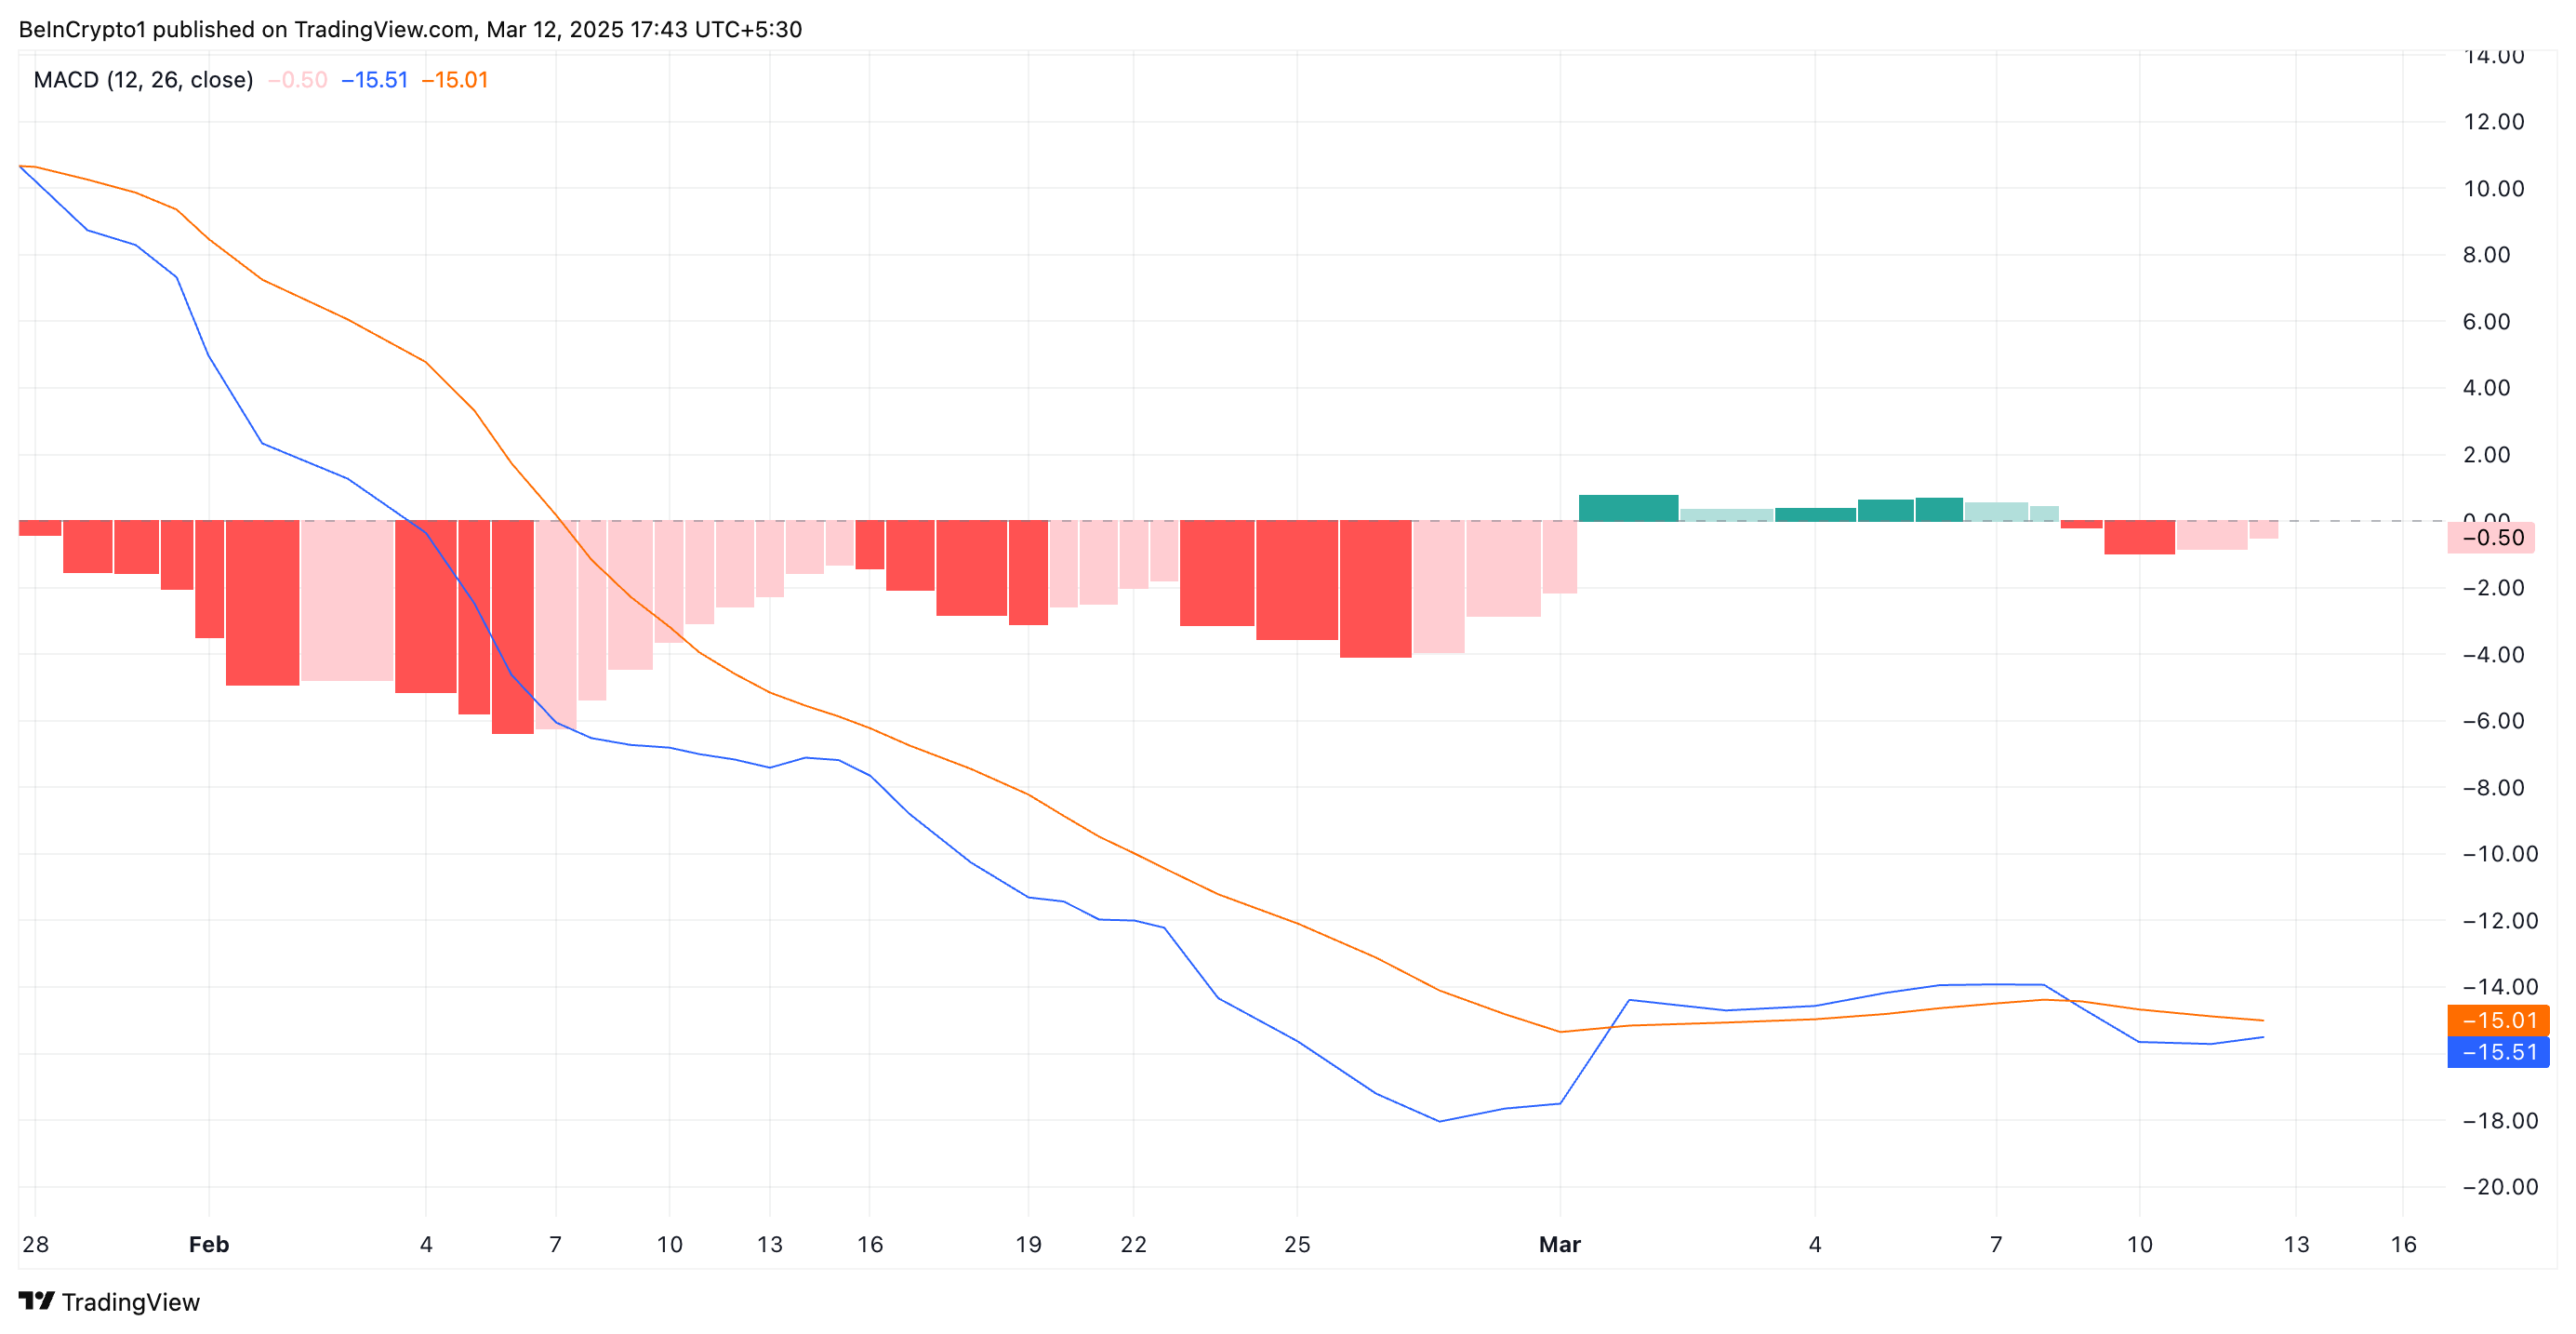
An asset’s MACD measures its price trends and momentum shifts and identifies potential buy or sell signals based on the crossing of the MACD line, signal line, and changes in the histogram.
When the MACD line rests under the signal line, the market is in a bearish trend. This indicates that SOL selloffs exceed buying activity among market participants, hinting at a further value drop.
Solana at Crossroads: Will SOL Hold $126 or Fall to $110?
SOL trades at $126.82 at press time. With waning buying pressure, it risks falling to $110, a low that it last reached in August 2024.
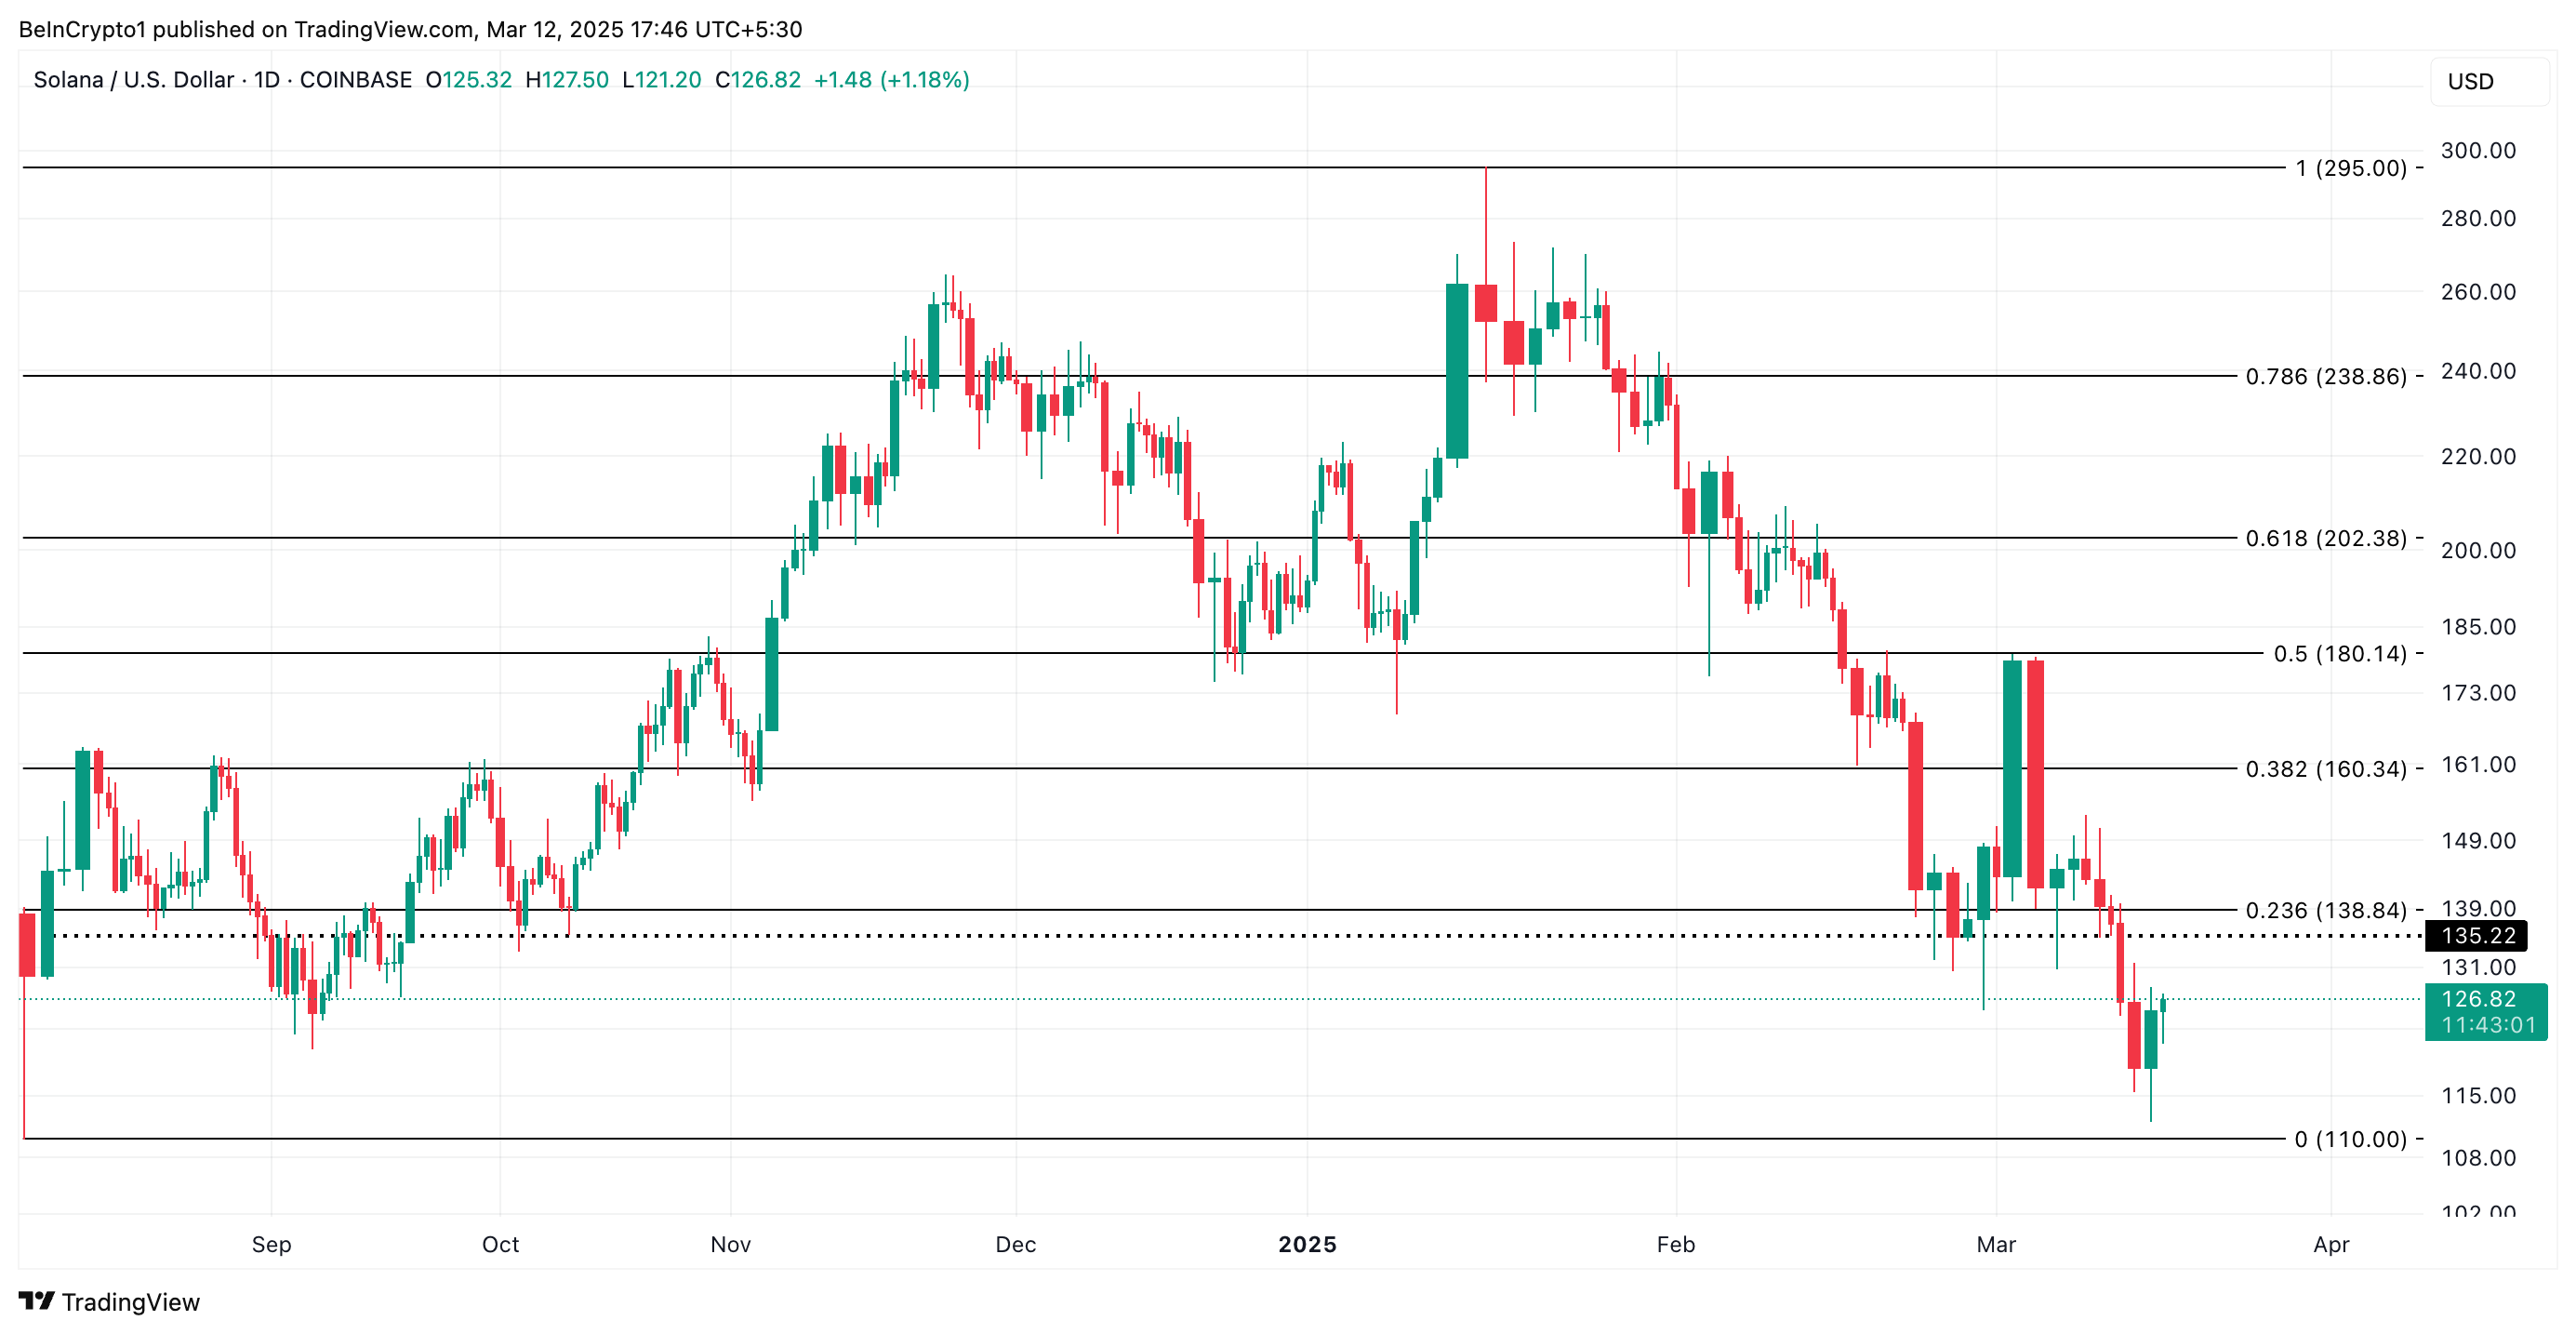
However, a strong resurgence in buying activity would prevent this. For this to happen, SOL has to establish a strong support flow at $135.22. If successful, it could propel its price to trade at $138.84 and above.
Disclaimer
In line with the Trust Project guidelines, this price analysis article is for informational purposes only and should not be considered financial or investment advice. BeInCrypto is committed to accurate, unbiased reporting, but market conditions are subject to change without notice. Always conduct your own research and consult with a professional before making any financial decisions. Please note that our Terms and Conditions, Privacy Policy, and Disclaimers have been updated.


The United States Bankruptcy Court for the District of Delaware granted a motion allowing the joint liquidators of Three Arrows Capital (3AC) to amend their original proof of claim in the FTX bankruptcy proceedings. This increases their claims from $120 million to $1.53 billion.
The amended filing broadened 3AC’s allegations against FTX to include breach of contract, breach of fiduciary duty, unjust enrichment, and proprietary restitutionary claims.
3AC’s Liquidators Secure Major Victory in FTX Case
The ruling stems from a motion filed by 3AC’s liquidators, Russell Crumpler and Christopher Farmer. For context, the liquidators initially filed their proof of claim in June 2023.
It sought to recover funds related to preference, conversion, and other avoidance actions tied to a $120 million loan allegedly owed by 3AC to FTX. Nonetheless, after further investigation, the liquidators determined that 3AC’s dealings with FTX were far more extensive.
“The information obtained by the Liquidators in the year since they filed their Original POC led them to the new conclusion that just two weeks before the commencement of the 3AC Liquidation, the $1.53 billion of assets that 3AC had on the FTX platform were liquidated to satisfy $1.3 billion in liabilities to FTX,” the document read.
Furthermore, according to court documents, the liquidators faced substantial obstacles during their investigation. This included a lack of proper records from 3AC. In addition, the cooperation was minimal from the company’s founders, Kyle Davies and Su Zhu.
Delays in receiving critical documents and data compounded these challenges. Much of the key information was only made available in late 2023 and early 2024. This came after FTX itself had filed for bankruptcy in November 2022. The exchange collapsed amid allegations of fraud and mismanagement under former CEO Sam Bankman-Fried.
This delay prevented the liquidators from fully understanding the scope of 3AC’s transactions with FTX until after the original claims deadline had passed.
“The evidence makes clear that the description of the facts contained in the Original POC was based on the limited information that the Liquidators had available to them at that time,” Judge John T. Dorsey wrote.
Meanwhile, FTX objected to the motion. They argued that the amendment was filed too late and expanded the scope of the claims, violating the bankruptcy process. The debtors claimed that the original proof of claim did not provide sufficient notice of the nature or the amount of the newly proposed claims.
However, the court dismissed FTX’s objections, siding with 3AC’s liquidators and approving the expanded claim. Additionally, the court found that much of the delay in filing the amended claim was attributable to FTX’s failure to provide the necessary documents to the liquidators promptly.
“Having considered all the evidence presented, I find that the balance of the equities is in favor of allowing the Amended POC,” Judge Dorsey noted.
This latest development occurs alongside Bankman-Fried’s ongoing efforts to secure a pardon from President Donald Trump. To strengthen his case, Bankman-Fried has sought to align himself with right-wing figures.
He recently appeared on Tucker Carlson’s show and has reportedly consulted with a lawyer linked to Trump. Despite Trump’s history of pardons, skepticism remains due to SBF’s lack of support in the crypto community.
Disclaimer
In adherence to the Trust Project guidelines, BeInCrypto is committed to unbiased, transparent reporting. This news article aims to provide accurate, timely information. However, readers are advised to verify facts independently and consult with a professional before making any decisions based on this content. Please note that our Terms and Conditions, Privacy Policy, and Disclaimers have been updated.

Aayush Jindal, a luminary in the world of financial markets, whose expertise spans over 15 illustrious years in the realms of Forex and cryptocurrency trading. Renowned for his unparalleled proficiency in providing technical analysis, Aayush is a trusted advisor and senior market expert to investors worldwide, guiding them through the intricate landscapes of modern finance with his keen insights and astute chart analysis.
From a young age, Aayush exhibited a natural aptitude for deciphering complex systems and unraveling patterns. Fueled by an insatiable curiosity for understanding market dynamics, he embarked on a journey that would lead him to become one of the foremost authorities in the fields of Forex and crypto trading. With a meticulous eye for detail and an unwavering commitment to excellence, Aayush honed his craft over the years, mastering the art of technical analysis and chart interpretation.
As a software engineer, Aayush harnesses the power of technology to optimize trading strategies and develop innovative solutions for navigating the volatile waters of financial markets. His background in software engineering has equipped him with a unique skill set, enabling him to leverage cutting-edge tools and algorithms to gain a competitive edge in an ever-evolving landscape.
In addition to his roles in finance and technology, Aayush serves as the director of a prestigious IT company, where he spearheads initiatives aimed at driving digital innovation and transformation. Under his visionary leadership, the company has flourished, cementing its position as a leader in the tech industry and paving the way for groundbreaking advancements in software development and IT solutions.
Despite his demanding professional commitments, Aayush is a firm believer in the importance of work-life balance. An avid traveler and adventurer, he finds solace in exploring new destinations, immersing himself in different cultures, and forging lasting memories along the way. Whether he’s trekking through the Himalayas, diving in the azure waters of the Maldives, or experiencing the vibrant energy of bustling metropolises, Aayush embraces every opportunity to broaden his horizons and create unforgettable experiences.
Aayush’s journey to success is marked by a relentless pursuit of excellence and a steadfast commitment to continuous learning and growth. His academic achievements are a testament to his dedication and passion for excellence, having completed his software engineering with honors and excelling in every department.
At his core, Aayush is driven by a profound passion for analyzing markets and uncovering profitable opportunities amidst volatility. Whether he’s poring over price charts, identifying key support and resistance levels, or providing insightful analysis to his clients and followers, Aayush’s unwavering dedication to his craft sets him apart as a true industry leader and a beacon of inspiration to aspiring traders around the globe.
In a world where uncertainty reigns supreme, Aayush Jindal stands as a guiding light, illuminating the path to financial success with his unparalleled expertise, unwavering integrity, and boundless enthusiasm for the markets.

Key takeaways
- Bitcoin could surge towards the $85k level after sweeping the $78k liquidity zone.
- Bitcoin Pepe’s presale has surpassed $4.5 million, with stage seven almost over.
BTC eyes the $85k region
The cryptocurrency market has been bearish over the past few days, with Bitcoin struggling around the $80k region. The world’s leading cryptocurrency by market cap, dropped to the $79k zone on Thursday, effectively grabbing liquidity and could surge to the $85k level in the coming hours or days.
At press time, the price of Bitcoin stands at $81,909 and could rally higher if the bulls take control of the market.
What is Bitcoin Pepe?
The bearish market condition hasn’t affected Bitcoin Pepe as its presale is now approaching a new milestone. This exciting project began its presale a month ago and has raised over $4.5 million from investors.
Bitcoin Pepe wants to revolutionise the Bitcoin ecosystem by leveraging the liquidity and security of the Bitcoin blockchain. It will use Bitcoin’s position in the market to introduce memecoins to its ecosystem.
The team is currently building a layer-2 network on the Bitcoin blockchain. This L2 will specialise in memecoin trading and other DeFi activities. It will enable Bitcoin Pepe to become home to memecoin activities within the Bitcoin ecosystem. This will help it unlock decentralized finance (DeFi) and meme trading on top of BTC.
Bitcoin Pepe is also the first meme initial coin offering (ICO) on the Bitcoin blockchain, making it the perfect fusion between BTC’s security and the unstoppable force of memecoins.
Bitcoin Pepe presale surpasses $4.5m
The Bitcoin Pepe presale is selling out fast, with investors putting in $4,686,963 into the project over the past four weeks. Currently in its seventh stage, the presale will enter the next stage after raising $5.67 million.
$BPEP, Bitcoin Pepe’s native token, is available to investors via the Bitcoin Pepe website. It can be purchased using various cryptocurrencies, including ETH, USDT, USDC, BNB, and SOL. In this sixth presale stage, $BPEP is worth $0.0281 and will increase to $0.0295 in the eighth stage.
How will Bitcoin Pepe impact the Bitcoin blockchain?
Bitcoin Pepe is launching an L2 that could revolutionise how users interact with the Bitcoin blockchain. This L2 will introduce DeFi and memecoin trading on Bitcoin, which could enhance the network’s utility, enabling it to compete with smart contract blockchains like Ethereum and Solana in terms of utility.
Furthermore, the network will enable developers to launch memecoins on the Bitcoin blockchain with ease. Memecoins will empower the Bitcoin blockchain to become home to a crazy high-octane meme experience.
The Bitcoin Pepe project is working to unlock Bitcoin’s $2 trillion dormant market cap, making it available for memecoin trading. The network will provide the necessary infrastructure for all memes to migrate to BTC, ensuring security and liquidity for investors and users.
Should you buy the $BPEP token today?
The $BPEP token will exclusively power activities within the Bitcoin Pepe ecosystem. With the right level of adoption, $BPEP could be a top performer within the broader cryptocurrency market.
The presale will enter the eighth stage in the coming hours or days, with the $BPEP token set to increase to $0.0295. Thanks to the promising utility of its L2 network, this presale could be the perfect opportunity for investors to get in early and buy the tokens at a discount.

Court Ruling Raises 3AC’s FTX Claim to $1.53 Billion

$3.29 Billion Bitcoin & Ethereum Options Expiry

XRP Price Builds Base—Short-Term Rally May Be Brewing
SEI Price Jumps 7.3% As World Liberty Financial Loads Up 541,242 Coins

BTC could surge to $85k as Bitcoin Pepe’s presale eyes $5M

XRP Likely To Be Classified as a Non-Security Like Ethereum

2.52 Million Altcoins Are Ruining Crypto’s Future

Animoca Brands Valuation Tanks 75% In Two Years, Here’s Why

Crypto exchange BingX hacked for $43 million

Are The Big Players Losing Interest?

Hong Kong’s Securities Association Tips Authorities On Crypto Self-Regulation

Coinbase cbBTC Set to go Live on Solana
2.52 Million Altcoins Are Ruining Crypto’s Future
Animoca Brands Valuation Tanks 75% In Two Years, Here’s Why
Crypto exchange BingX hacked for $43 million
Are The Big Players Losing Interest?
Hong Kong’s Securities Association Tips Authorities On Crypto Self-Regulation
Coinbase cbBTC Set to go Live on Solana
-
 Bitcoin22 hours ago
US Strategic Bitcoin Reserve Sparks Crypto Regulation Surge
-

 Market21 hours ago
PEPE Whales Propel 11% Rally, Fueling Market Optimism
-

 Market22 hours ago
WLFI Token Sale Reaches 99.3% Completion
-
 Altcoin24 hours ago
Chainlink Whale Sells 356K Coins Sparking Concerns; Can LINK Price Hit $45?
-

 Market19 hours ago
Solana Hit by Bearish Signal After 3 Years, Price at Risk
-

 Market23 hours ago
Ethereum Price Hits Resistance—Will The Recovery Stall Here?
-

 Market16 hours ago
Celestia TIA) Price Nears Consolidation After 31% Rally
-
 Altcoin23 hours ago
HYPE Price Crashes 9% As Hyperliquid Faces Outflows After ETH Whale Liquidation