
Market
Bitcoin ETF Holdings Dip Below Satoshi As Outflows Continue
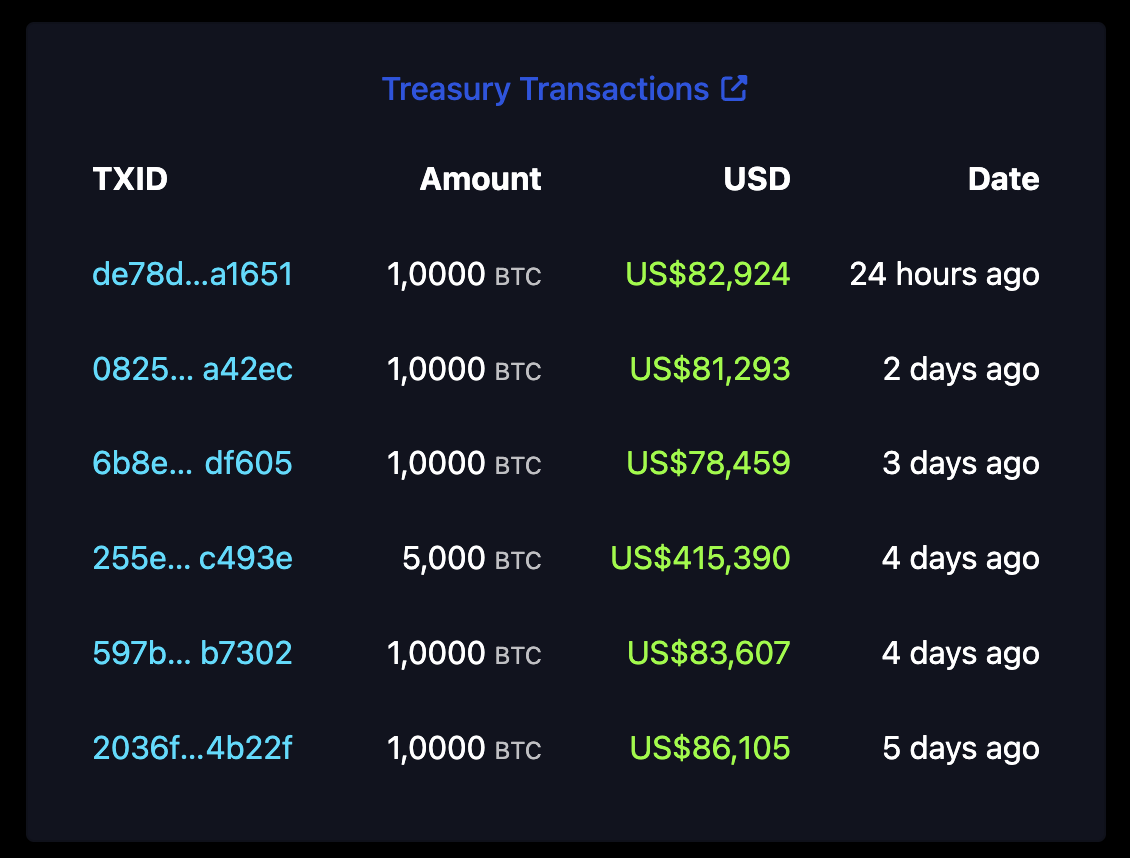
Bitcoin ETF outflows have nearly amounted to $750 million in the last two days as the crypto market consistently fell. BlackRock, the largest issuer, has offloaded around 2,000 BTC in the previous 24 hours.
Together, the ETF issuers sold off enough BTC that they collectively hold less than Satoshi. They surpassed him three months ago and continued buying huge amounts of Bitcoin, indicating truly massive sales.
Bitcoin ETF Outflows Continue
Since the Bitcoin ETFs first got SEC approval last year, they’ve had a transformative impact on the market. Lately, however, they’ve been turning bearish.
Towards the end of February, the market saw $2.7 billion in outflows, and this trend continued. The last four consecutive weeks had outflows, and the market already lost nearly $750 million this week alone.
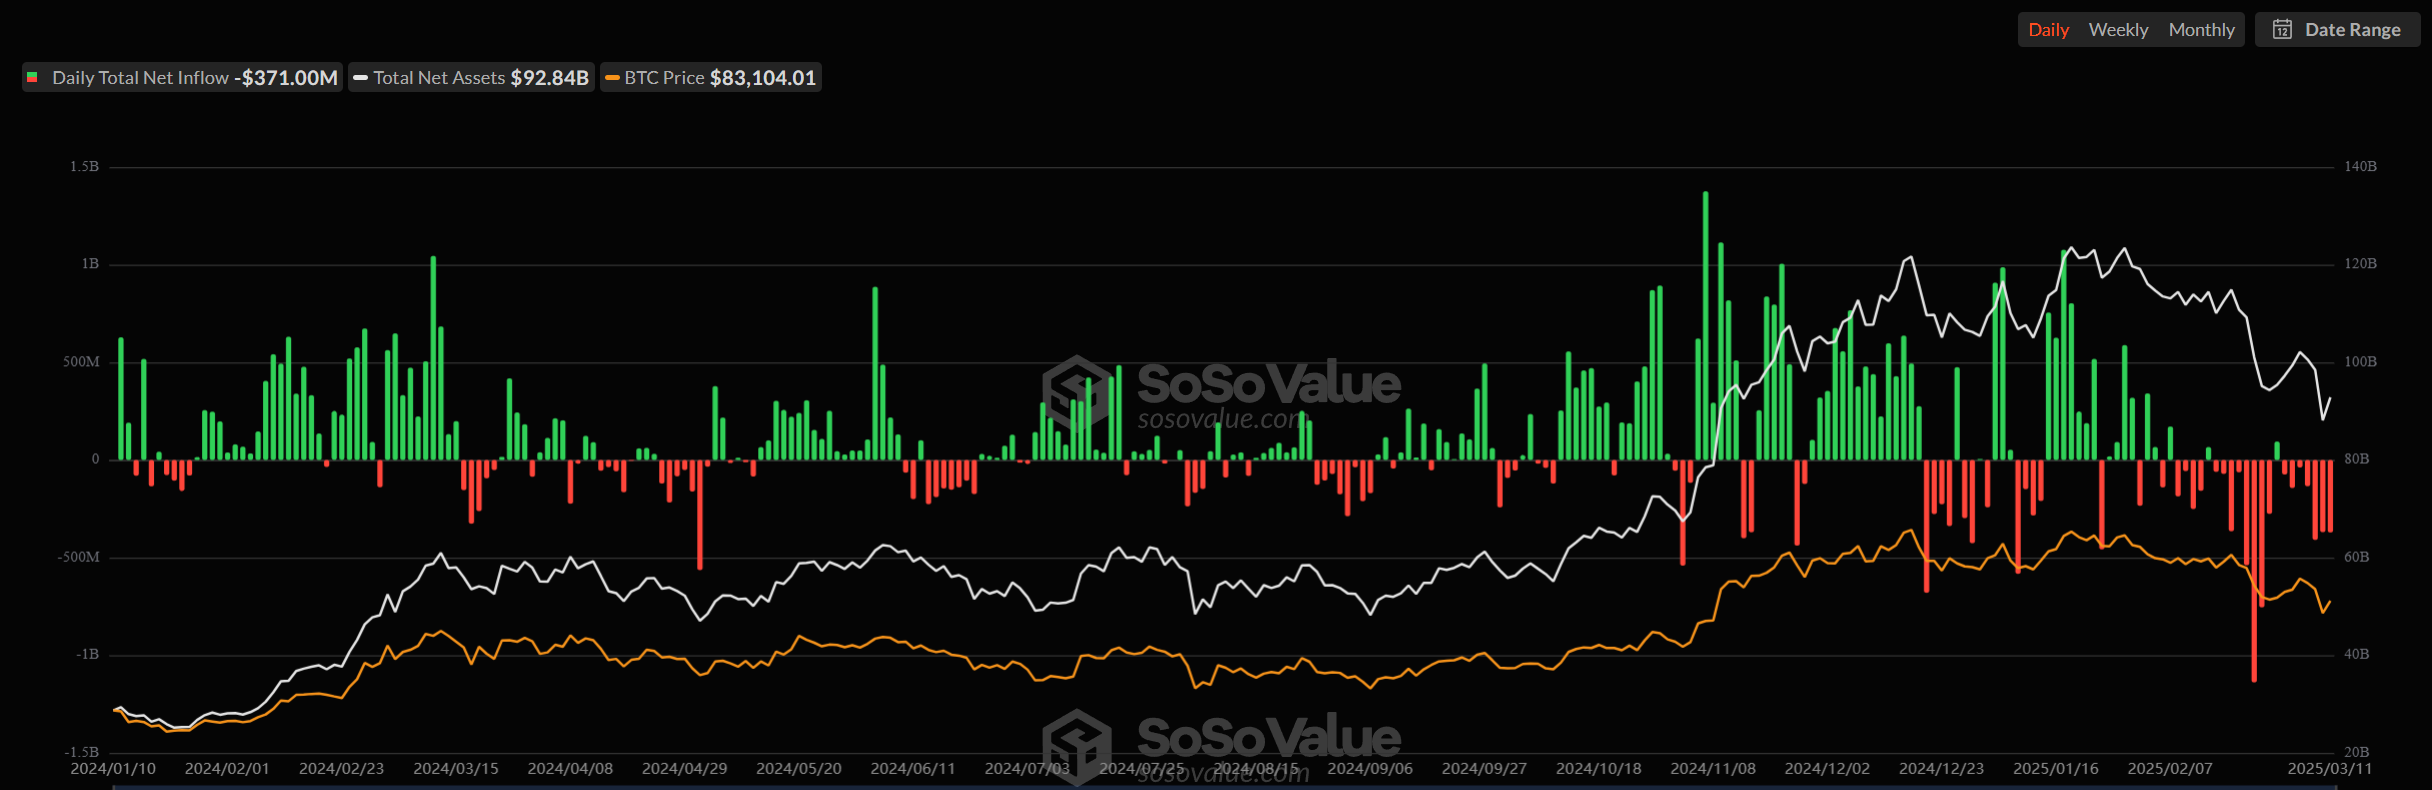
This marks the seventh consecutive day of outflows for this ETF market. IBIT, BlackRock’s product, led these losses with $151 million in the last 24 hours.
In mid-February, some analysts began speculating that BlackRock would begin selling its Bitcoin, and ETF analyst Shaun Edmondson noticed how large of a trend it’s becoming:
“I know the markets are very ‘risk off’ at the moment with the Tariff uncertainty, but this is yet another outflow day from the US Spot ETFs, collectively now falling below Satoshi again. Given the bullish narrative from the SEC, Strategy raising 21 billion, State [Bitcoin Reserve] race and National [Bitcoin Reserve] bill, I find this a little surprising,” Edmondson claimed.
BlackRock alone has offloaded around 2,000 BTC since Edmondson posted yesterday’s daily tallies. It’s unclear how far the ETF issuers want to take this trend, but these Bitcoin sales are very concerning.
These issuers surpassed Satoshi’s Bitcoin holdings in December, so these outflows have already eaten up three months’ worth of vociferous purchasing.
Still, despite this ETF pessimism, Bitcoin’s actual price could be doing a lot worse. The entire crypto market has been hit with massive outflows, and BTC fell accordingly.
However, the US CPI report this morning was better than anticipated, which allowed Bitcoin a little breathing room. It’s anyone’s guess, however, how long this reprieve will actually last.
Disclaimer
In adherence to the Trust Project guidelines, BeInCrypto is committed to unbiased, transparent reporting. This news article aims to provide accurate, timely information. However, readers are advised to verify facts independently and consult with a professional before making any decisions based on this content. Please note that our Terms and Conditions, Privacy Policy, and Disclaimers have been updated.


Stellar (XLM) has surged more than 10% in the last 24 hours, attempting to recover from a 15% correction over the past month. Despite this rebound, XLM’s trend remains at an important point, with its market cap now standing at $8.6 billion.
Technical indicators show that buying pressure has increased significantly, with DMI and CMF both pointing to growing accumulation. However, XLM still faces key resistance levels, and whether it can sustain this momentum will determine if the price can break above $0.35 or if further consolidation is ahead.
XLM Chart Shows Buyers Are Now In Control
Stellar’s DMI chart shows that its Average Directional Index (ADX) has dropped to 28.7, down from 35.6 two days ago. ADX is a key indicator that measures the strength of a trend, regardless of direction, with values above 25 typically signaling a strong trend and values below 20 suggesting a weak or consolidating market.
A declining ADX, even while the price moves in a certain direction, indicates that the strength of the trend is fading.
In this case, the drop from 35.6 to 28.7 suggests that Stellar’s bearish trend is weakening, creating an opportunity for a possible shift in momentum.

Looking at the Directional Indicators, +DI has surged to 31.2 from 8, while -DI has dropped to 16.4 from 30.7. This major shift in buying and selling pressure suggests that bulls have regained control after a period of strong selling.
Since Stellar is attempting to transition from a downtrend into an uptrend, this increase in +DI is a positive signal. However, for the new trend to gain strength, ADX would need to stabilize and turn upward, confirming growing momentum.
If ADX continues declining, XLM could consolidate before making a decisive move, but if it rises alongside +DI, it will reinforce a stronger breakout to the upside.
XLM CMF Has Surged Since March 10
Stellar’s Chaikin Money Flow (CMF) indicator has risen to 0.13, recovering from -0.14 just three days ago, after briefly peaking at 0.18 a few hours ago. CMF measures buying and selling pressure by analyzing both price movement and volume on a scale from -1 to 1.
A positive CMF value suggests that buying pressure is dominant, while a negative reading indicates stronger selling activity.
Generally, values above 0.05 signal accumulation, whereas values below -0.05 indicate distribution, making CMF a useful tool for assessing whether capital is flowing into or out of an asset.

With Stellar’s CMF now at 0.13, buying pressure has clearly strengthened, reversing the prior bearish trend seen when CMF was negative.
This shift suggests that investors have been accumulating XLM over the past few days, supporting its recent price recovery. However, since CMF peaked at 0.18 before slightly declining, some short-term profit-taking may have occurred.
If CMF remains in positive territory and trends higher again, it will reinforce further upside potential, but if it starts dropping back toward negative values, it could signal weakening demand and a possible price pullback.
Will Stellar Surpass $0.35 In March?
Stellar’s EMA lines still indicate a bearish trend, with short-term EMAs positioned below the long-term ones. However, the recent upward movement in short-term EMAs suggests that momentum could be shifting, increasing the chances of a trend reversal.
If buying pressure continues, Stellar’s price could rise to test the resistance at $0.309, a key level that would determine whether the recovery can sustain itself.
A breakout above this resistance could fuel further upside, potentially pushing XLM toward $0.349. A stronger uptrend could lead to a rally toward $0.375.

On the downside, if the short-term recovery loses strength and buyers fail to establish an uptrend, Stellar could face renewed selling pressure.
In this scenario, the first key support level to watch would be $0.273, which has acted as a critical zone in previous price action. A breakdown below this level could expose XLM to further losses, with support at $0.252 as the next major level.
If bearish momentum intensifies, the price could decline further, potentially reaching $0.226, marking a deeper correction before any potential reversal.
Disclaimer
In line with the Trust Project guidelines, this price analysis article is for informational purposes only and should not be considered financial or investment advice. BeInCrypto is committed to accurate, unbiased reporting, but market conditions are subject to change without notice. Always conduct your own research and consult with a professional before making any financial decisions. Please note that our Terms and Conditions, Privacy Policy, and Disclaimers have been updated.

Meme coins have struggled to regain momentum despite the recent listing of PENGU and PNUT on Robinhood. While these tokens were expected to surge, their price action has remained subdued, reflecting broader skepticism in the market, especially around meme coins.
However, their RSI levels indicate room for further growth if buying pressure increases and meme coin sentiment improves. If momentum recovers, both PENGU and PNUT could test key resistance levels, potentially reversing their recent downtrends.
PENGU Has Been Trading In All-Time Lows
PENGU, an NFT token on Solana, has lost nearly 80% of its value in the past two months, with its market cap now at $400 million.
Today’s Robinhood listing saw the token surge by 6%, but technical indicators show it still lacks momentum for a strong recovery.
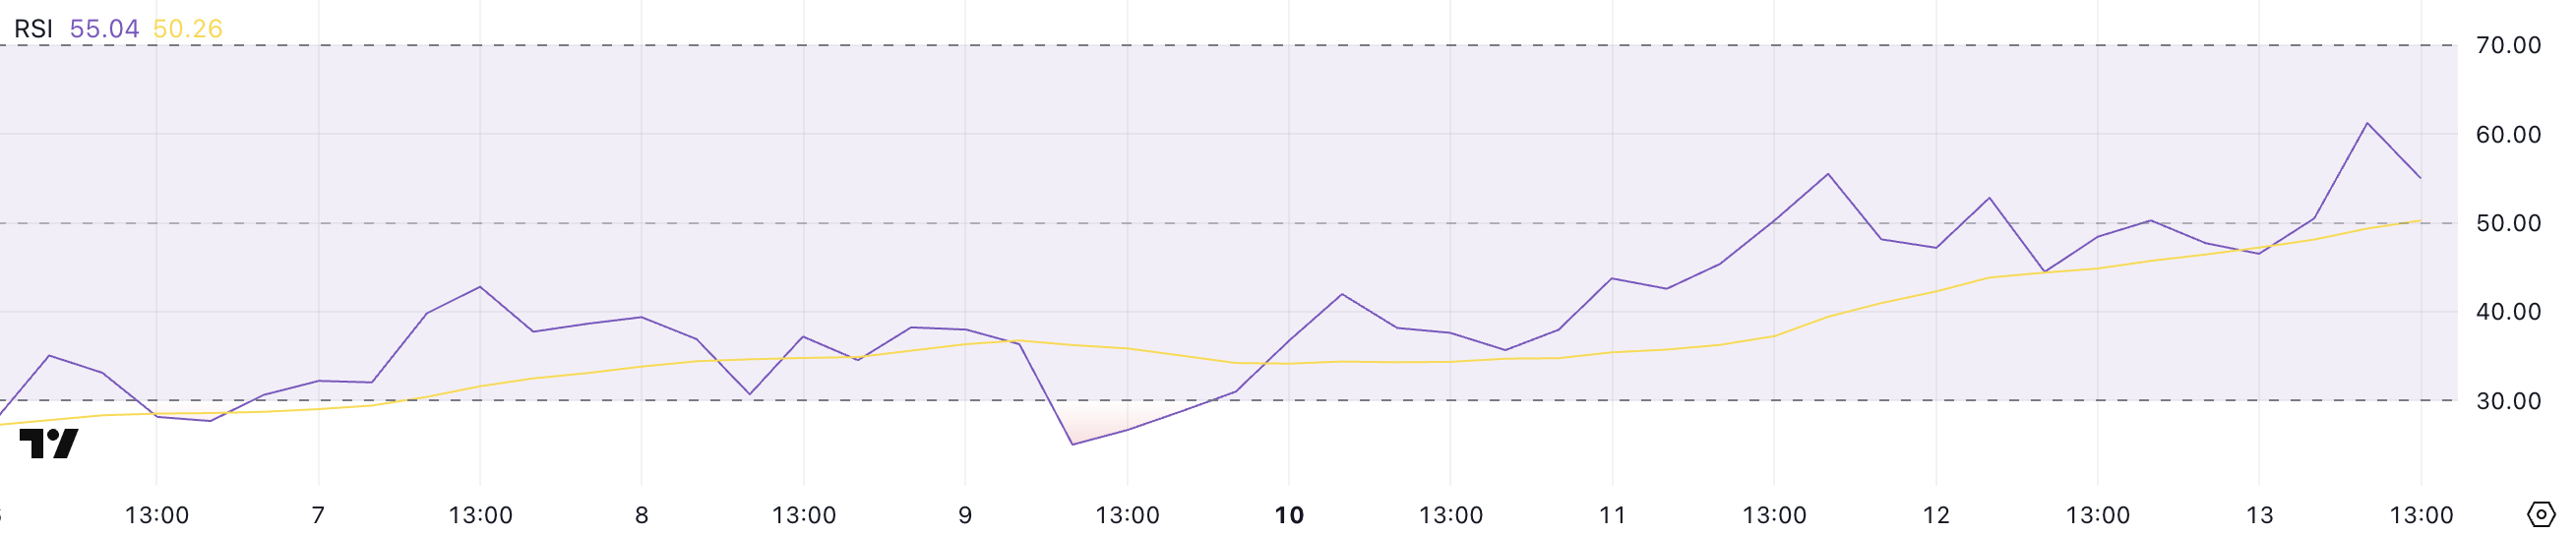
Its RSI has climbed to 55 from 25 in just four days, indicating increased buying interest.
However, even with the listing, PENGU has yet to see a major rally, as meme coins and NFT tokens face skepticism in the current market.
PENGU’s EMA lines still indicate a bearish trend, but the upward movement in short-term EMAs suggests a possible shift.

If momentum builds, the token could test resistance at $0.0069, with a breakout opening the door for a move toward $0.0075 and $0.0093, breaking above $0.0090 for the first time since March 2.
However, if the downtrend resumes and PENGU loses support at $0.0059, selling pressure could push it as low as $0.0050, marking new lows.
PNUT Is Currently Attempting A Recovery In The Last Few Days
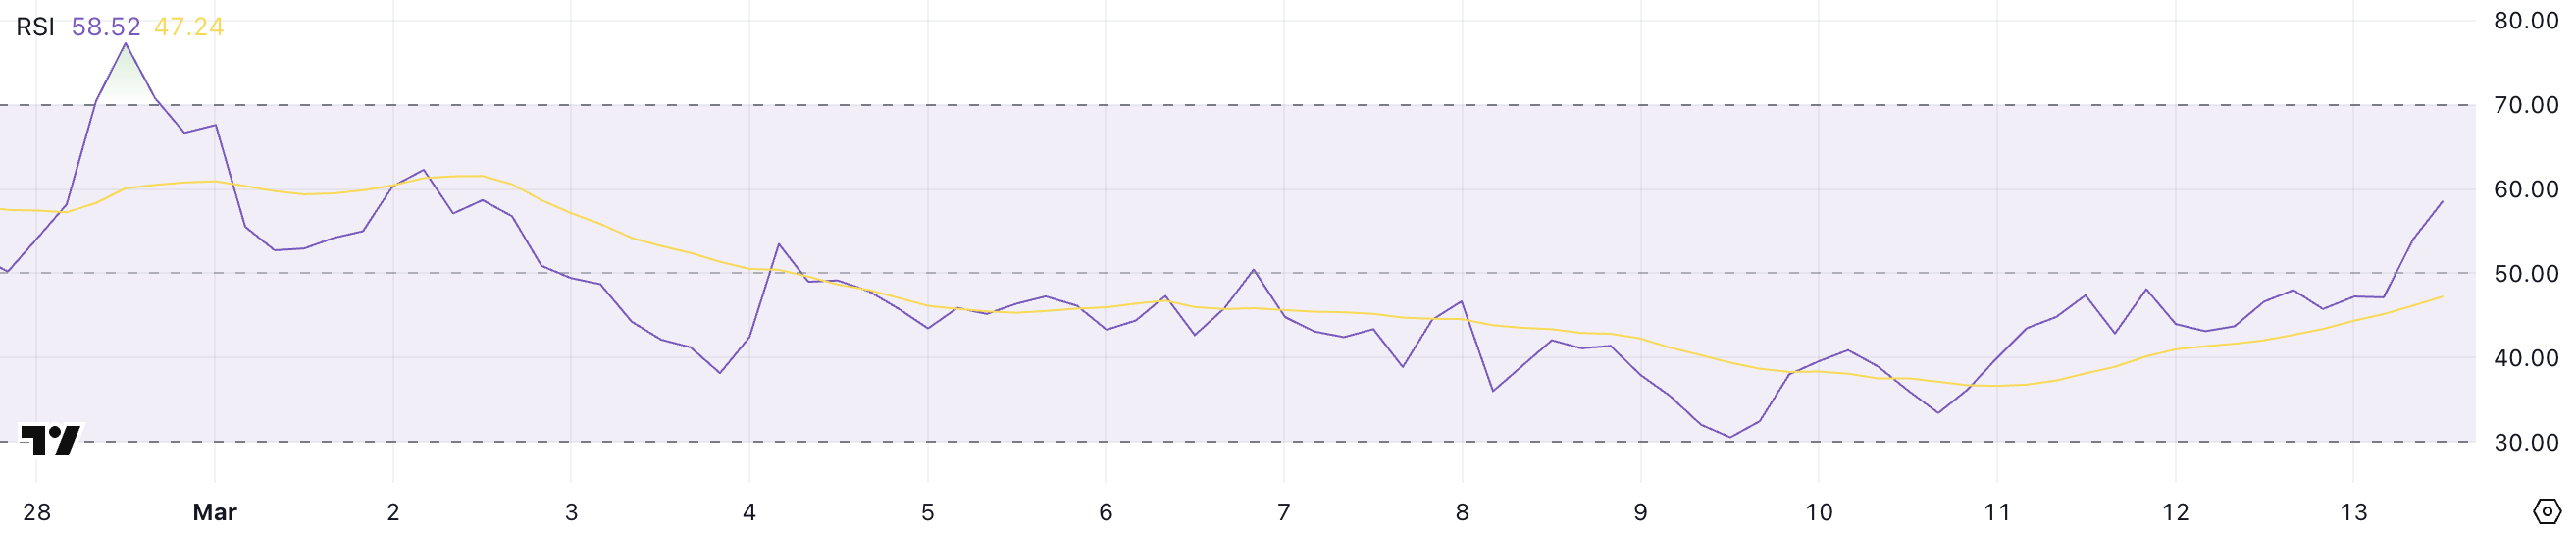
PNUT has been one of the struggling meme coins in recent months, with its price dropping 35% in the last 15 days. However, its RSI has been steadily rising, jumping from 33.4 on March 10 to 58.5 now.
This shift suggests that buying pressure has increased, potentially signaling a short-term recovery. If RSI continues to rise and crosses 60, it could strengthen bullish sentiment, pushing PNUT toward key resistance levels.
Despite this momentum, PNUT’s EMA lines still suggest a bearish trend, as short-term EMAs remain below long-term ones. However, the short-term lines are moving upward, hinting at a possible trend reversal.
If these EMAs form a golden cross, PNUT could gain enough strength to test resistance at $0.211. A breakout above this level could lead to further gains, with the next targets at $0.25 and potentially $0.309.

On the downside, if the current uptrend fails to hold, PNUT could face renewed selling pressure. The key support level to watch is $0.144, which has previously held price declines.
If this level is lost, PNUT could drop further to $0.133, marking new lows and reinforcing the bearish structure.
Disclaimer
In line with the Trust Project guidelines, this price analysis article is for informational purposes only and should not be considered financial or investment advice. BeInCrypto is committed to accurate, unbiased reporting, but market conditions are subject to change without notice. Always conduct your own research and consult with a professional before making any financial decisions. Please note that our Terms and Conditions, Privacy Policy, and Disclaimers have been updated.

ARENA, the largest opposition party in El Salvador, criticized Bukele over the IMF deal. In exchange for $1.4 billion in loans, Bukele agreed to stop using public funds to buy Bitcoin, but he insists that he won’t stop.
ARENA warned that this behavior could scuttle the deal and destroy the country’s economic stability. However, due to recent election losses, the party is more or less powerless to change Bukele’s policy directly.
El Salvador Headed for IMF Showdown
Since El Salvador adopted Bitcoin as legal tender, it’s become one of the world’s largest Bitcoin holders. This has given the country many new economic opportunities, creating new crypto-centric industries as its profits swelled. However, not everyone is happy with this, and the ARENA opposition party is concerned about El Salvador’s IMF loans.
“El Salvador’s economy is in a very delicate state, and this warrants a very responsible and orderly fiscal policy. President Bukele has been emphatic in stating that the purchase of Bitcoin will not stop, despite the agreement stipulating a ban on government purchases of cryptocurrency,” its statement read.
Specifically, the IMF spent years opposing El Salvador’s turn towards Bitcoin. President Bukele cast the nation’s growing BTC stockpile as an economic independence issue; before his Presidency, the US dollar was the nation’s sole currency. However, last October, the IMF began softening its maximalist position.
Specifically, the IMF claimed that El Salvador could get massive new loans if it cut back its support for Bitcoin. The state wouldn’t have to sell its stockpile, but it couldn’t buy more with government money, and BTC would no longer be legal tender. El Salvador was receptive to the deal last December and finally amended its Bitcoin Law in January.
There’s just one problem. Despite receiving a $1.4 billion loan from the IMF, El Salvador hasn’t stopped its Bitcoin purchases at all. Crypto enthusiasts couldn’t identify a loophole in the agreement, but Bukele publicly claimed he would not stop. In other words, it seems like he’s openly defying the IMF. El Salvador has bought Bitcoin every single day since.
Clearly, ARENA doesn’t think this is a good idea. Its statement urged Bukele to honor the IMF agreement, saying that this action is necessary to maintain El Salvador’s economic stability. If there’s a secret clause that lets Bukele buy more Bitcoin for a limited window, his country’s largest opposition party doesn’t seem to know anything about it.
However, even if ARENA detests this plan, it’s not in a good position to do anything about it. It won a little over 5.5% of the vote in last year’s election and currently holds two seats out of 60 in the Legislative Assembly.
Bukele’s party, on the other hand, controls 54, and that’s not counting its coalition partners. In other words, it’s powerless to change the actual policy.
Still, this is very worrying. If El Salvador keeps openly buying Bitcoin, the IMF may retaliate. An open conflict between these two parties would have truly unpredictable consequences. For now, it’s impossible to say what the future may hold.
Disclaimer
In adherence to the Trust Project guidelines, BeInCrypto is committed to unbiased, transparent reporting. This news article aims to provide accurate, timely information. However, readers are advised to verify facts independently and consult with a professional before making any decisions based on this content. Please note that our Terms and Conditions, Privacy Policy, and Disclaimers have been updated.
Stellar (XLM) Jumps 10% as Bulls Take Charge: What’s Next?

Dogecoin Price Closes Daily Candle With Lower Wick, Why Another Crash Could Be Coming

PENGU and PNUT Still Bearish After Robinhood Listing

Can ADA Drop to $0.30?

El Salvador’s IMF Deal Could be Affected By Bitcoin Purchases

Ripple Secures DFSA License in the UAE

2.52 Million Altcoins Are Ruining Crypto’s Future

Animoca Brands Valuation Tanks 75% In Two Years, Here’s Why

Crypto exchange BingX hacked for $43 million

Are The Big Players Losing Interest?

Hong Kong’s Securities Association Tips Authorities On Crypto Self-Regulation

Coinbase cbBTC Set to go Live on Solana
2.52 Million Altcoins Are Ruining Crypto’s Future
Animoca Brands Valuation Tanks 75% In Two Years, Here’s Why
Crypto exchange BingX hacked for $43 million
Are The Big Players Losing Interest?
Hong Kong’s Securities Association Tips Authorities On Crypto Self-Regulation
Coinbase cbBTC Set to go Live on Solana
-
 Altcoin23 hours ago
Solana Price At Risk As Alameda Unstakes $23 Million SOL
-

 Market13 hours ago
PEPE Whales Propel 11% Rally, Fueling Market Optimism
-

 Market18 hours ago
Solana (SOL) Faces Many Challenges—Can Bulls Hold the Line?
-
 Bitcoin14 hours ago
US Strategic Bitcoin Reserve Sparks Crypto Regulation Surge
-

 Market11 hours ago
Solana Hit by Bearish Signal After 3 Years, Price at Risk
-
 Market24 hours ago
Has Bitcoin (BTC) Price Topped For This Cycle?
-

 Market16 hours ago
XRP Bulls Ready to Charge—Upside Break May Spark Rally
-
 Altcoin17 hours ago
Dogecoin Price Eyes $3 Target As DOGE Bounces From Crucial Support