
Market
XRP Bears Continue to Drive Price Down, Risks Further Losses
XRP continues its decline, falling 10% over the past week as bearish momentum strengthens.
The fourth-largest cryptocurrency by market capitalization remains under pressure, with waning buying interest hinting at the possibility of further losses.
XRP’s Outlook Worsens as Buying Pressure Fades
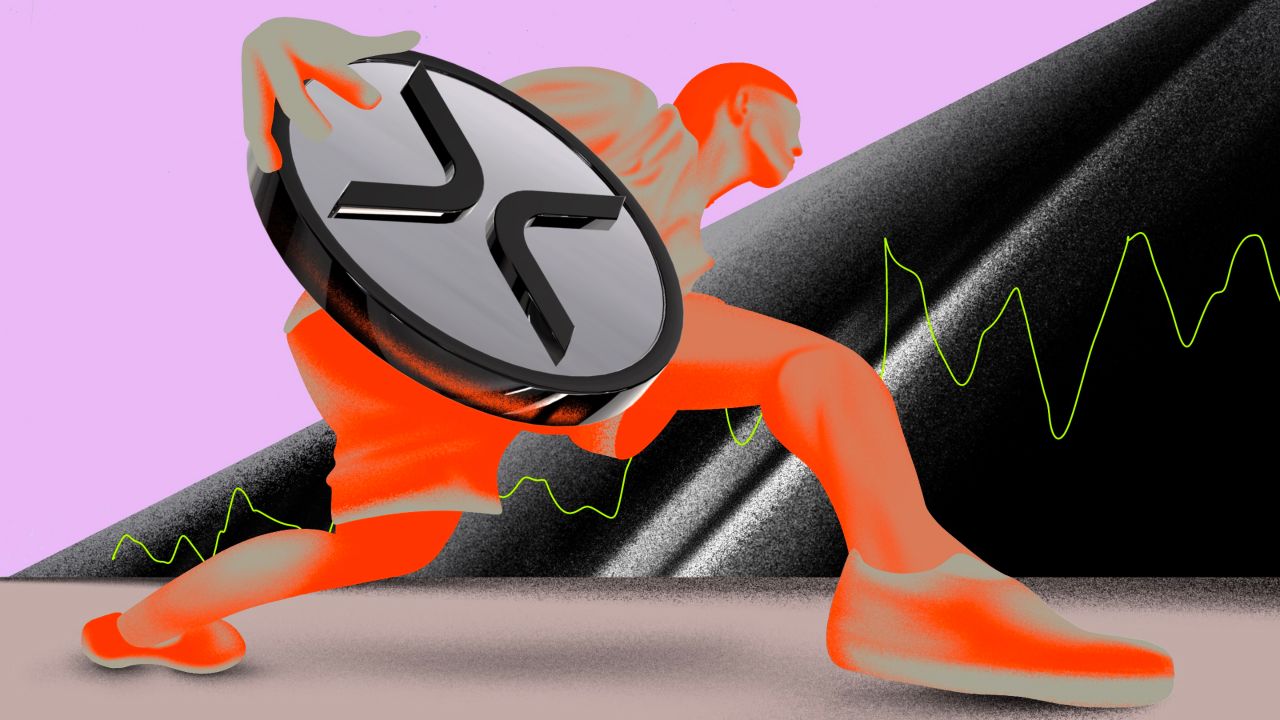
Since reaching an all-time high of $3.40 on January 16, XRP has remained mostly within a descending parallel channel. This is a bearish pattern formed when an asset’s price moves between two downward-sloping parallel trendlines, indicating a downtrend.
When an asset’s price trades within this channel, it marks a period of decline during which sellers dominate, and buying activity is low. This has put significant downward pressure on XRP’s price in the past month.
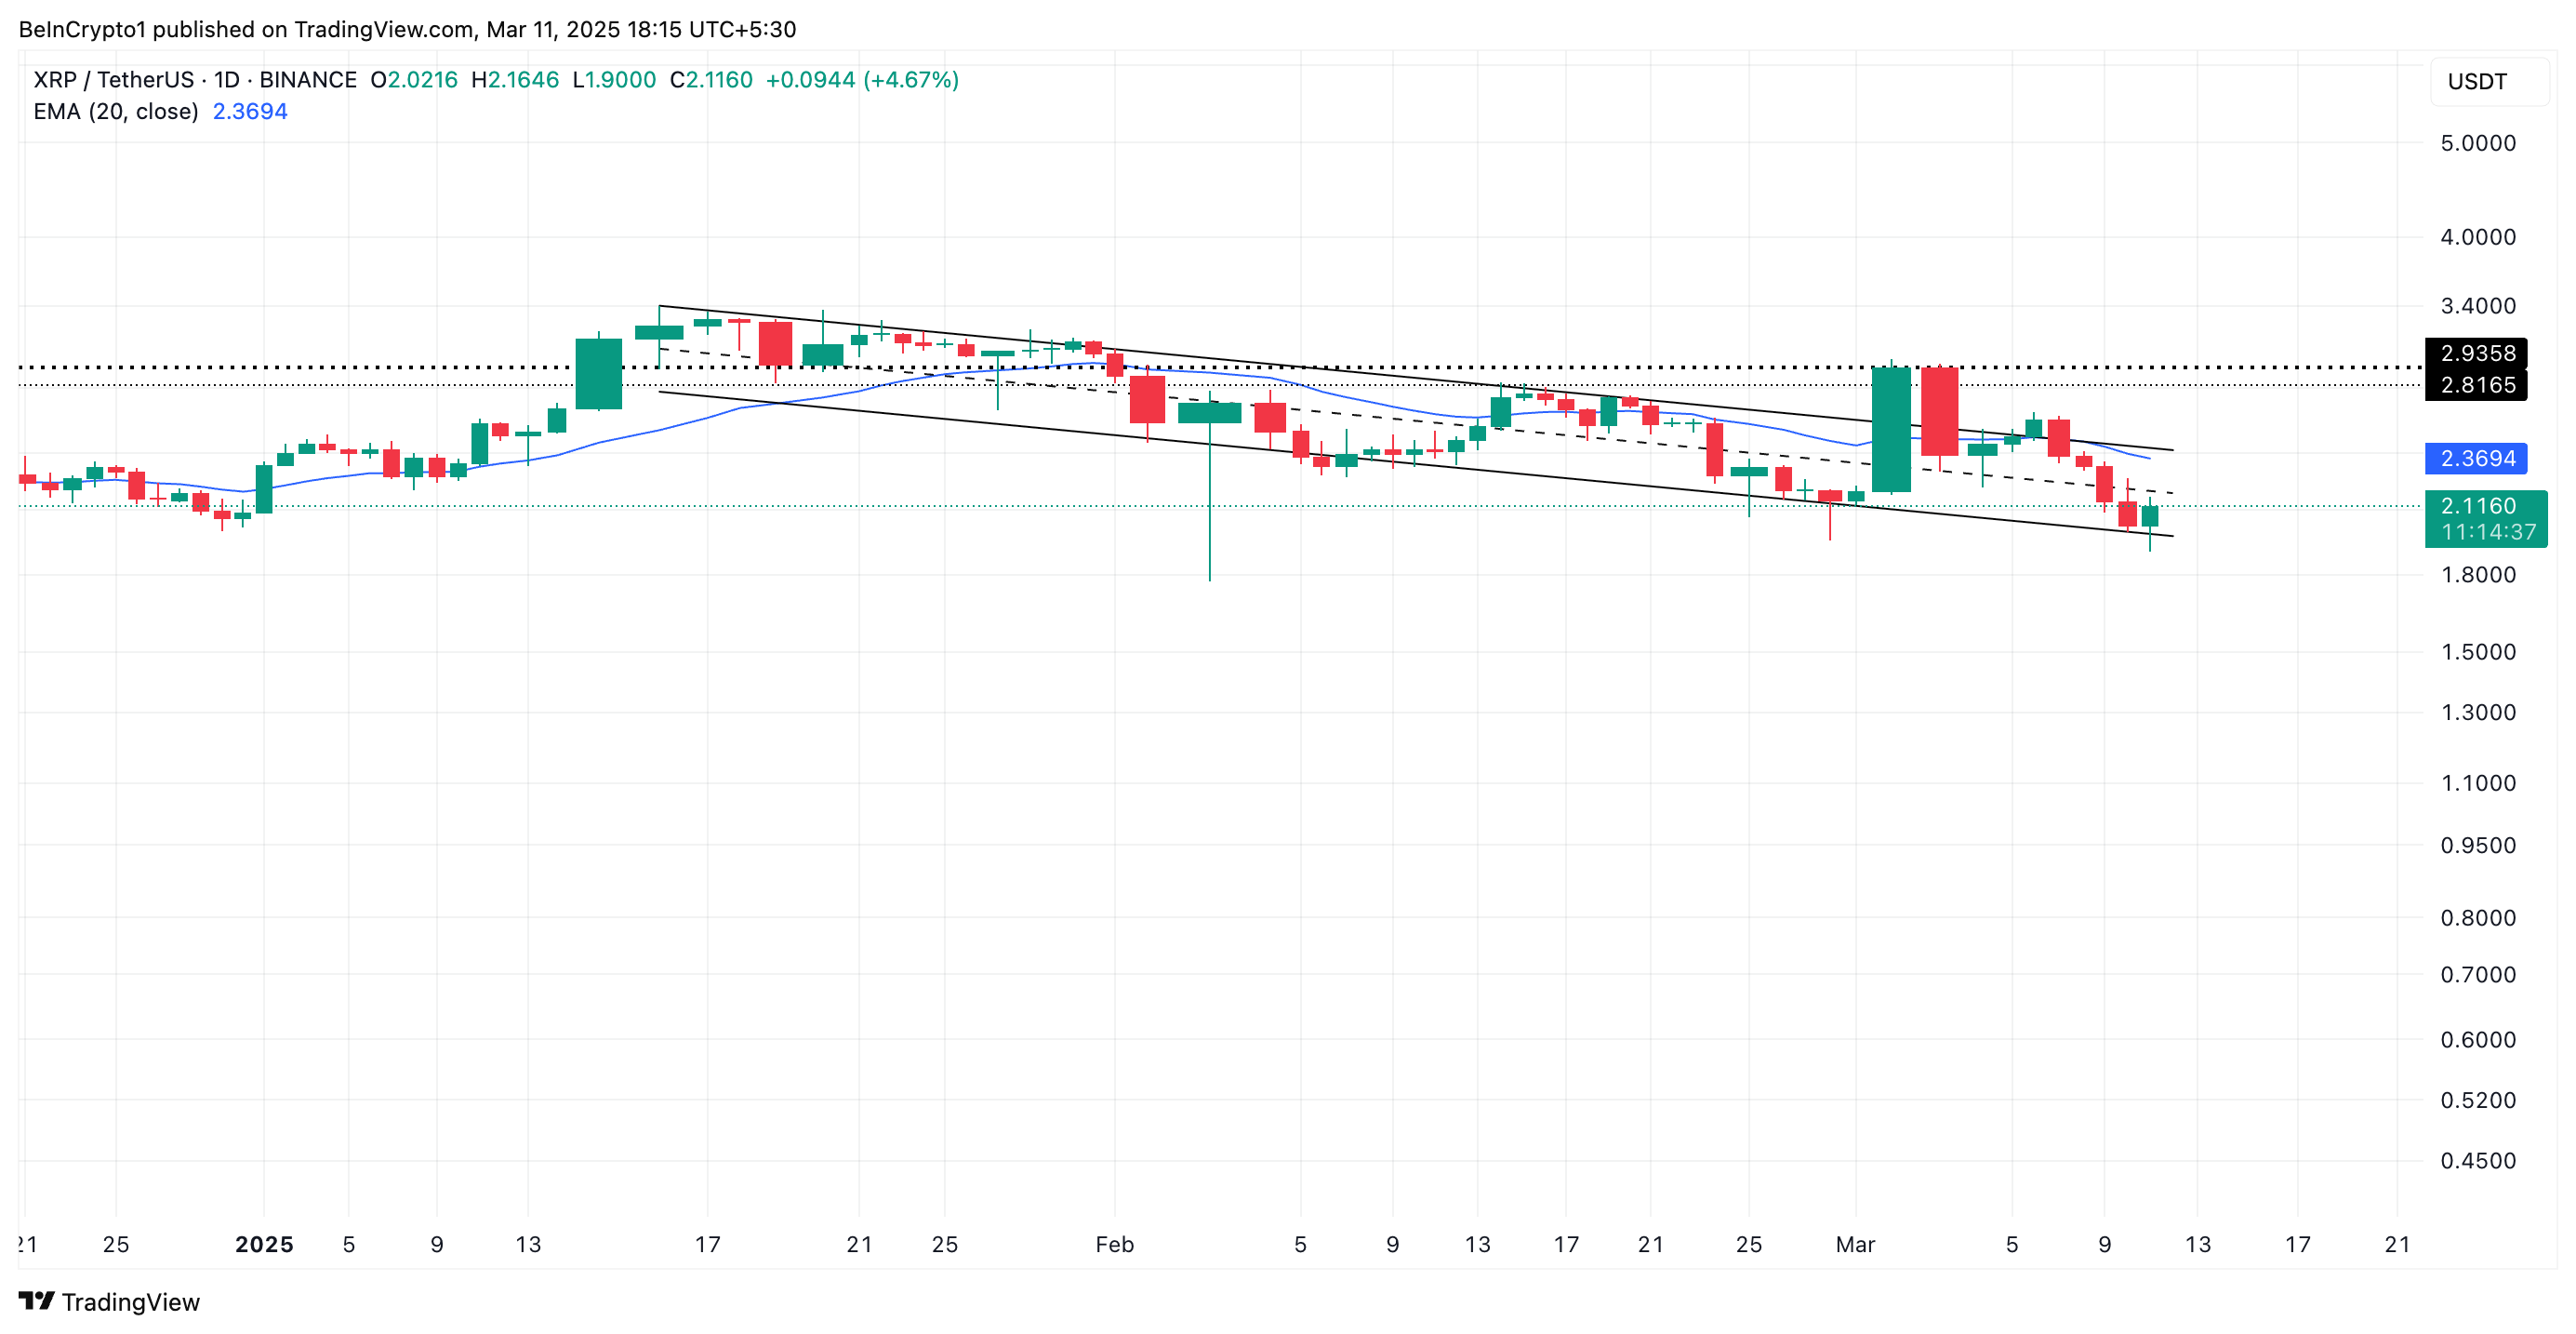
XRP currently trades at $2.11, exchanging hands below its 20-day exponential moving average (EMA). This key moving average measures the asset’s average price over the past 20 trading days, giving more weight to recent prices to reflect short-term trends.
When an asset’s price falls below its 20-day EMA, it suggests that selling pressure is strong and the asset is in a bearish phase. This signals continued downside momentum for XRP unless buying interest increases to push the token’s price back above the EMA.
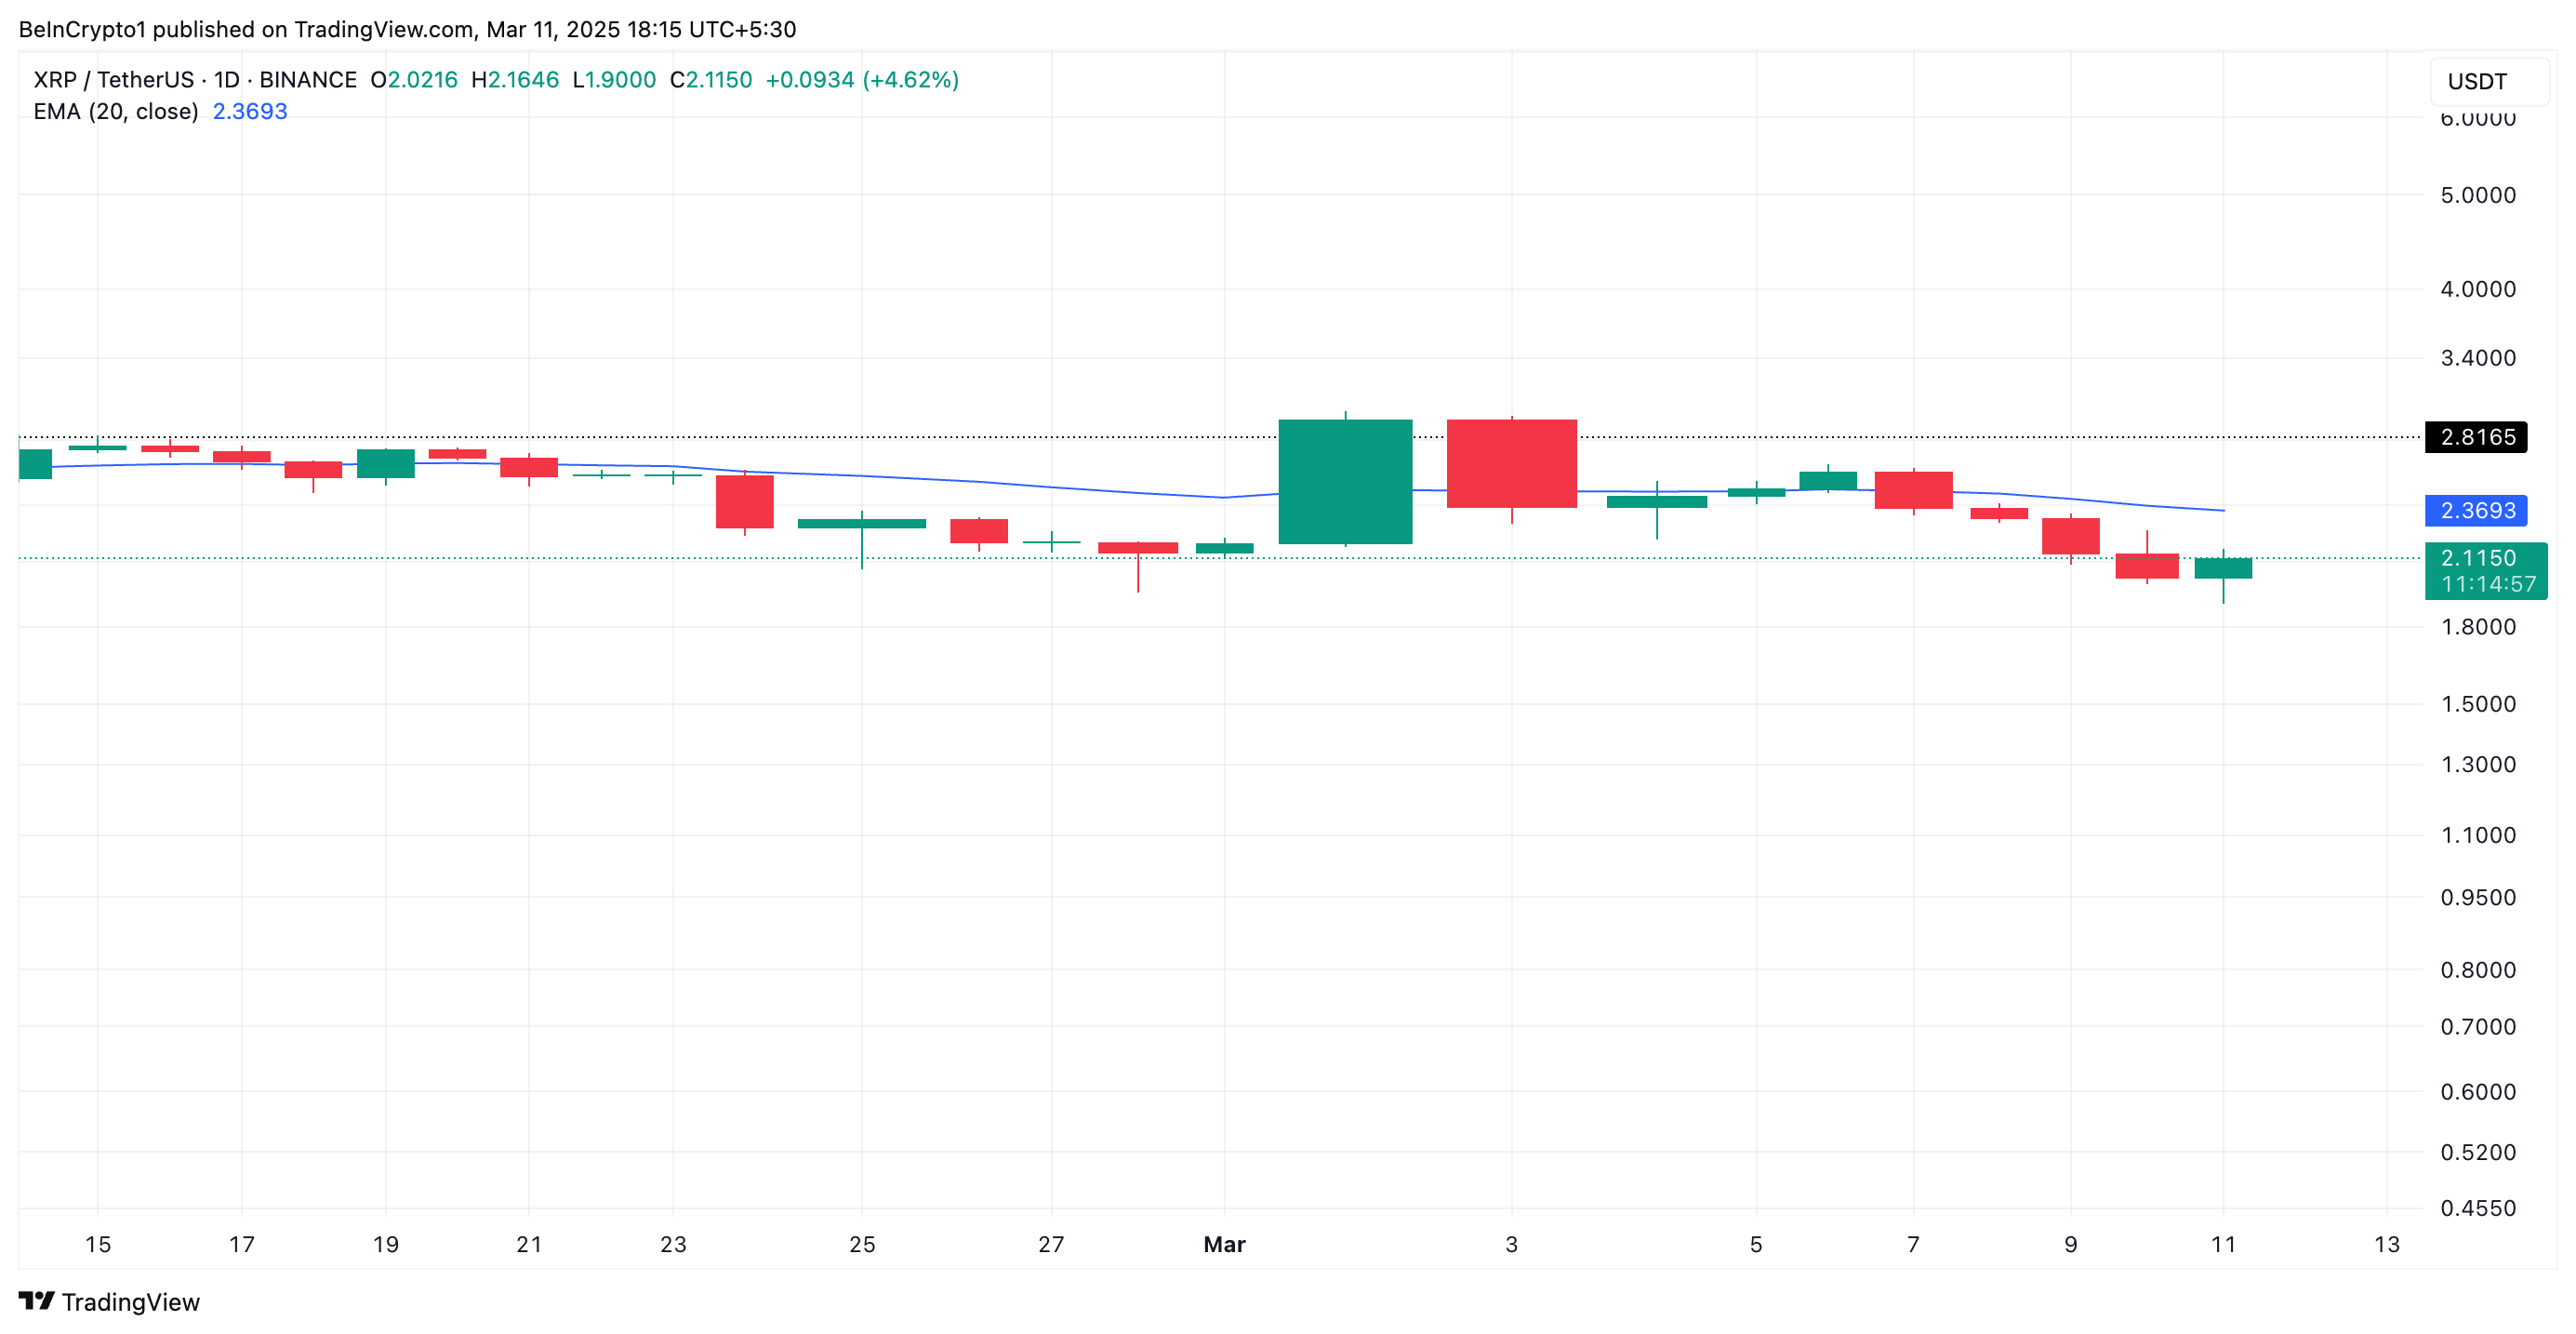
Further, XRP’s Chaikin Money Flow (CMF) is currently in a downtrend and is poised to breach its zero line. This indicator, which measures money flow into and out of an asset, is at 0.02 as of this writing.
When an asset’s CMF attempts to fall below zero, it reflects the weakening buying pressure and increasing selling dominance. This suggests that money is flowing out of XRP rather than into it, reinforcing the bearish outlook.
XRP Faces Bearish Pressure: Could It Crash to $1.47?
XRP risks dropping below $2 if new demand remains insignificant. In that scenario, it could plummet to $1.47, a low it last reached in November.
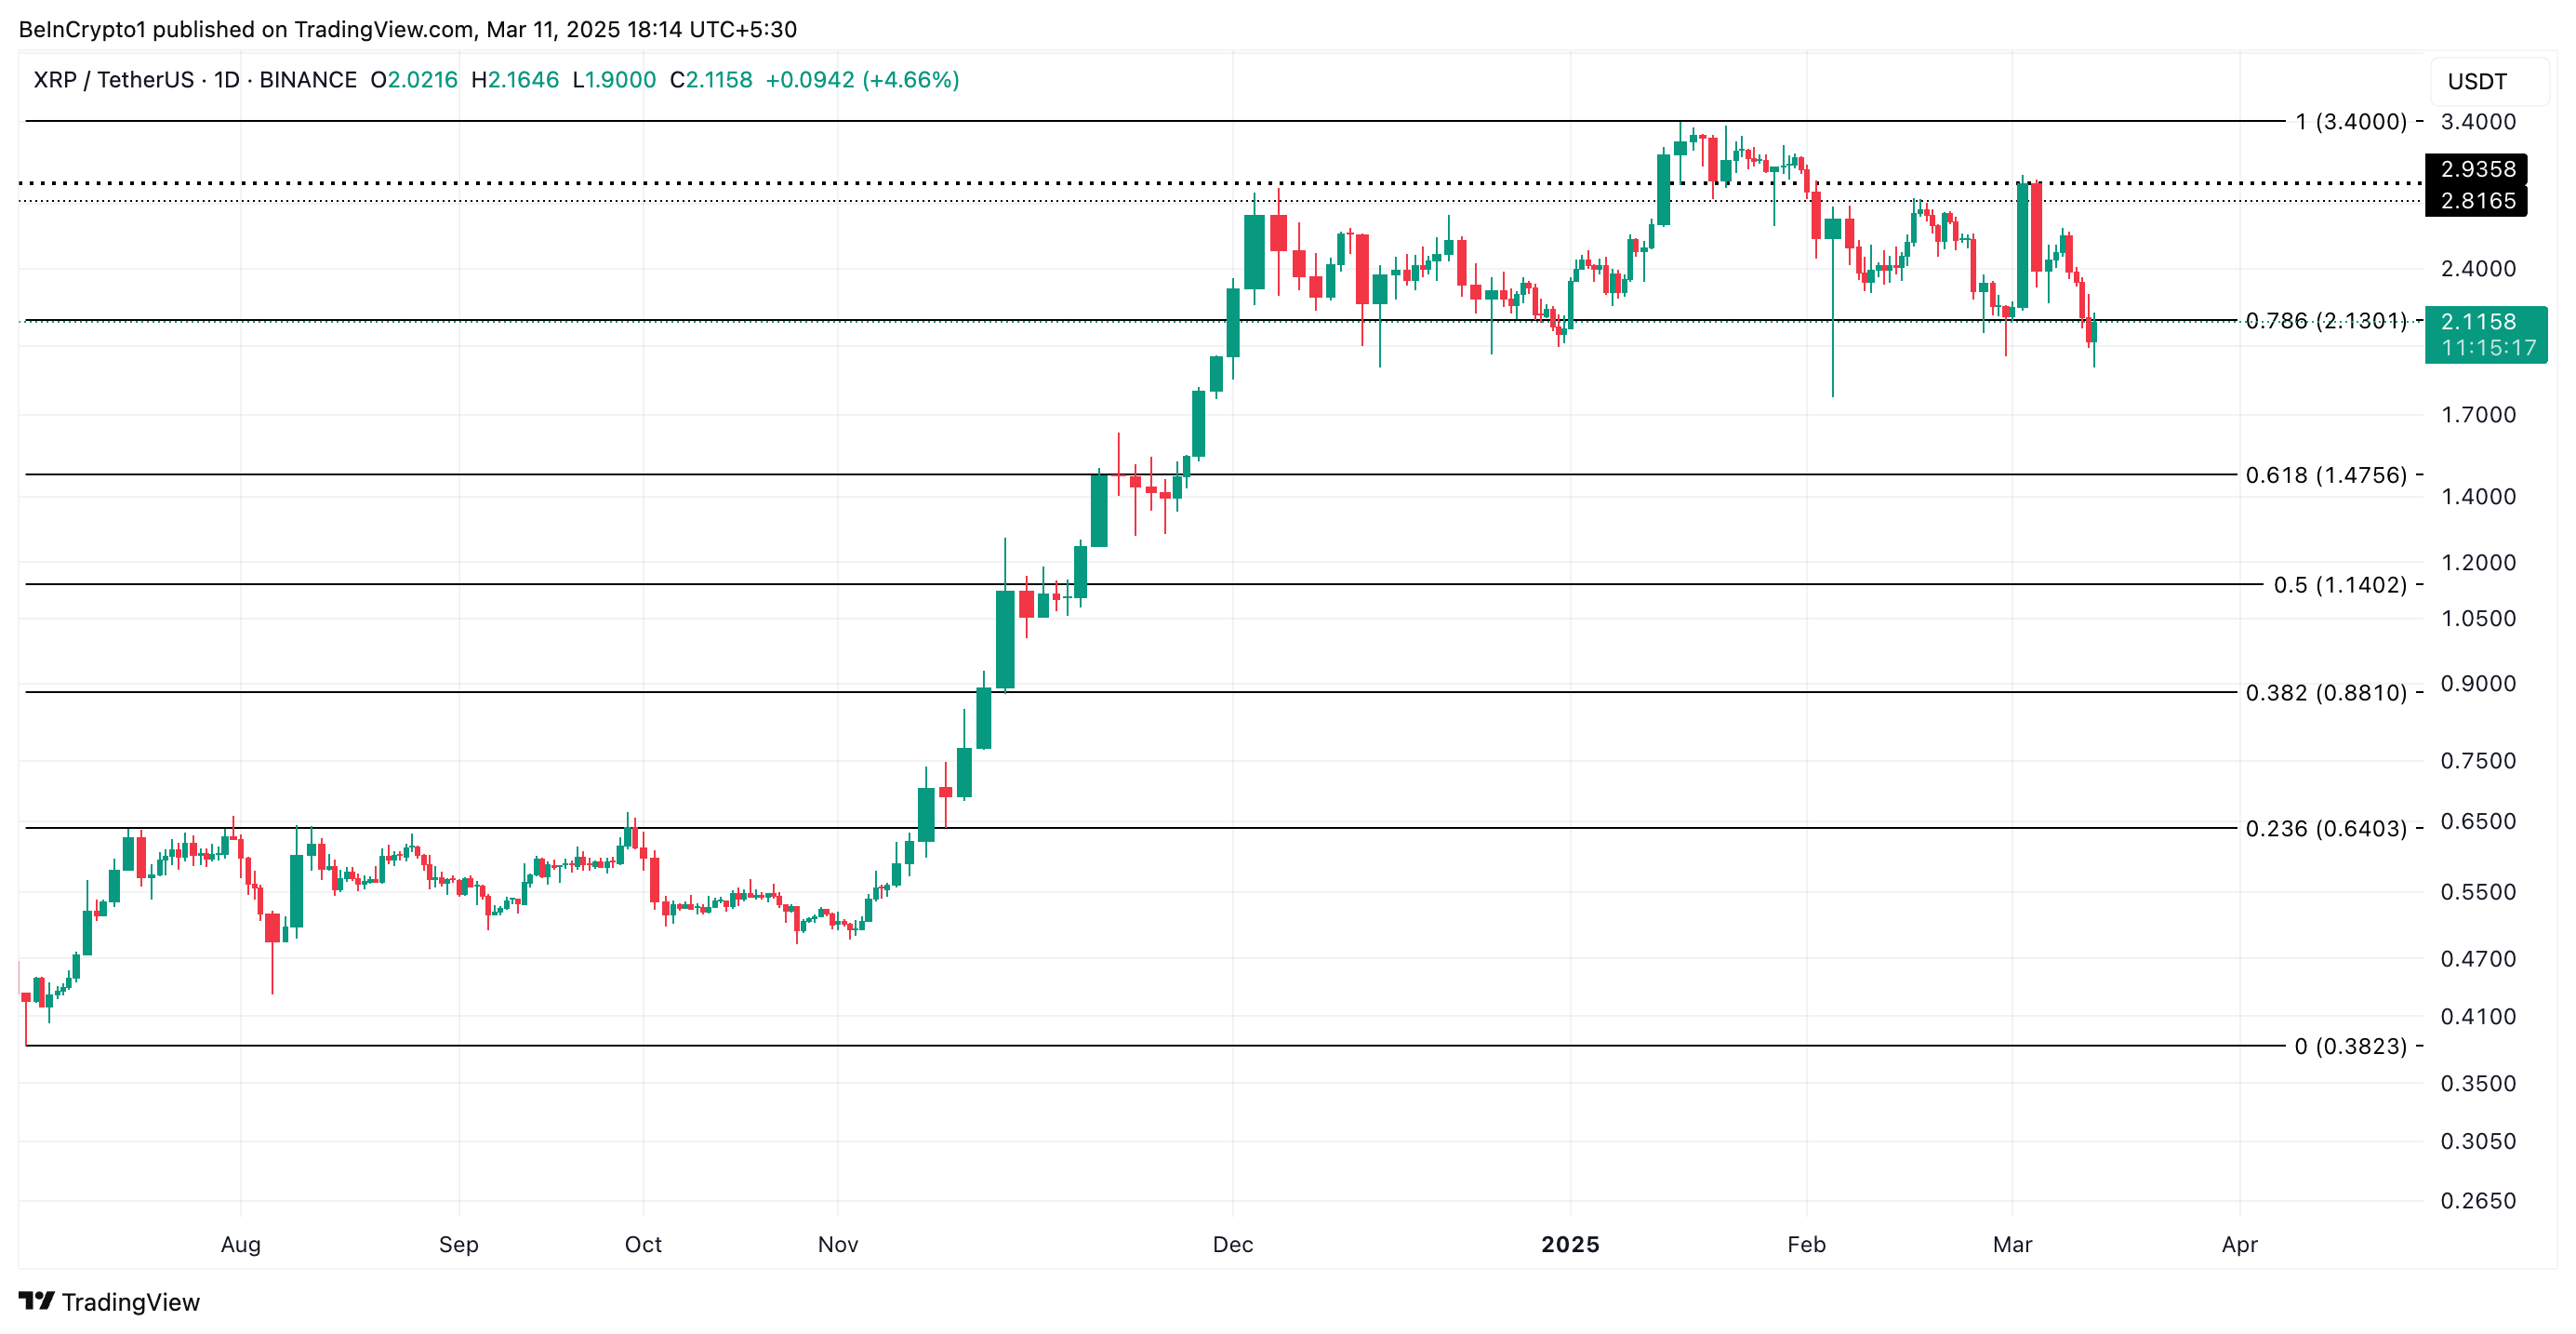
On the other hand, if selling pressure wanes and XRP sees an uptick in buying activity, it could push its price past the resistance at $2.81 toward the $3.40 all-time high.
Disclaimer
In line with the Trust Project guidelines, this price analysis article is for informational purposes only and should not be considered financial or investment advice. BeInCrypto is committed to accurate, unbiased reporting, but market conditions are subject to change without notice. Always conduct your own research and consult with a professional before making any financial decisions. Please note that our Terms and Conditions, Privacy Policy, and Disclaimers have been updated.


Bittensor (TAO) price has been facing a tough battle recently. It failed to break out of a descending wedge pattern, resulting in significant losses.
Despite these setbacks, the hope for a recovery remains strong, as several key indicators suggest that a rebound may be on the horizon for the altcoin.
Bittensor Could Be Imitating Its Past
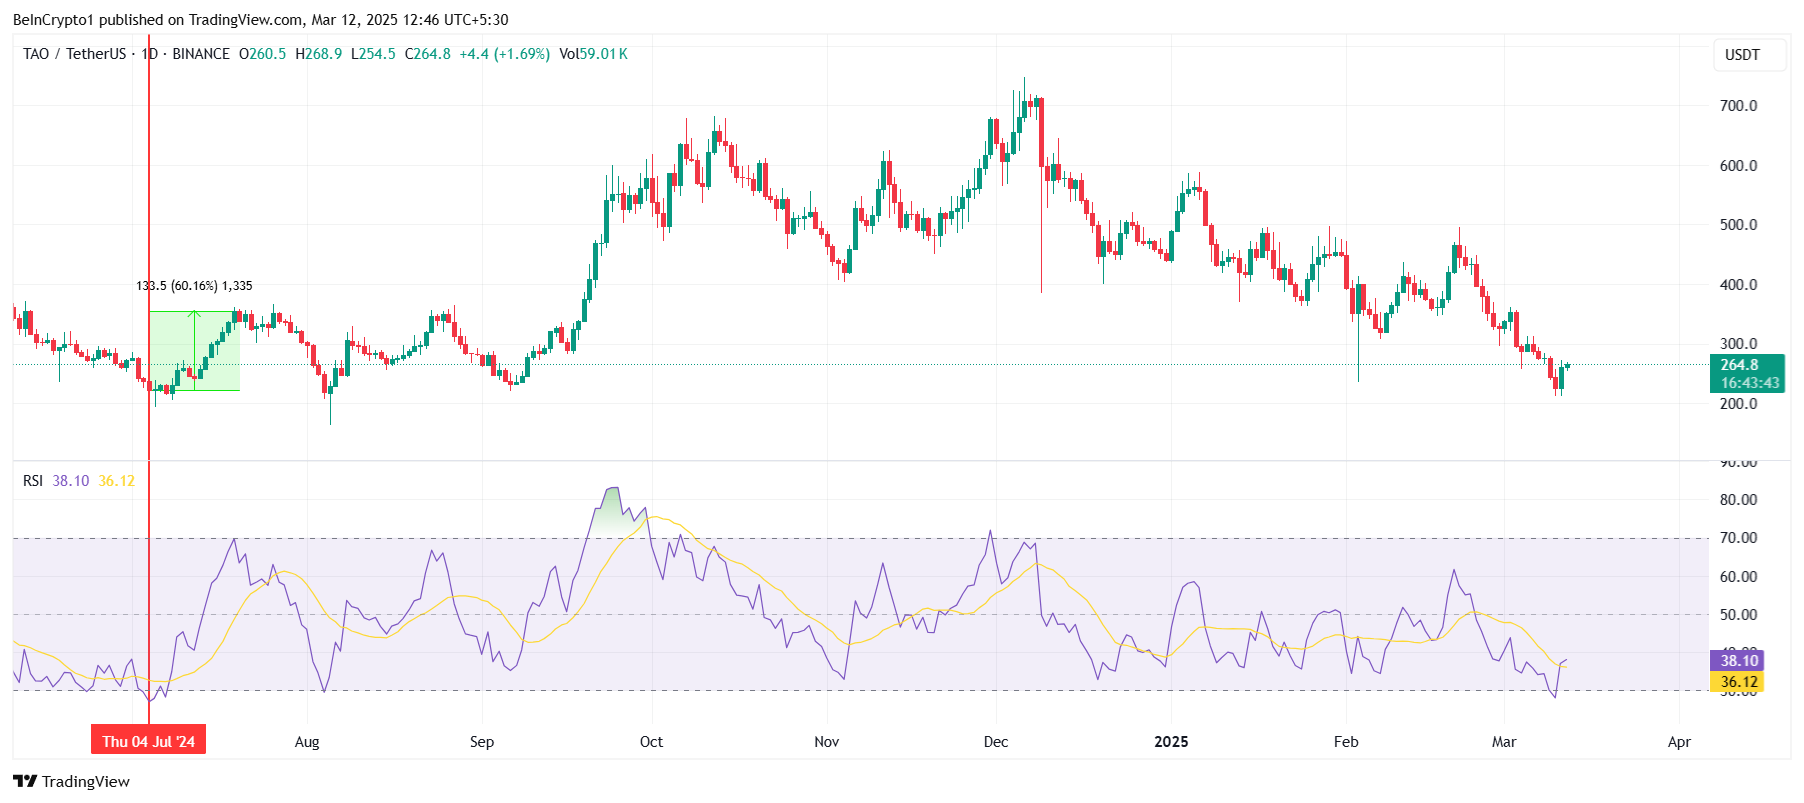
The Relative Strength Index (RSI) for Bittensor is currently recovering from the oversold zone, where it fell for the first time in eight months. This signals a potential turnaround, as the last time TAO entered the oversold region, it managed to bounce back and rally by 60%. Although such a large rally may not be expected this time, the historical pattern suggests that TAO is poised for a recovery.
As the RSI begins to climb back from its lows, investor confidence could start to improve. While the magnitude of the rally may be smaller this time, a return to more neutral or bullish territory is likely, which could help push the price of Bittensor back on an upward trajectory.
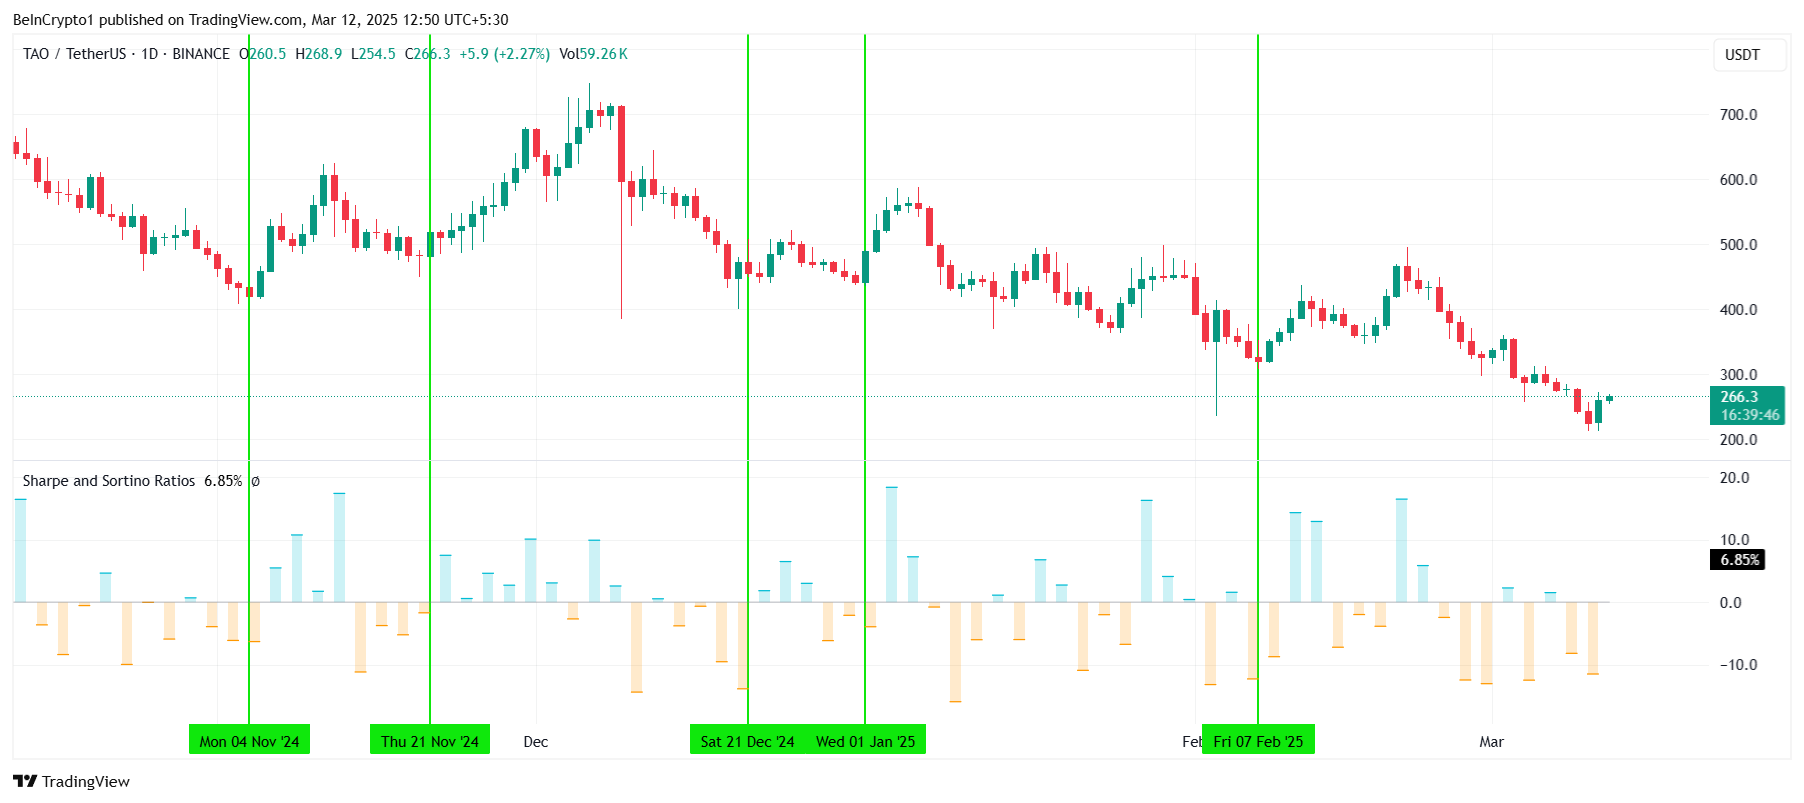
Bittensor’s broader macro momentum is also showing signs of potential recovery. The Sharpe Ratio, a key technical indicator, is deeply negative at the moment, but this has historically been a sign of future price recovery. When the Sharpe Ratio reached similar levels in the past, TAO managed to reverse its downtrend, making it a key signal for future upward movement.
As the Sharpe Ratio starts to stabilize, it could indicate that Bittensor’s risk-adjusted returns are improving. This suggests that TAO might be entering a phase where positive returns are more likely, potentially signaling the start of a recovery phase after its recent losses.
TAO Price Set To Bounce Back Soon
TAO recently experienced a significant 45% decline over two weeks, primarily due to its failure to break out of the descending wedge pattern. However, TAO is now trading at $264, having bounced off the lower trend line of this pattern. The altcoin remains stuck under the $300 mark, but it appears poised to breach this resistance in the near future.
If Bittensor can successfully break above the $298 level, it will signal a breakout from the descending wedge pattern. This could trigger a bullish rally, with the price targeting $351. Such a move would confirm the pattern’s completion and open the door for further price increases, marking the start of a recovery phase.
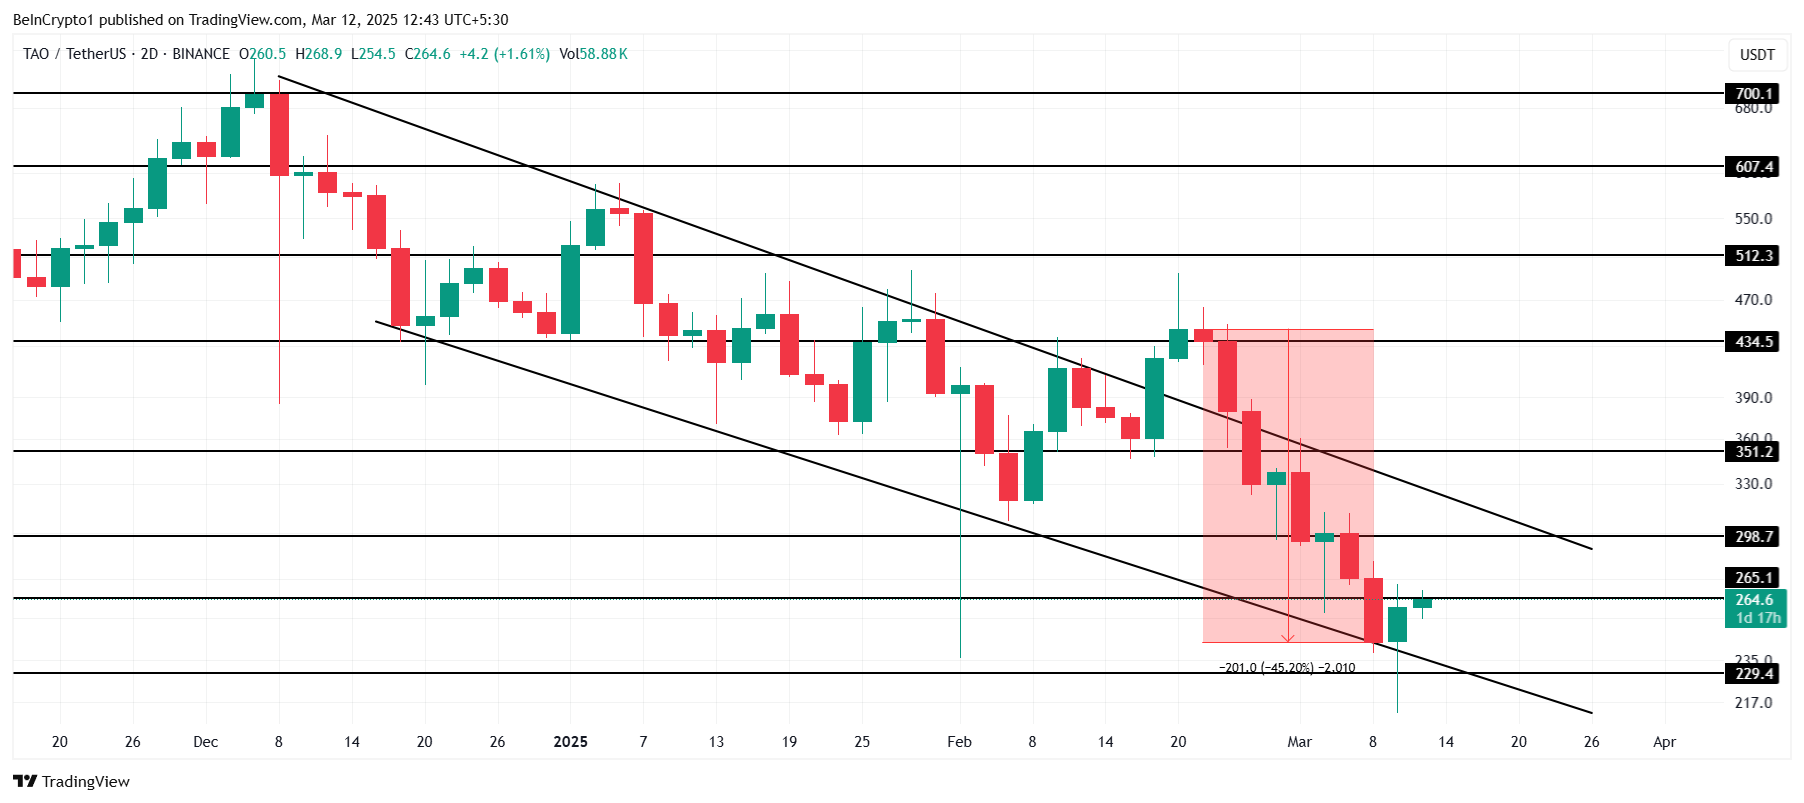
However, if the altcoin fails to break above the $265 barrier, the price could fall back to $229. A drop below this level would invalidate the bullish outlook, even if the descending wedge pattern remains intact. A failure to break through $298 would likely result in more consolidation or further declines.
Disclaimer
In line with the Trust Project guidelines, this price analysis article is for informational purposes only and should not be considered financial or investment advice. BeInCrypto is committed to accurate, unbiased reporting, but market conditions are subject to change without notice. Always conduct your own research and consult with a professional before making any financial decisions. Please note that our Terms and Conditions, Privacy Policy, and Disclaimers have been updated.

A study by Dragonfly indicates that Americans may have missed out on up to $2.64 billion from cryptocurrency airdrops.
Notably, another study by CoinGecko suggests this figure could be as high as $5.02 billion. So, what are the reasons behind this situation?
Americans Face Restrictions in Participating in Cryptocurrency Airdrop
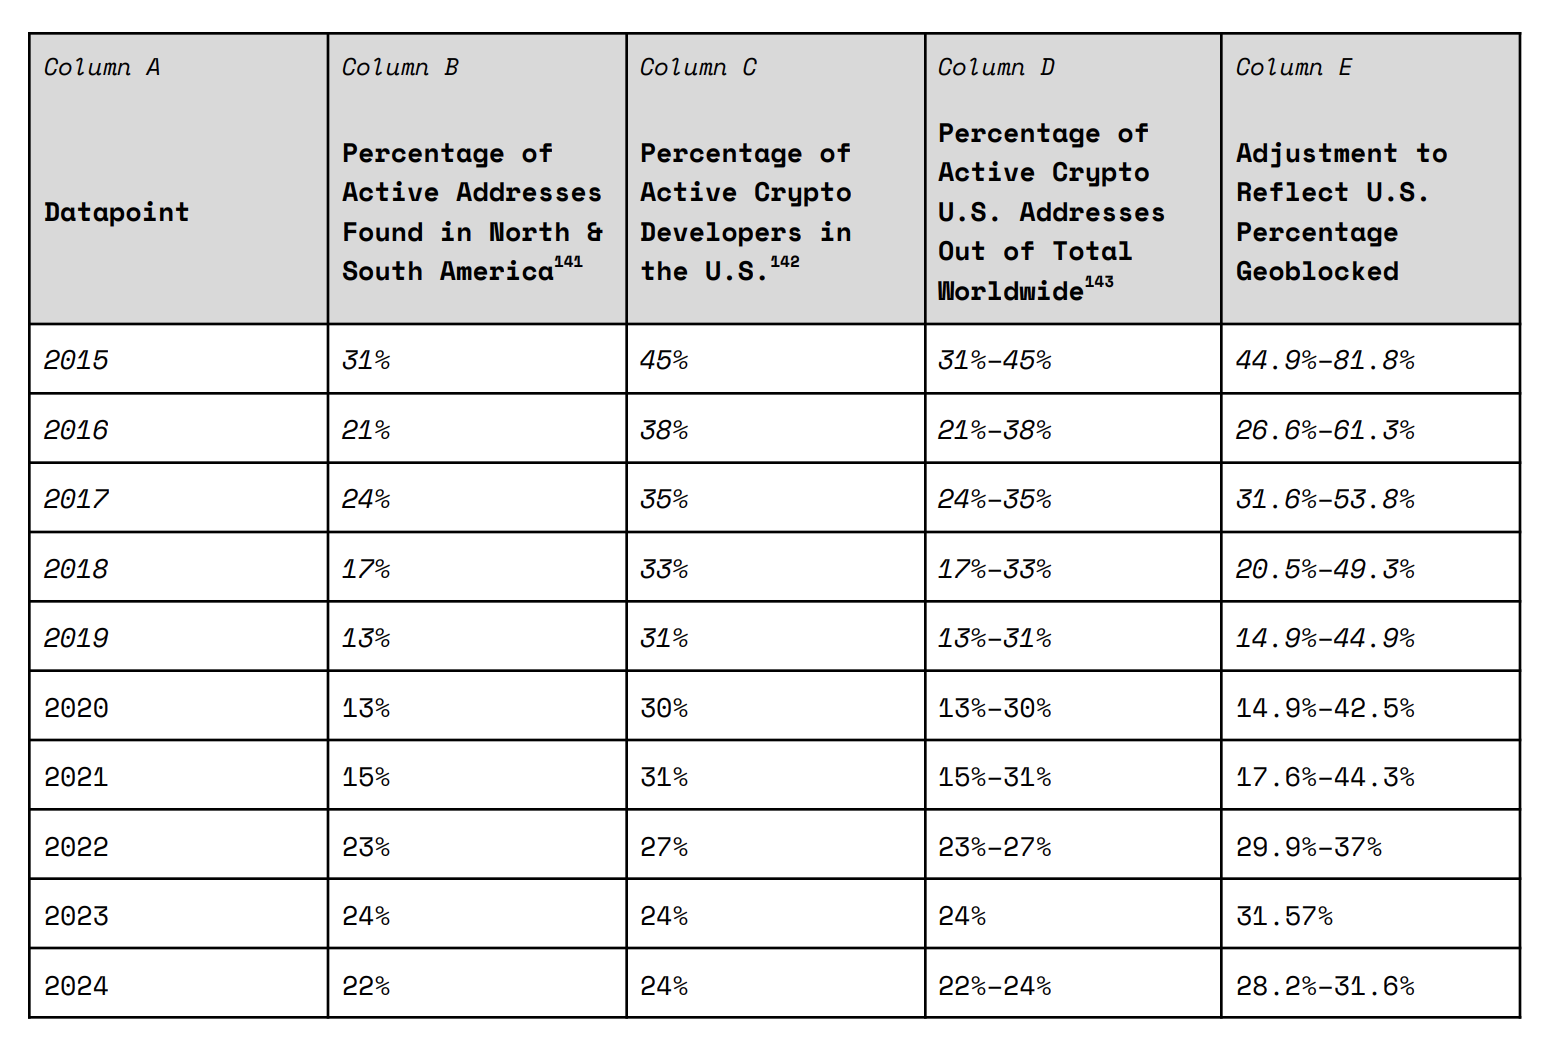
Dragonfly’s research findings are based on 12 cryptocurrency airdrops, including Uniswap and 1inch. Of these, 11 airdrops imposed restrictions on US IP addresses. Dragonfly discovered that the number of Americans affected by this IP blocking ranged from 920,000 to 5.2 million active users. This accounts for 5–10% of the 18.4 to 52.3 million cryptocurrency holders in the US impacted by geoblocking policies in 2024.
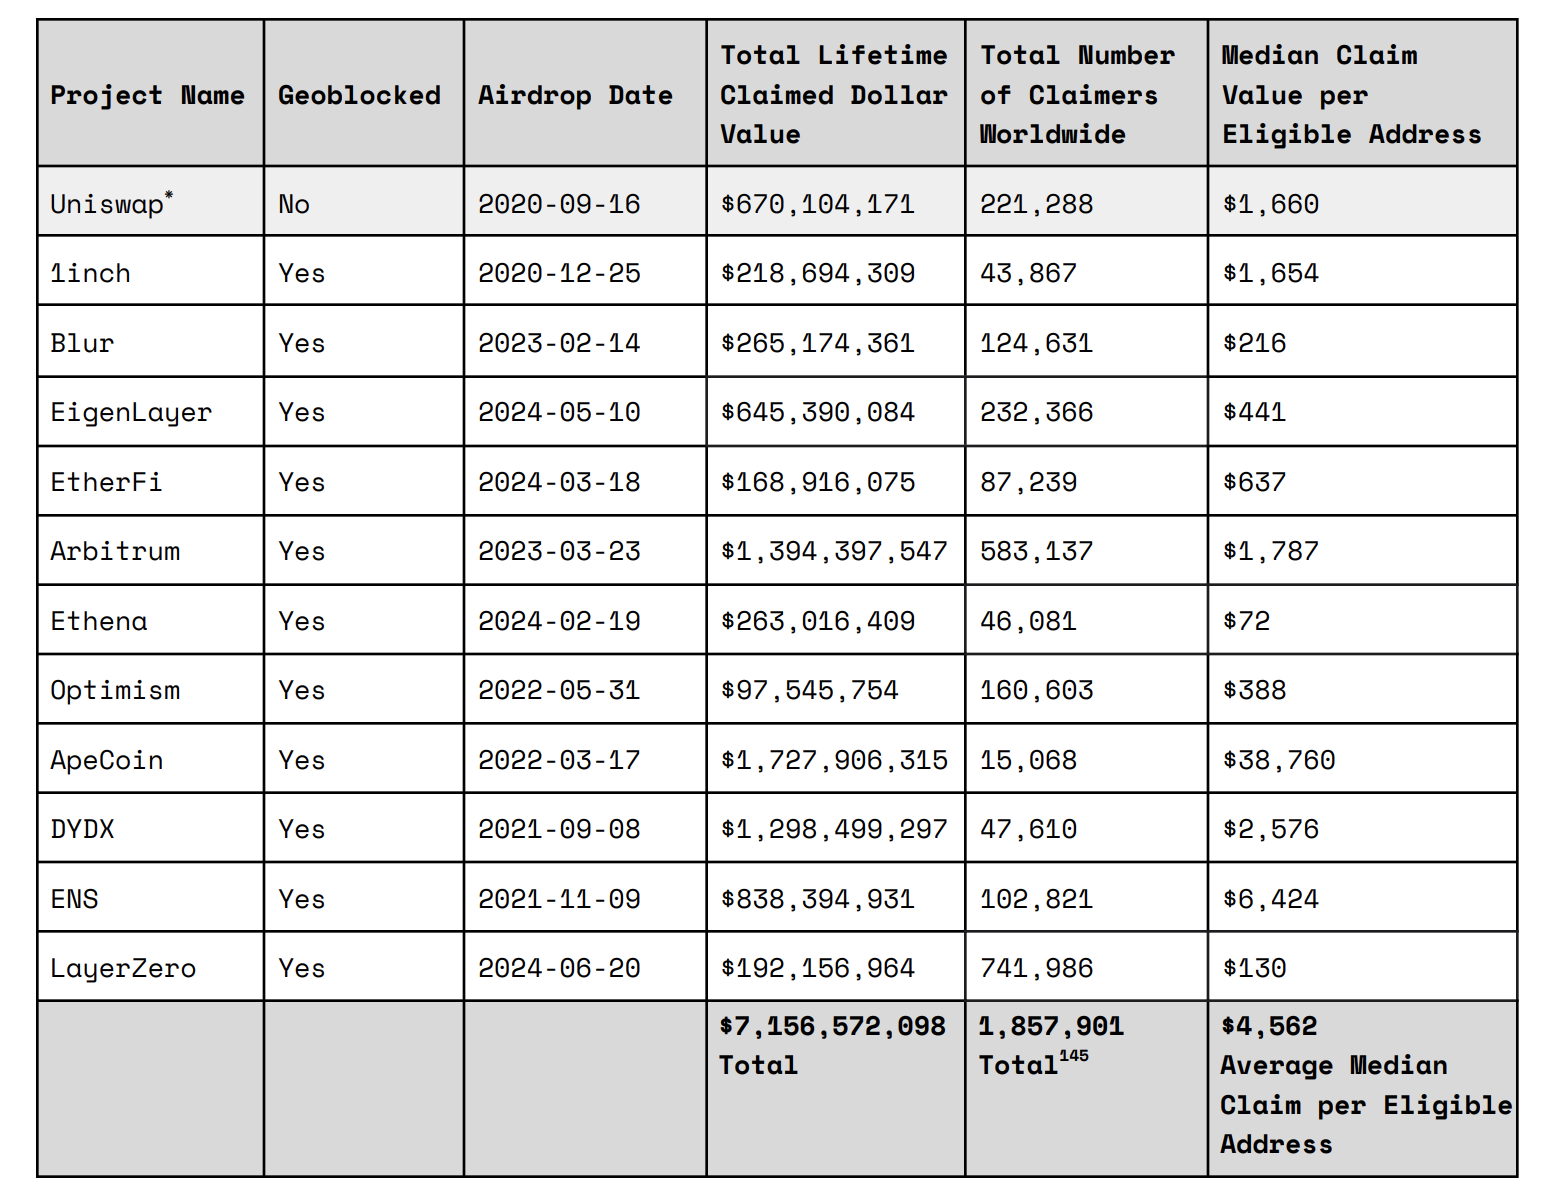
Approximately 22–24% of all active cryptocurrency addresses worldwide are US residents. The total value of the airdrops in Dragonfly’s sample amounted to around $7.16 billion. Approximately 1.9 million people globally claimed airdrops, with an average value of about $4,600 per eligible wallet address.
Based on these figures, Dragonfly estimates that Americans lost between $1.84 billion and $2.64 billion from 2020 to 2024 due to the 11 airdrops that blocked US users. Notably, CoinGecko conducted a similar analysis but with a larger sample size. Evaluating 21 airdrops that excluded Americans, CoinGecko estimates the losses could range from $3.49 billion to $5.02 billion.
The exclusion of US IP addresses from participating in crypto airdrops is a measure to avoid penalties from regulatory bodies like the Securities and Exchange Commission (SEC).
US Government Loses Nearly $3 Billion Due to Stringent Policies
The lost federal personal income tax revenue from geoblocked airdrops, based on CoinGecko’s sample from 2020 to 2024, is estimated to range from $418 million to $1.1 billion. The estimated lost state tax revenue ranges from $107 million to $284 million. This represents an estimated tax revenue loss of $525 million to $1.38 billion.
The relocation of cryptocurrency operations overseas has also significantly reduced US tax revenue. The report cites Tether as an example. Companies like Tether establishing headquarters in El Salvador may have cost the US approximately $1.3 billion in federal corporate taxes and $316 million in state taxes.
Crypto projects show caution amid potential legal challenges ahead of the new acting SEC Chair under President Trump’s administration. Blocking and losing a portion of US users is considered a safer option than facing costly litigation as is the case with Ripple, Kraken, or Coinbase.
Disclaimer
In adherence to the Trust Project guidelines, BeInCrypto is committed to unbiased, transparent reporting. This news article aims to provide accurate, timely information. However, readers are advised to verify facts independently and consult with a professional before making any decisions based on this content. Please note that our Terms and Conditions, Privacy Policy, and Disclaimers have been updated.

Cardano price started a fresh decline below the $0.75 zone. ADA is correcting some losses and might face resistance near the $0.750 level.
- ADA price started a recovery wave from the $0.650 zone.
- The price is trading below $0.750 and the 100-hourly simple moving average.
- There is a short-term bearish trend line forming with resistance at $0.720 on the hourly chart of the ADA/USD pair (data source from Kraken).
- The pair could start another increase if it clears the $0.750 resistance zone.
Cardano Price Climbs Higher
In the past few days, Cardano saw a bearish wave below the $0.80 level, like Bitcoin and Ethereum. ADA declined below the $0.750 and $0.70 support levels.
Finally, it tested the $0.650 zone. A low was formed at $0.6495 and the price recently started a recovery wave. The price climbed above the $0.680 and $0.70 level. The price tested the 50% Fib retracement level of the downward move from the $0.8169 swing high to the $0.6495 low.
There was a short-term bearish trend line forming with resistance at $0.720 on the hourly chart of the ADA/USD pair. Cardano price is now trading below $0.80 and the 100-hourly simple moving average.
On the upside, the price might face resistance near the $0.750 zone and the 61.8% Fib retracement level of the downward move from the $0.8169 swing high to the $0.6495 low. The first resistance is near $0.7750. The next key resistance might be $0.80.

If there is a close above the $0.80 resistance, the price could start a strong rally. In the stated case, the price could rise toward the $0.950 region. Any more gains might call for a move toward $1.00 in the near term.
Another Decline in ADA?
If Cardano’s price fails to climb above the $0.750 resistance level, it could start another decline. Immediate support on the downside is near the $0.7150 level.
The next major support is near the $0.6880 level. A downside break below the $0.6880 level could open the doors for a test of $0.650. The next major support is near the $0.6320 level where the bulls might emerge.
Technical Indicators
Hourly MACD – The MACD for ADA/USD is losing momentum in the bullish zone.
Hourly RSI (Relative Strength Index) – The RSI for ADA/USD is now below the 50 level.
Major Support Levels – $0.7150 and $0.6880.
Major Resistance Levels – $0.7500 and $0.7750.

Will Bittensor (TAO) Rally? Key Indicators Predict Price Rebound

Bitcoin Price Jumps as US CPI Data Falls Below Expectations

Americans Miss Out on Billions from Crypto Airdrops, Study Finds

Role of Finality Bridge in Bitcoin’s Future

Can Dogecoin Price Still Hit $5 Despite US SEC’s DOGE ETF Delay?

Cardano Struggles to Climb—ADA Faces Strong Hurdles Ahead

2.52 Million Altcoins Are Ruining Crypto’s Future

Animoca Brands Valuation Tanks 75% In Two Years, Here’s Why

Crypto exchange BingX hacked for $43 million

Are The Big Players Losing Interest?

Hong Kong’s Securities Association Tips Authorities On Crypto Self-Regulation

Coinbase cbBTC Set to go Live on Solana
2.52 Million Altcoins Are Ruining Crypto’s Future
Animoca Brands Valuation Tanks 75% In Two Years, Here’s Why
Crypto exchange BingX hacked for $43 million
Are The Big Players Losing Interest?
Hong Kong’s Securities Association Tips Authorities On Crypto Self-Regulation
Coinbase cbBTC Set to go Live on Solana
-

 Market22 hours ago
Ripple CTO and Robert Kiyosaki Advise Buying Bitcoin
-

 Altcoin21 hours ago
CBOE Files For Staking In Fidelity’s Ethereum ETF
-

 Market24 hours ago
Bitcoin’s Potential Bottom: Expert Predictions
-
 Altcoin23 hours ago
Binance Unveils Key Update On CATI & These 5 Crypto, What’s Lies Ahead?
-

 Market23 hours ago
What It Means for Ethereum’s Reputation
-

 Altcoin15 hours ago
Top Analyst Names 3 Conditions For Cardano To Flip Solana
-

 Market21 hours ago
Cardano Enters Opportunity Zone, But ADA Holders Are Skeptical
-

 Market20 hours ago
XRP Price Face Major Resistance At $2.9, Why This Analyst Believes $20 Is Still Possible