
Market
SuperRare (RARE) Surges 50% – Is a Correction Coming?

SuperRare (RARE) has surged roughly 50% in the last 24 hours, reaching its highest price levels in nearly two months. This sharp rally has pushed its Relative Strength Index (RSI) into overbought territory for the first time since November 2024, signaling extreme bullish momentum.
Additionally, RARE has broken above the Ichimoku Cloud, suggesting a potential shift in market sentiment. With no major catalysts behind the move, traders are closely watching key support levels in case a sharp correction follows.
RARE RSI Reached Overbought Levels For The First Time In Months
SuperRare has seen a sharp spike in its Relative Strength Index (RSI), jumping from 35.8 yesterday to 81.2 today, alongside the strong price surge.
This rapid increase reflects intense buying pressure, pushing RARE from near-oversold levels into overbought territory.
Such a move signals heightened bullish momentum, but it also raises questions about whether the rally can be sustained or if a pullback is imminent.
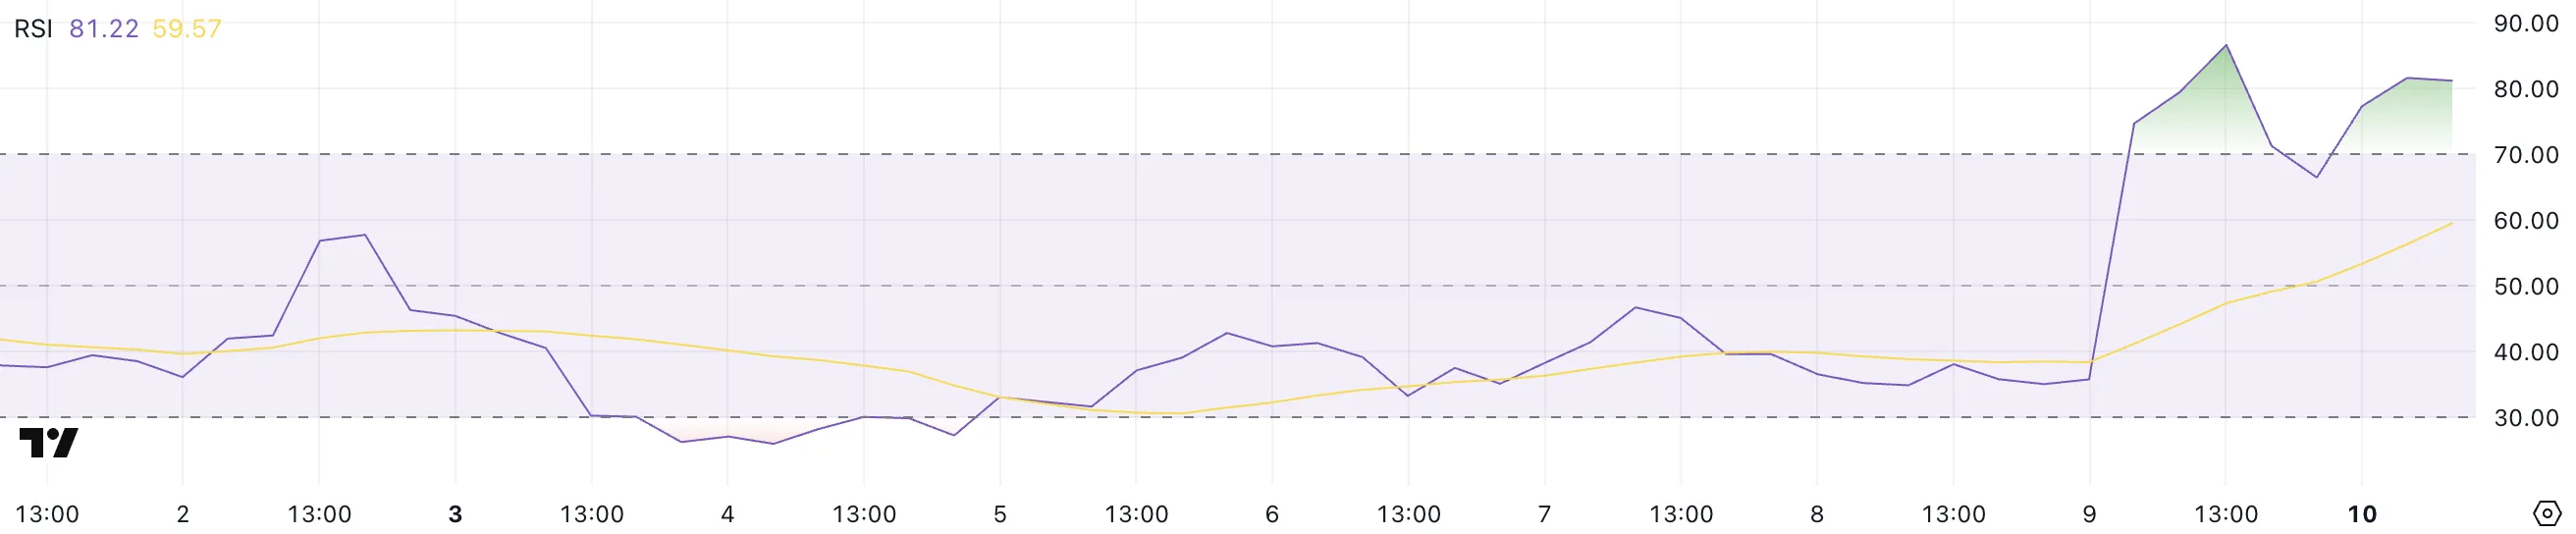
RSI is a momentum indicator that measures the speed of price changes on a scale from 0 to 100. Readings below 30 indicate oversold conditions, while levels above 70 suggest an asset may be overbought.
With RARE’s RSI now at 81.2, it has reached overbought territory for the first time since November 2024, marking its highest level in seven months.
This could indicate exhaustion in buying pressure, increasing the likelihood of consolidation or a correction unless demand remains strong enough to sustain further gains.
SuperRare Ichimoku Cloud Shows Momentum Could Change Soon
SuperRare has made a strong breakout above the Ichimoku Cloud, signaling a shift in trend momentum.
After consolidating below the cloud for several days, the price surged, pushing well above the red resistance zone. The breakout was accompanied by strong bullish candles, confirming the strength of the move.
Additionally, the Tenkan-sen (red line) has turned upward, aligning with the bullish trend.
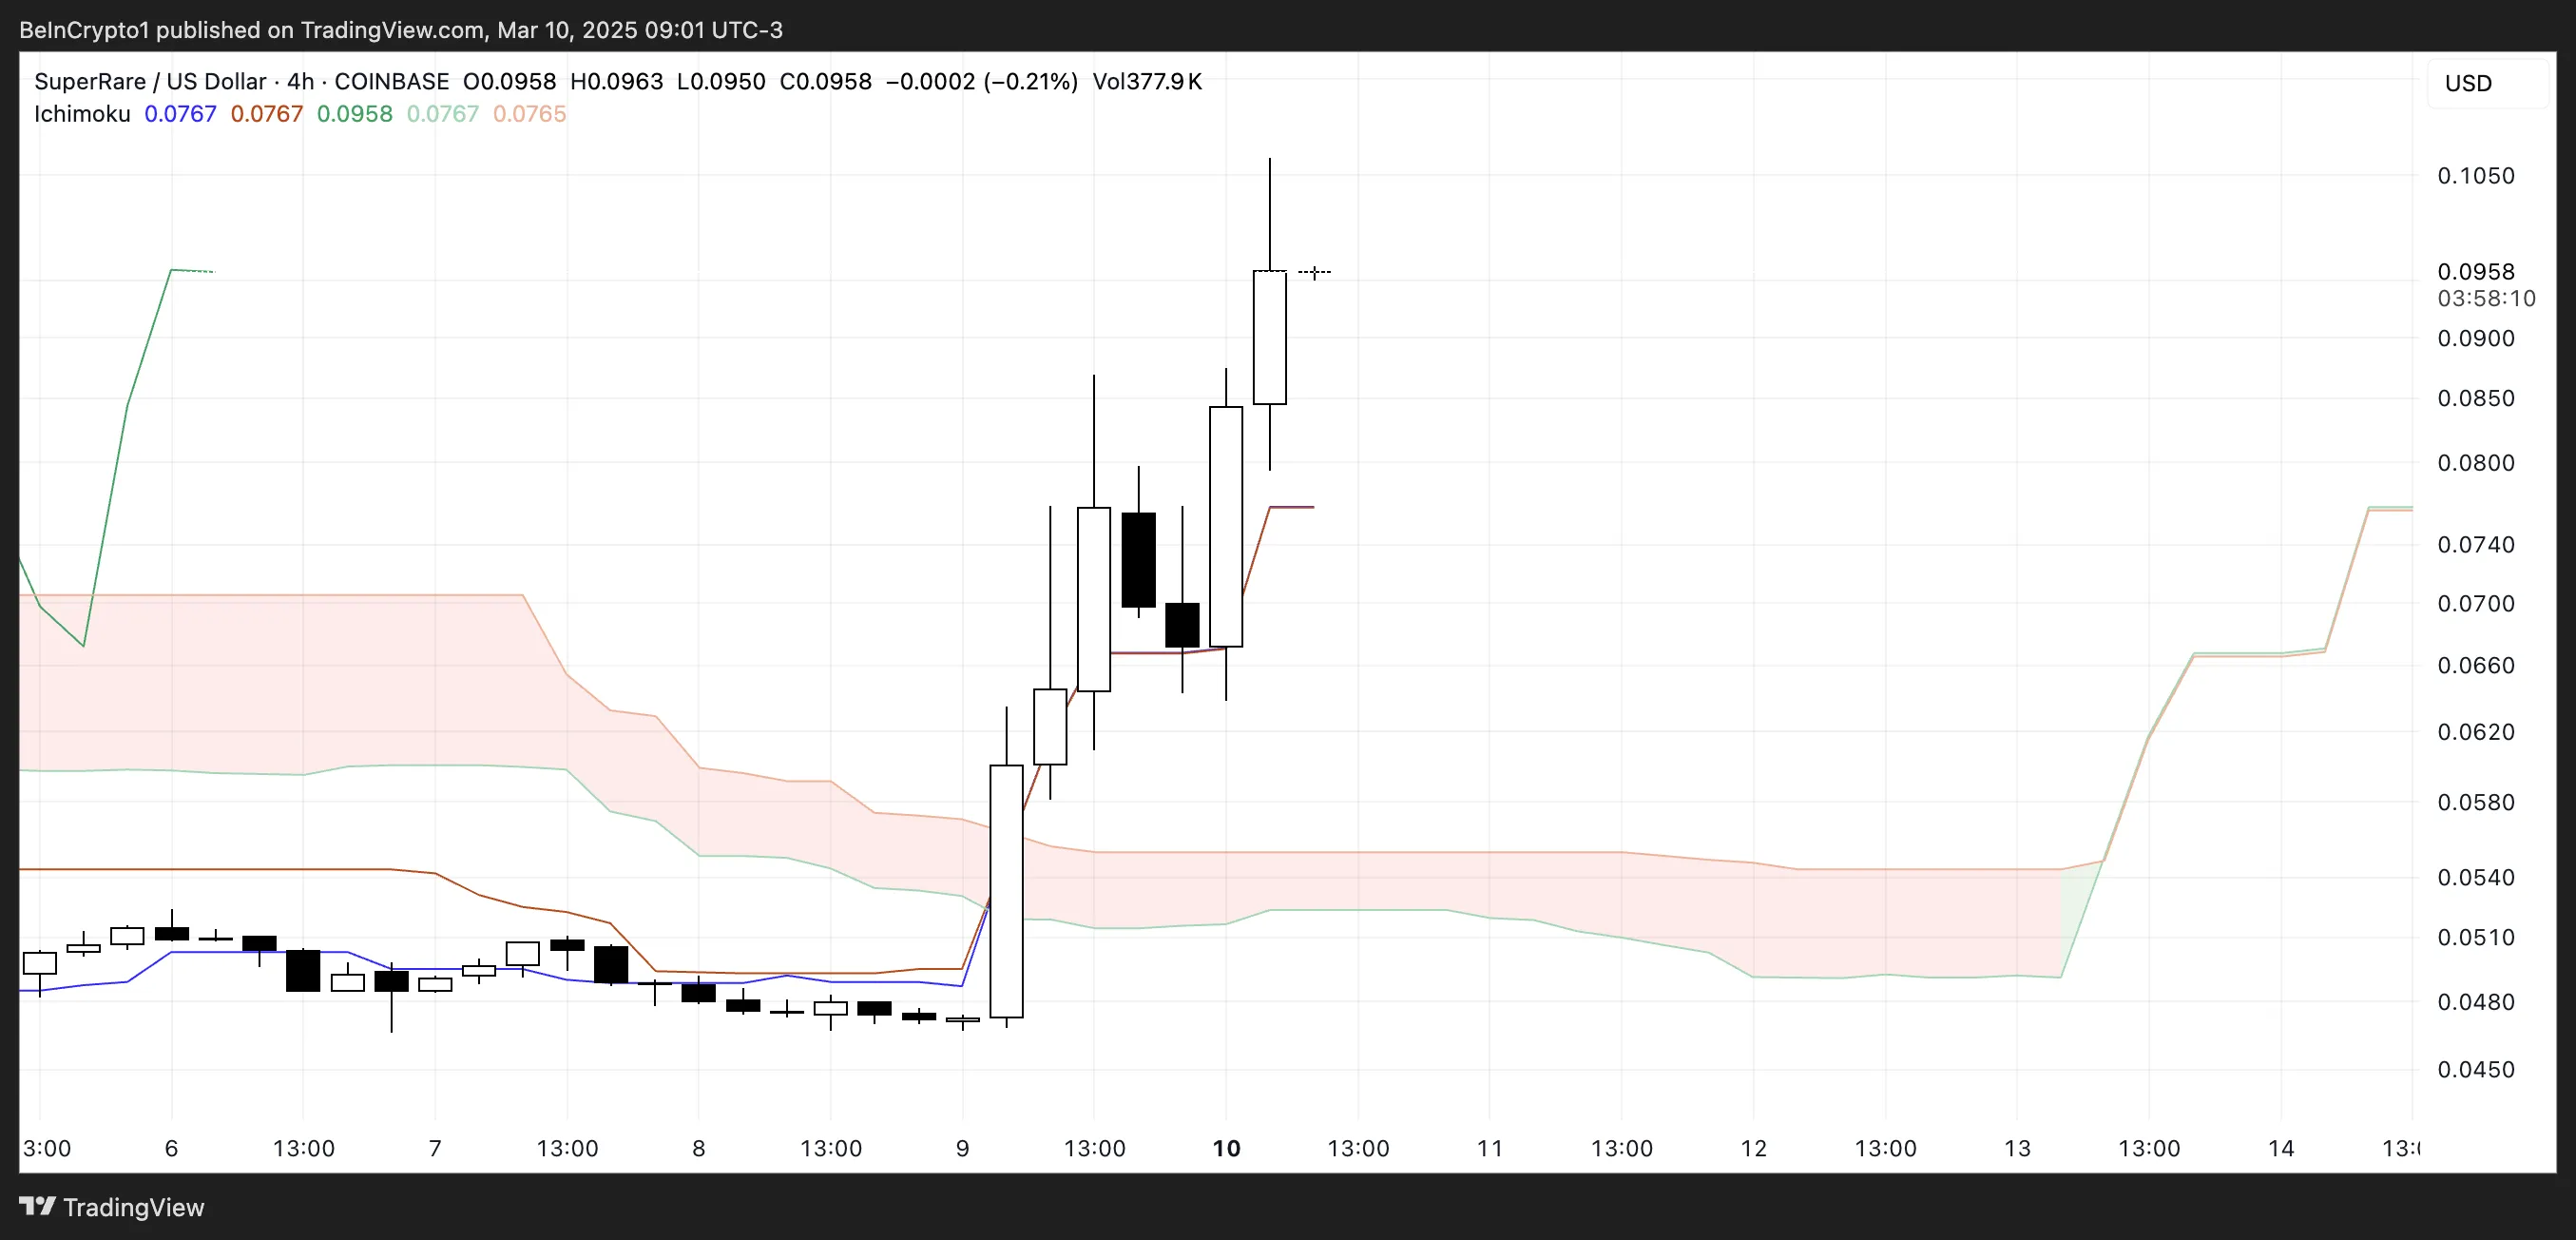
In Ichimoku analysis, the cloud (Kumo) acts as a support or resistance zone, with a breakout above it suggesting a potential trend reversal to the upside.
The fact that RARE has now cleared the cloud with strong momentum indicates buyers are in control. This is the first time in several months that RARE has established itself decisively above the cloud, suggesting a shift in market sentiment.
However, with the cloud still flat ahead, traders will watch whether the price can sustain above it or if a retest of the breakout level occurs.
RARE Could Strongly Correct Soon
SuperRare price is approaching a potential golden cross formation, where the shorter-term EMA could cross above the longer-term EMA, signaling a bullish trend shift.
If this crossover occurs, it could trigger further upward momentum, potentially pushing RARE toward the $0.10 level for the first time since mid-January.
The EMAs are gradually aligning for this setup, and if buying pressure remains strong, RARE could extend its rally as traders react to the bullish signal.
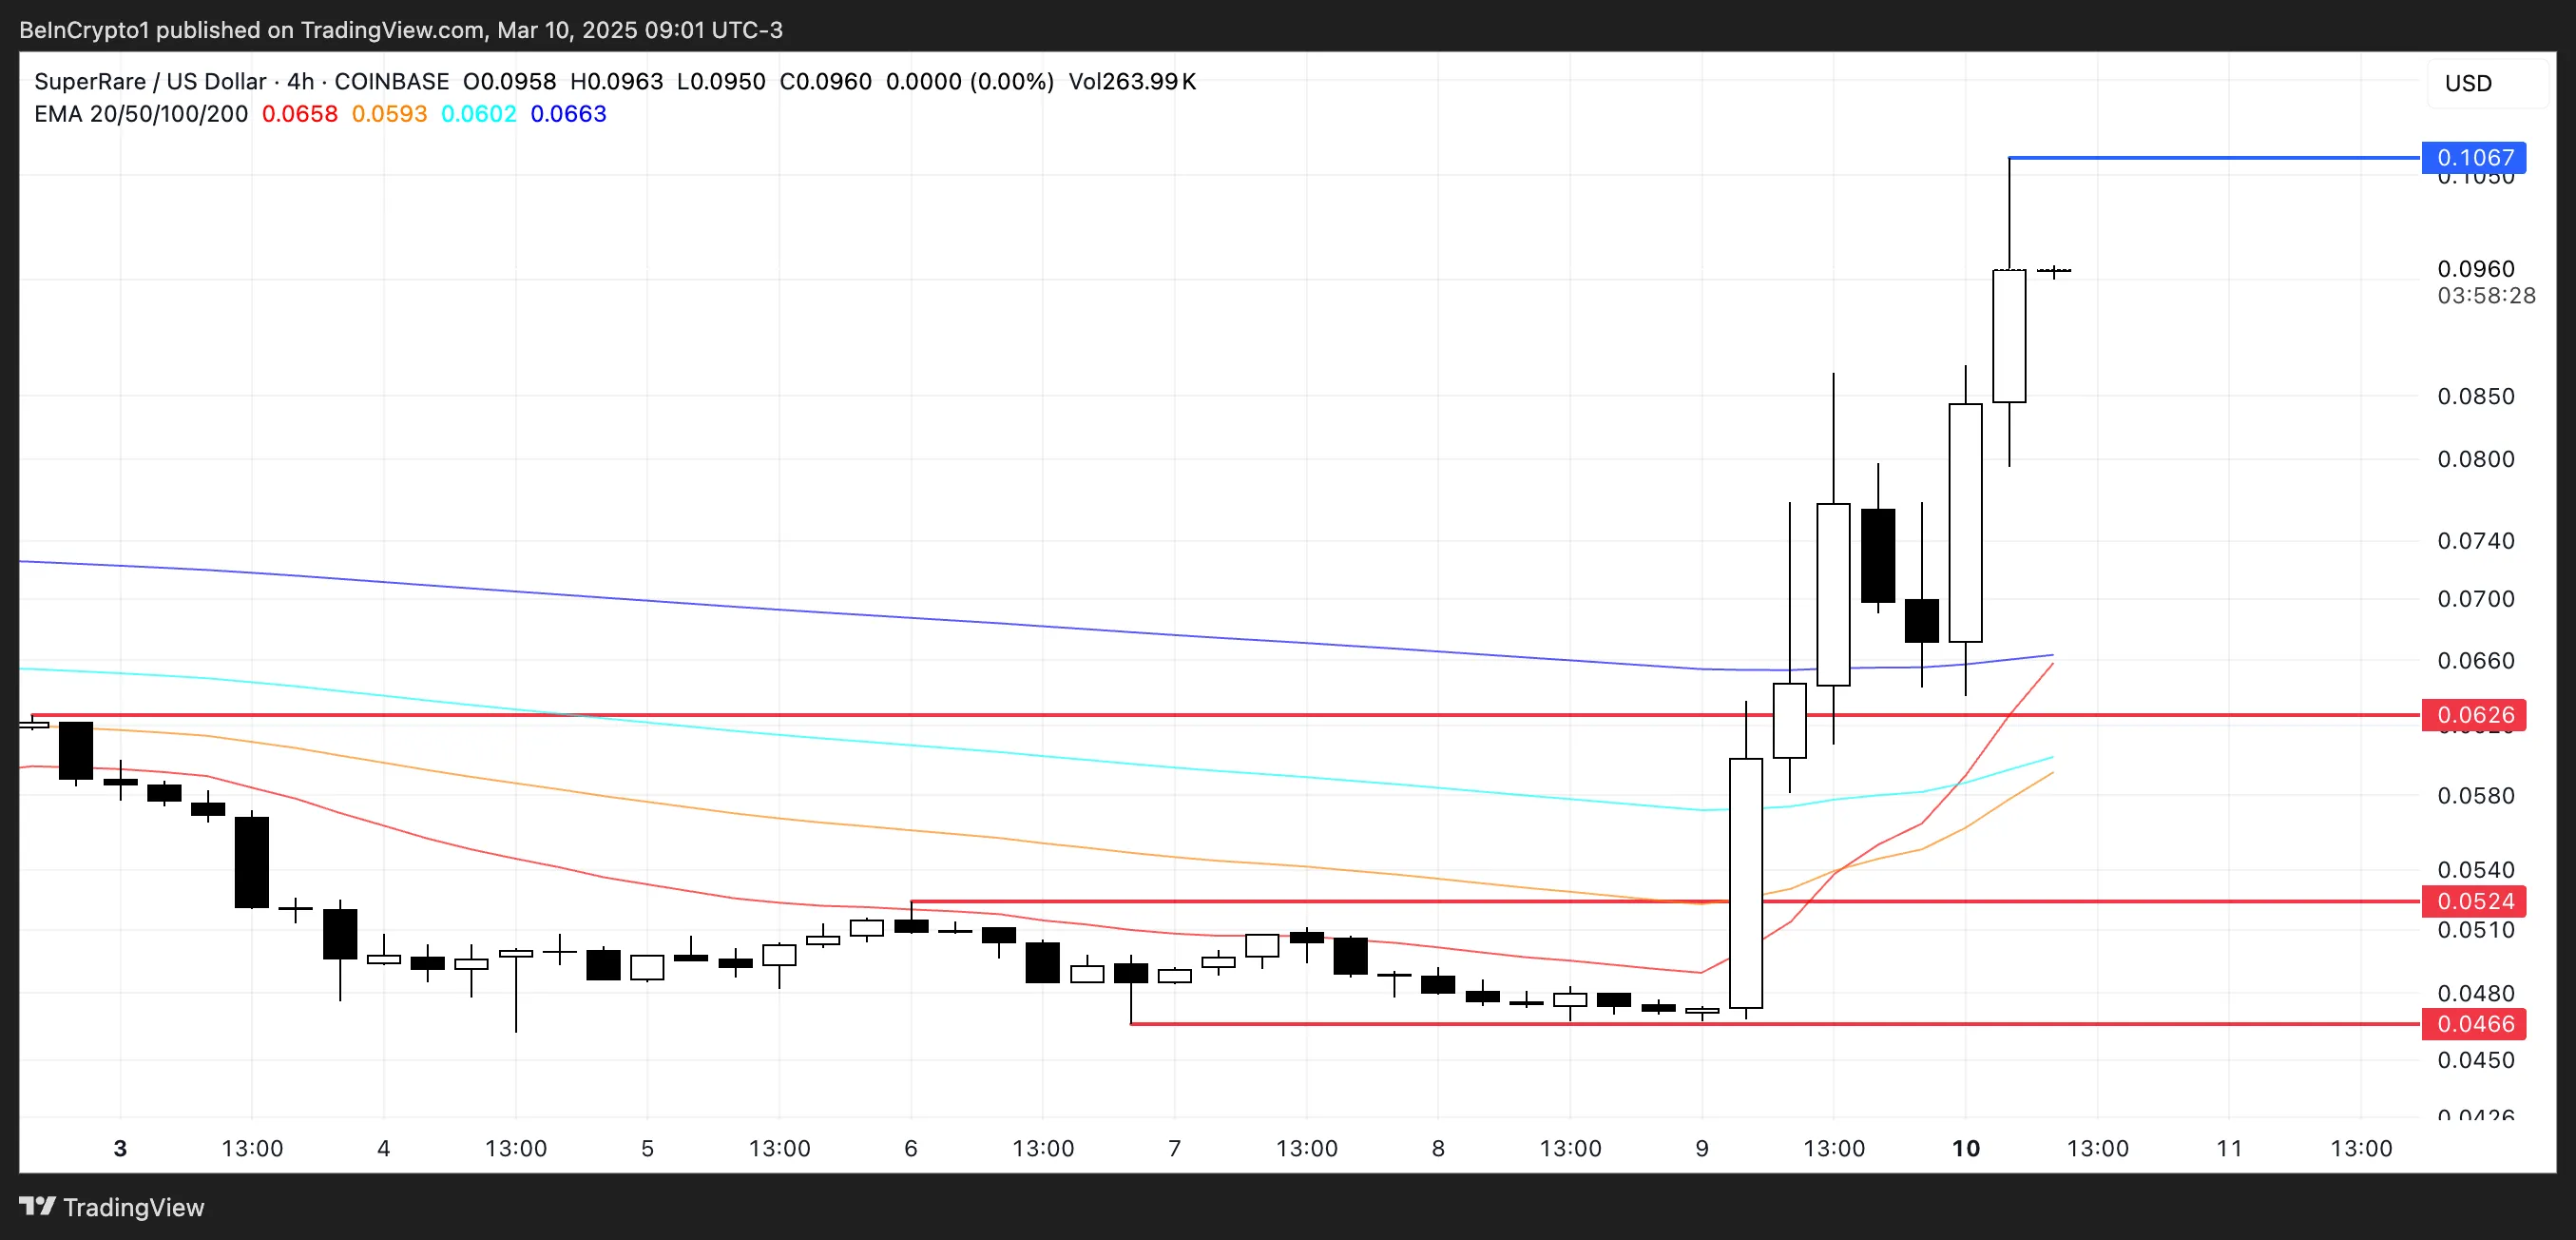
However, no fundamental catalysts or major developments appear to have contributed to this recent surge, raising concerns about its sustainability.
If momentum fades and a correction begins, RARE could first test support at $0.062.
A breakdown below that level would open the door for a deeper decline toward $0.052 or even $0.046, representing a potential correction of over 50% from its recent highs.
Disclaimer
In line with the Trust Project guidelines, this price analysis article is for informational purposes only and should not be considered financial or investment advice. BeInCrypto is committed to accurate, unbiased reporting, but market conditions are subject to change without notice. Always conduct your own research and consult with a professional before making any financial decisions. Please note that our Terms and Conditions, Privacy Policy, and Disclaimers have been updated.


Pi Network (PI) is down more than 19% in the last seven days, continuing its correction while trading below $2 since March 1. Selling pressure remains dominant, with indicators like the DMI and CMF signaling further downside risks.
PI’s EMA lines also suggest a potential death cross, which could lead to a deeper decline toward $0.95 if key support levels break. However, if momentum shifts and buyers step in, PI could attempt to reclaim $2 and possibly push toward new all-time highs above $3.
Pi Network DMI Shows Sellers Are Still In Control, Despite The Buying Pressure Yesterday
PI Directional Movement Index (DMI) shows that its Average Directional Index (ADX) has surged to 34.29, up from just 8.97 two days ago.
This sharp increase indicates that the current price trend – whether bullish or bearish – is gaining strength. Given the recent volatility, traders are closely watching whether PI will sustain its momentum or see another shift in trend direction.
ADX measures the strength of a trend on a scale from 0 to 100, with values above 25 indicating a strong trend and above 50 suggesting an extremely strong trend.
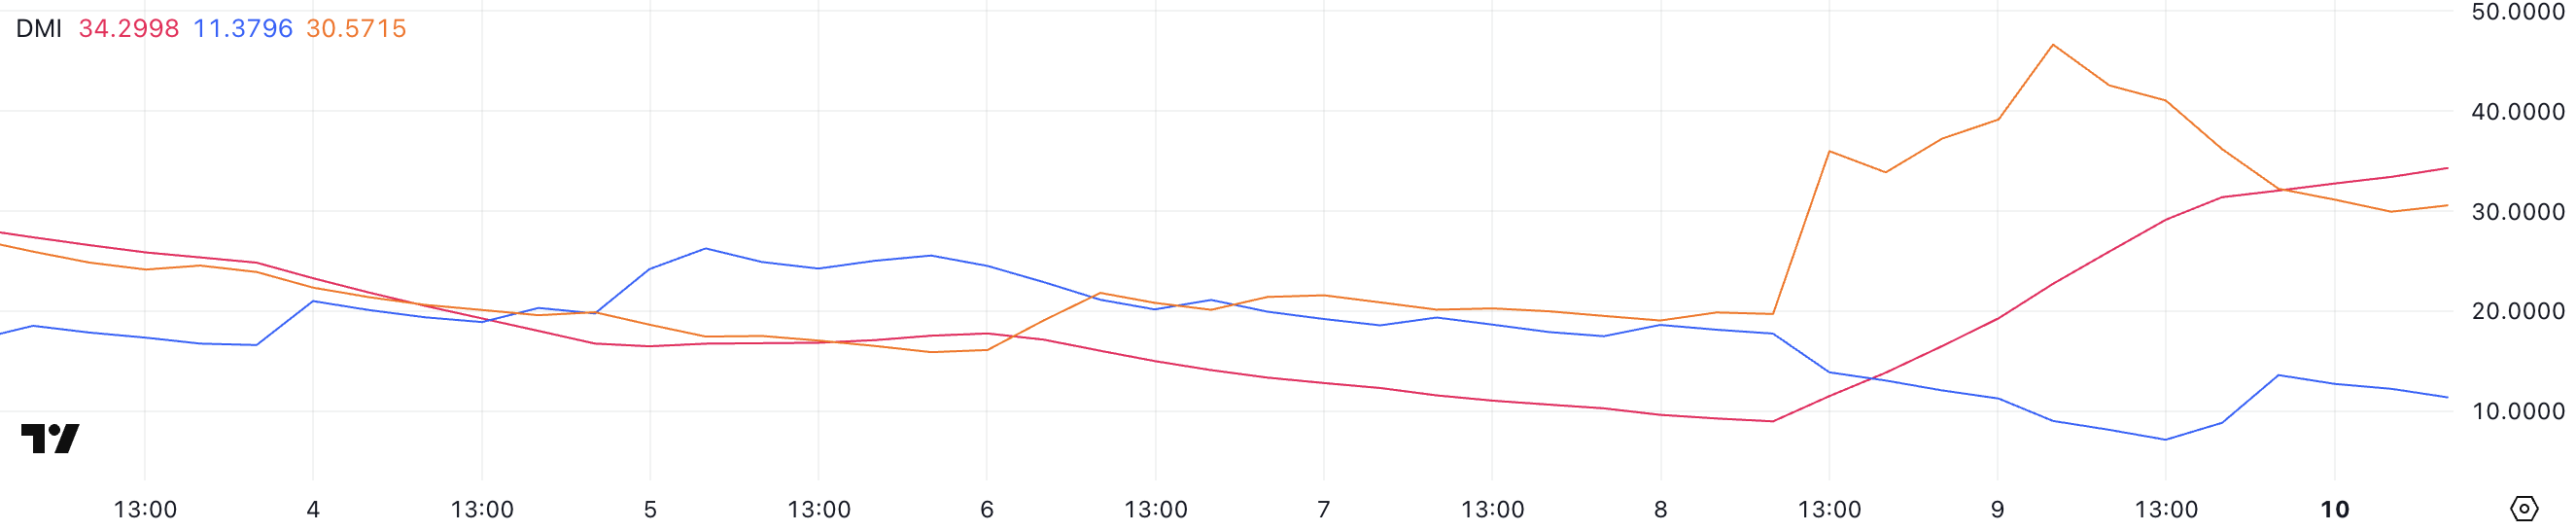
Meanwhile, PI’s +DI (positive directional index) is at 11.37, down from 17.7 two days ago but recovering from 7.14 yesterday. This signals weak but slightly improving bullish attempts.
At the same time, -DI (negative directional index) is at 30.57, up from 19.5 two days ago but lower after reaching 46.6 yesterday.
This suggests that while selling pressure remains dominant, bears may be losing some momentum, leaving room for potential stabilization or a short-term bounce.
PI CMF Is Reaching All-Time Lows
Pi Network Chaikin Money Flow (CMF) is currently at -0.19, dropping from 0.03 just a day ago. This sharp decline indicates a significant shift in capital flow, suggesting that selling pressure has increased quickly.
A few hours ago, PI’s CMF reached -0.21, marking its lowest level ever. This highlights the intensity of the recent outflows.
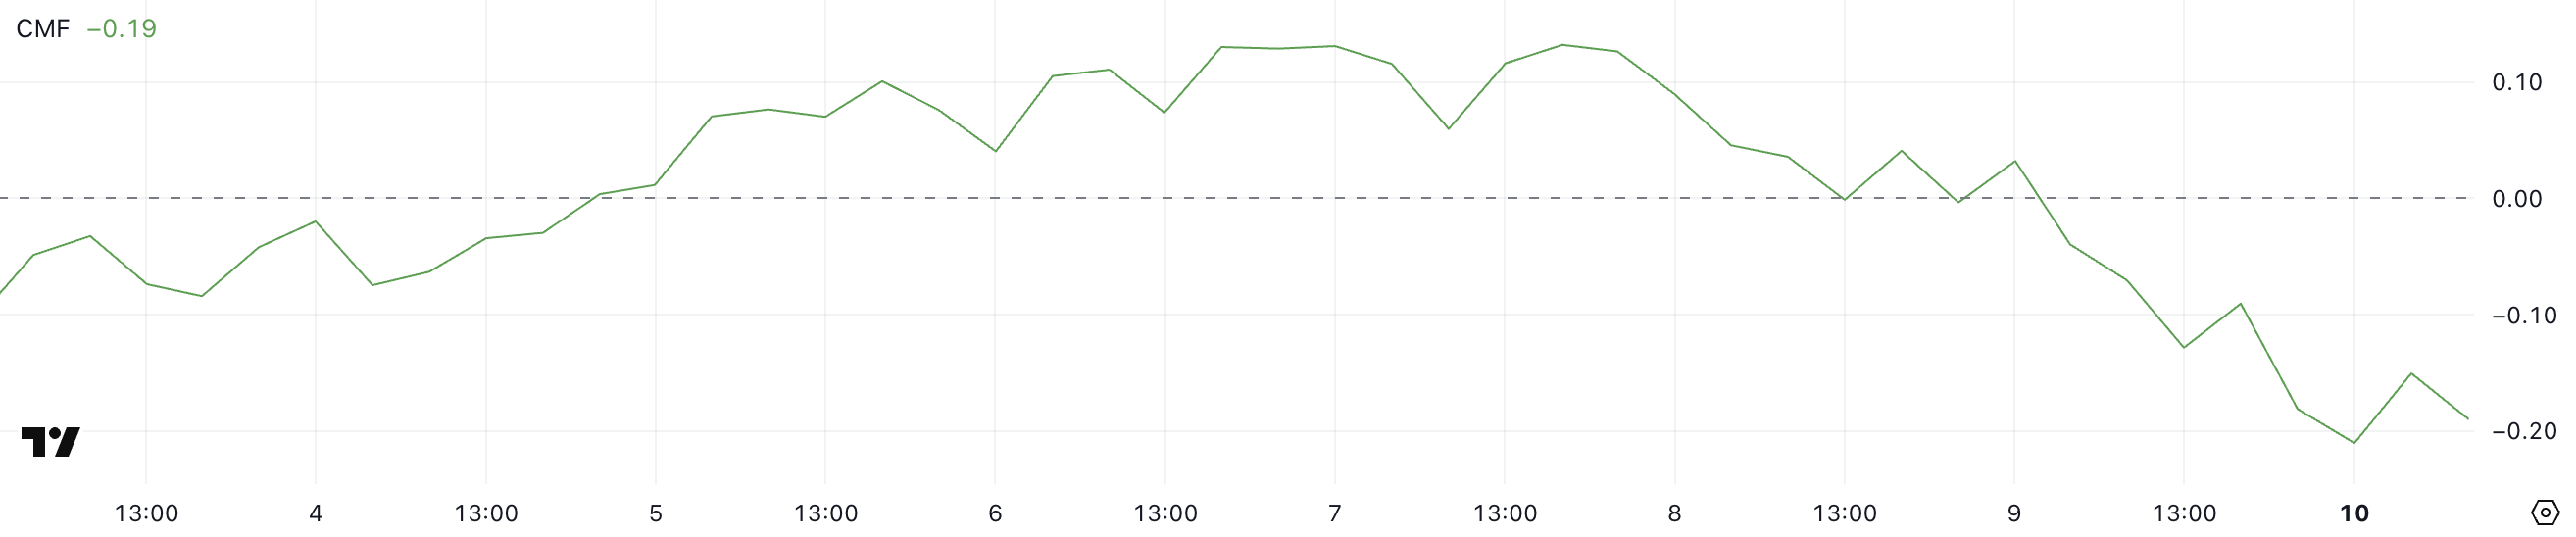
CMF is an indicator that measures the volume-weighted flow of money in and out of an asset, ranging from -1 to 1. Positive values indicate buying pressure, while negative values suggest increasing selling pressure.
With PI’s CMF now at -0.19, close to its all-time low, it signals that sellers are in control, potentially driving the price lower. Unless buying activity returns, PI could remain under pressure, struggling to regain bullish momentum.
Will Pi Network Fall Below $1 In March?
Pi Network price is currently trading between a key resistance at $1.51 and a support level at $1.23, with its EMA lines signaling a bearish trend. A potential death cross may form soon, which could accelerate selling pressure.
If this bearish crossover happens and PI loses the $1.23 support, it could drop further, potentially reaching as low as $0.95.
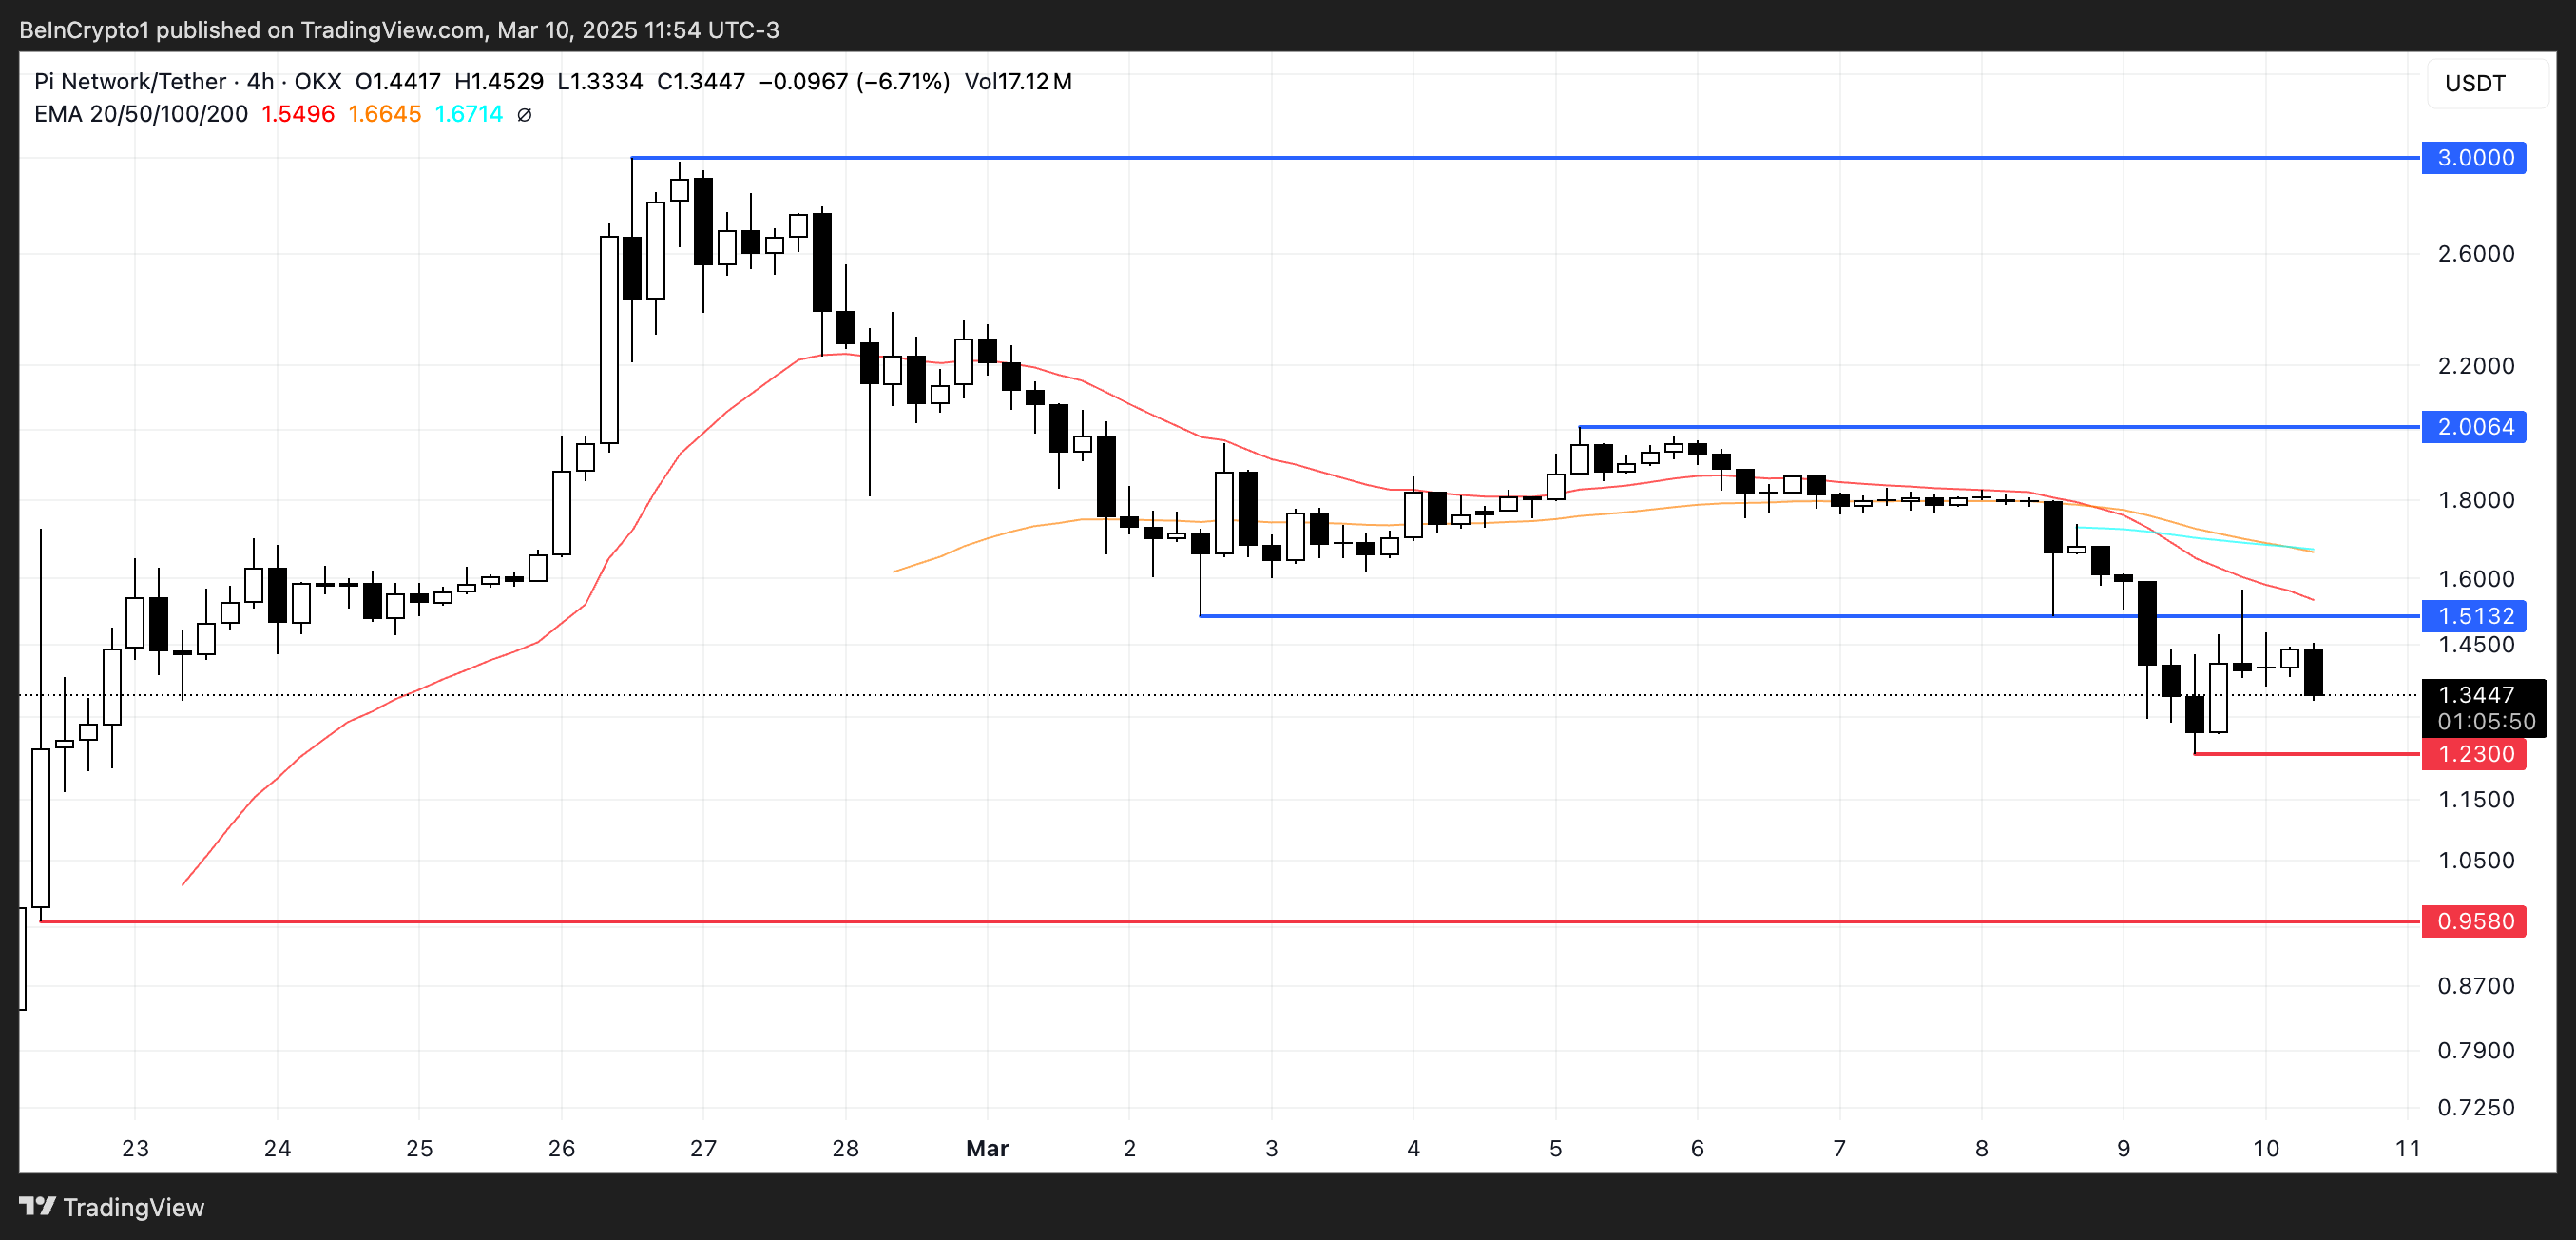
However, if PI manages to regain an uptrend, it could first test resistance at $1.51, with a breakout opening the door for a move toward $2.
A stronger rally could push PI above $3 for the first time, making new all-time highs, despite recent criticism from the Bybit CEO.
Disclaimer
In line with the Trust Project guidelines, this price analysis article is for informational purposes only and should not be considered financial or investment advice. BeInCrypto is committed to accurate, unbiased reporting, but market conditions are subject to change without notice. Always conduct your own research and consult with a professional before making any financial decisions. Please note that our Terms and Conditions, Privacy Policy, and Disclaimers have been updated.

Cardano (ADA) is facing intense selling pressure, dropping nearly 10% in the last 24 hours and almost 29% over the past week. Since its inclusion in the U.S. strategic crypto reserve, ADA has fallen 39%, struggling to regain bullish momentum.
Indicators like BBTrend and DMI show that bearish sentiment remains strong, with sellers still in control. If the current downtrend continues, ADA could test key support levels, but a reversal could push it back toward major resistance zones.
ADA BBTrend Shows the Selling Pressure Is Getting Stronger
Cardano BBTrend indicator is currently at -19.52, continuing its decline since yesterday. Earlier this month, from March 5 to March 8, BBTrend remained positive, reaching a peak of 31 on March 6.
This shift from positive to negative territory suggests a weakening bullish trend, with increasing downside pressure on ADA price. Traders are now watching whether this decline continues or if ADA can regain momentum.
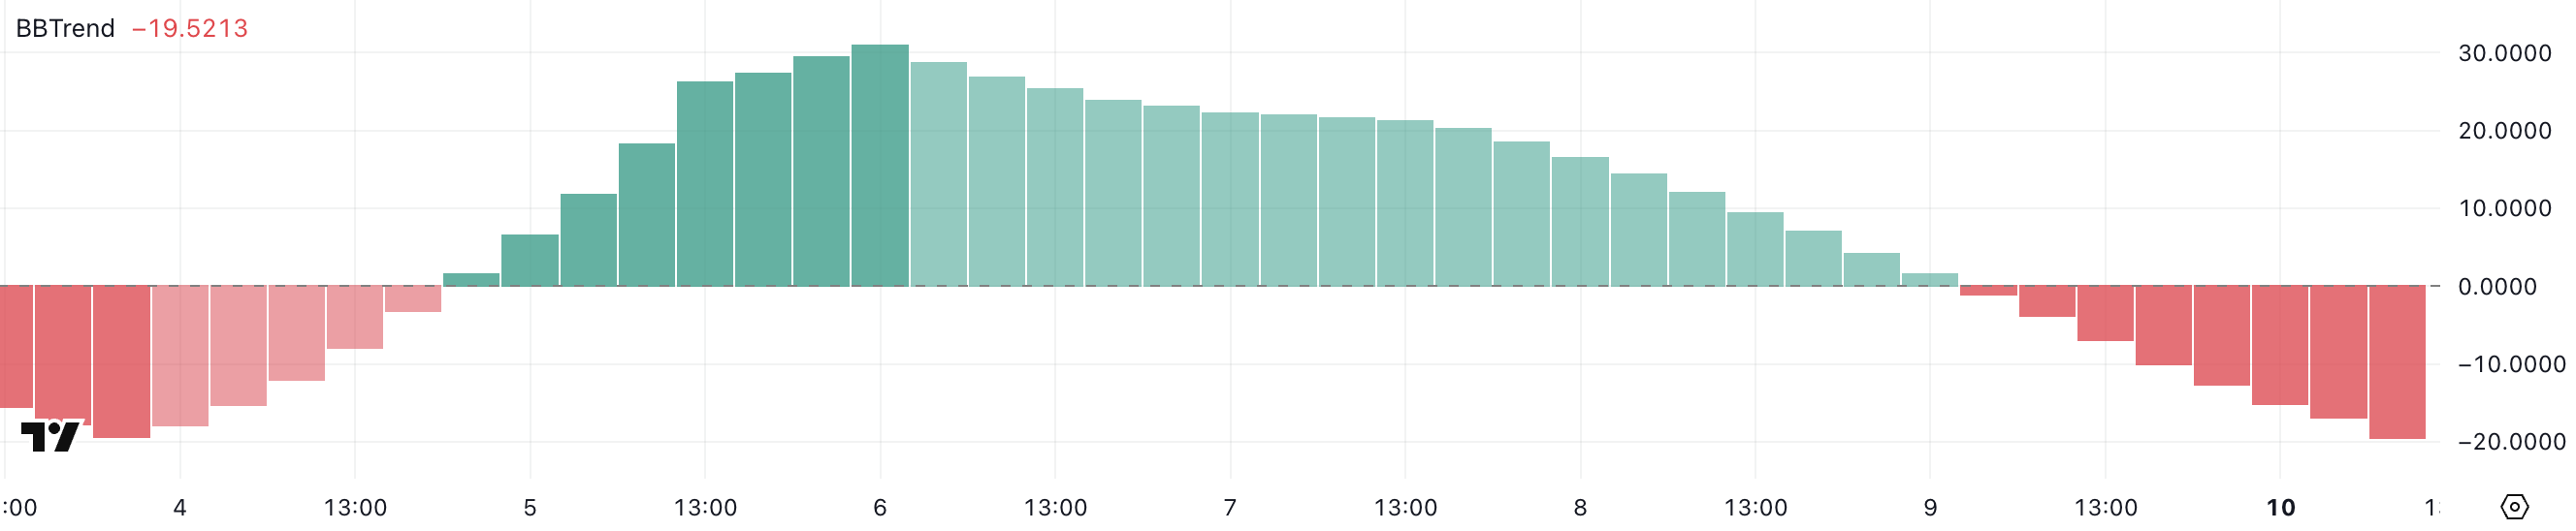
BBTrend, or Bollinger Band Trend, is an indicator that measures price trends based on Bollinger Bands. It shows whether an asset is in a strong, bullish, or bearish phase. When BBTrend is positive, it suggests strong upward momentum, while negative values indicate growing selling pressure.
With ADA’s BBTrend now at -19.52, it signals increasing bearish sentiment, suggesting the price could continue declining unless buyers step in. If the downtrend persists, ADA may test key support levels in the coming days.
Cardano DMI Shows Sellers Are Still In Control
Cardano Directional Movement Index (DMI) chart shows that its Average Directional Index (ADX) has risen to 34.5, up from 26.6 yesterday. This increase suggests that ADA’s current trend – whether bullish or bearish – is gaining strength.
Given that ADA is in a downtrend, the rising ADX indicates that selling pressure is intensifying, making it more difficult for the price to reverse in the short term.
ADX measures the strength of a trend on a scale from 0 to 100, with values above 25 indicating a strong trend and above 50 suggesting an extremely strong trend.
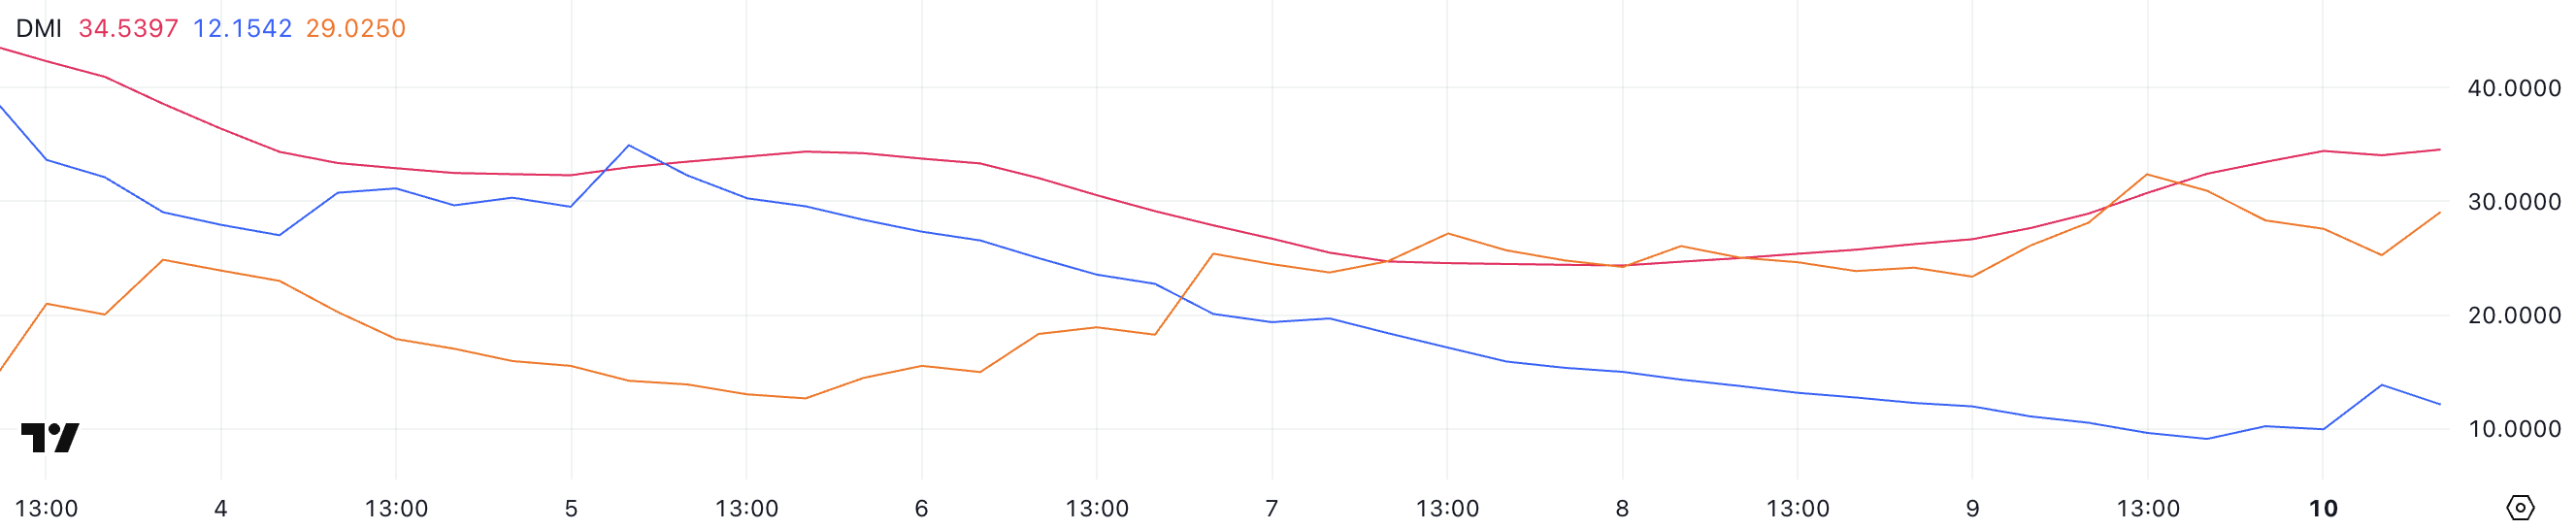
Meanwhile, ADA’s +DI (positive directional index) has climbed to 12 from 9.6 yesterday but is slightly down from 13.8 a few hours ago, indicating weak bullish attempts.
At the same time, -DI (negative directional index) is at 29, lower than yesterday’s 32.3 but rising from 25.2 a few hours ago.
This suggests that while sellers still control the trend, some short-term pullbacks are occurring. If -DI remains dominant and ADX continues rising, ADA’s downtrend could extend further.
Will Cardano Fall Below $0.60?
Cardano EMA lines indicate that a potential death cross could form soon, signaling a bearish momentum.
A death cross occurs when a short-term EMA crosses below a longer-term EMA, often leading to increased selling pressure.
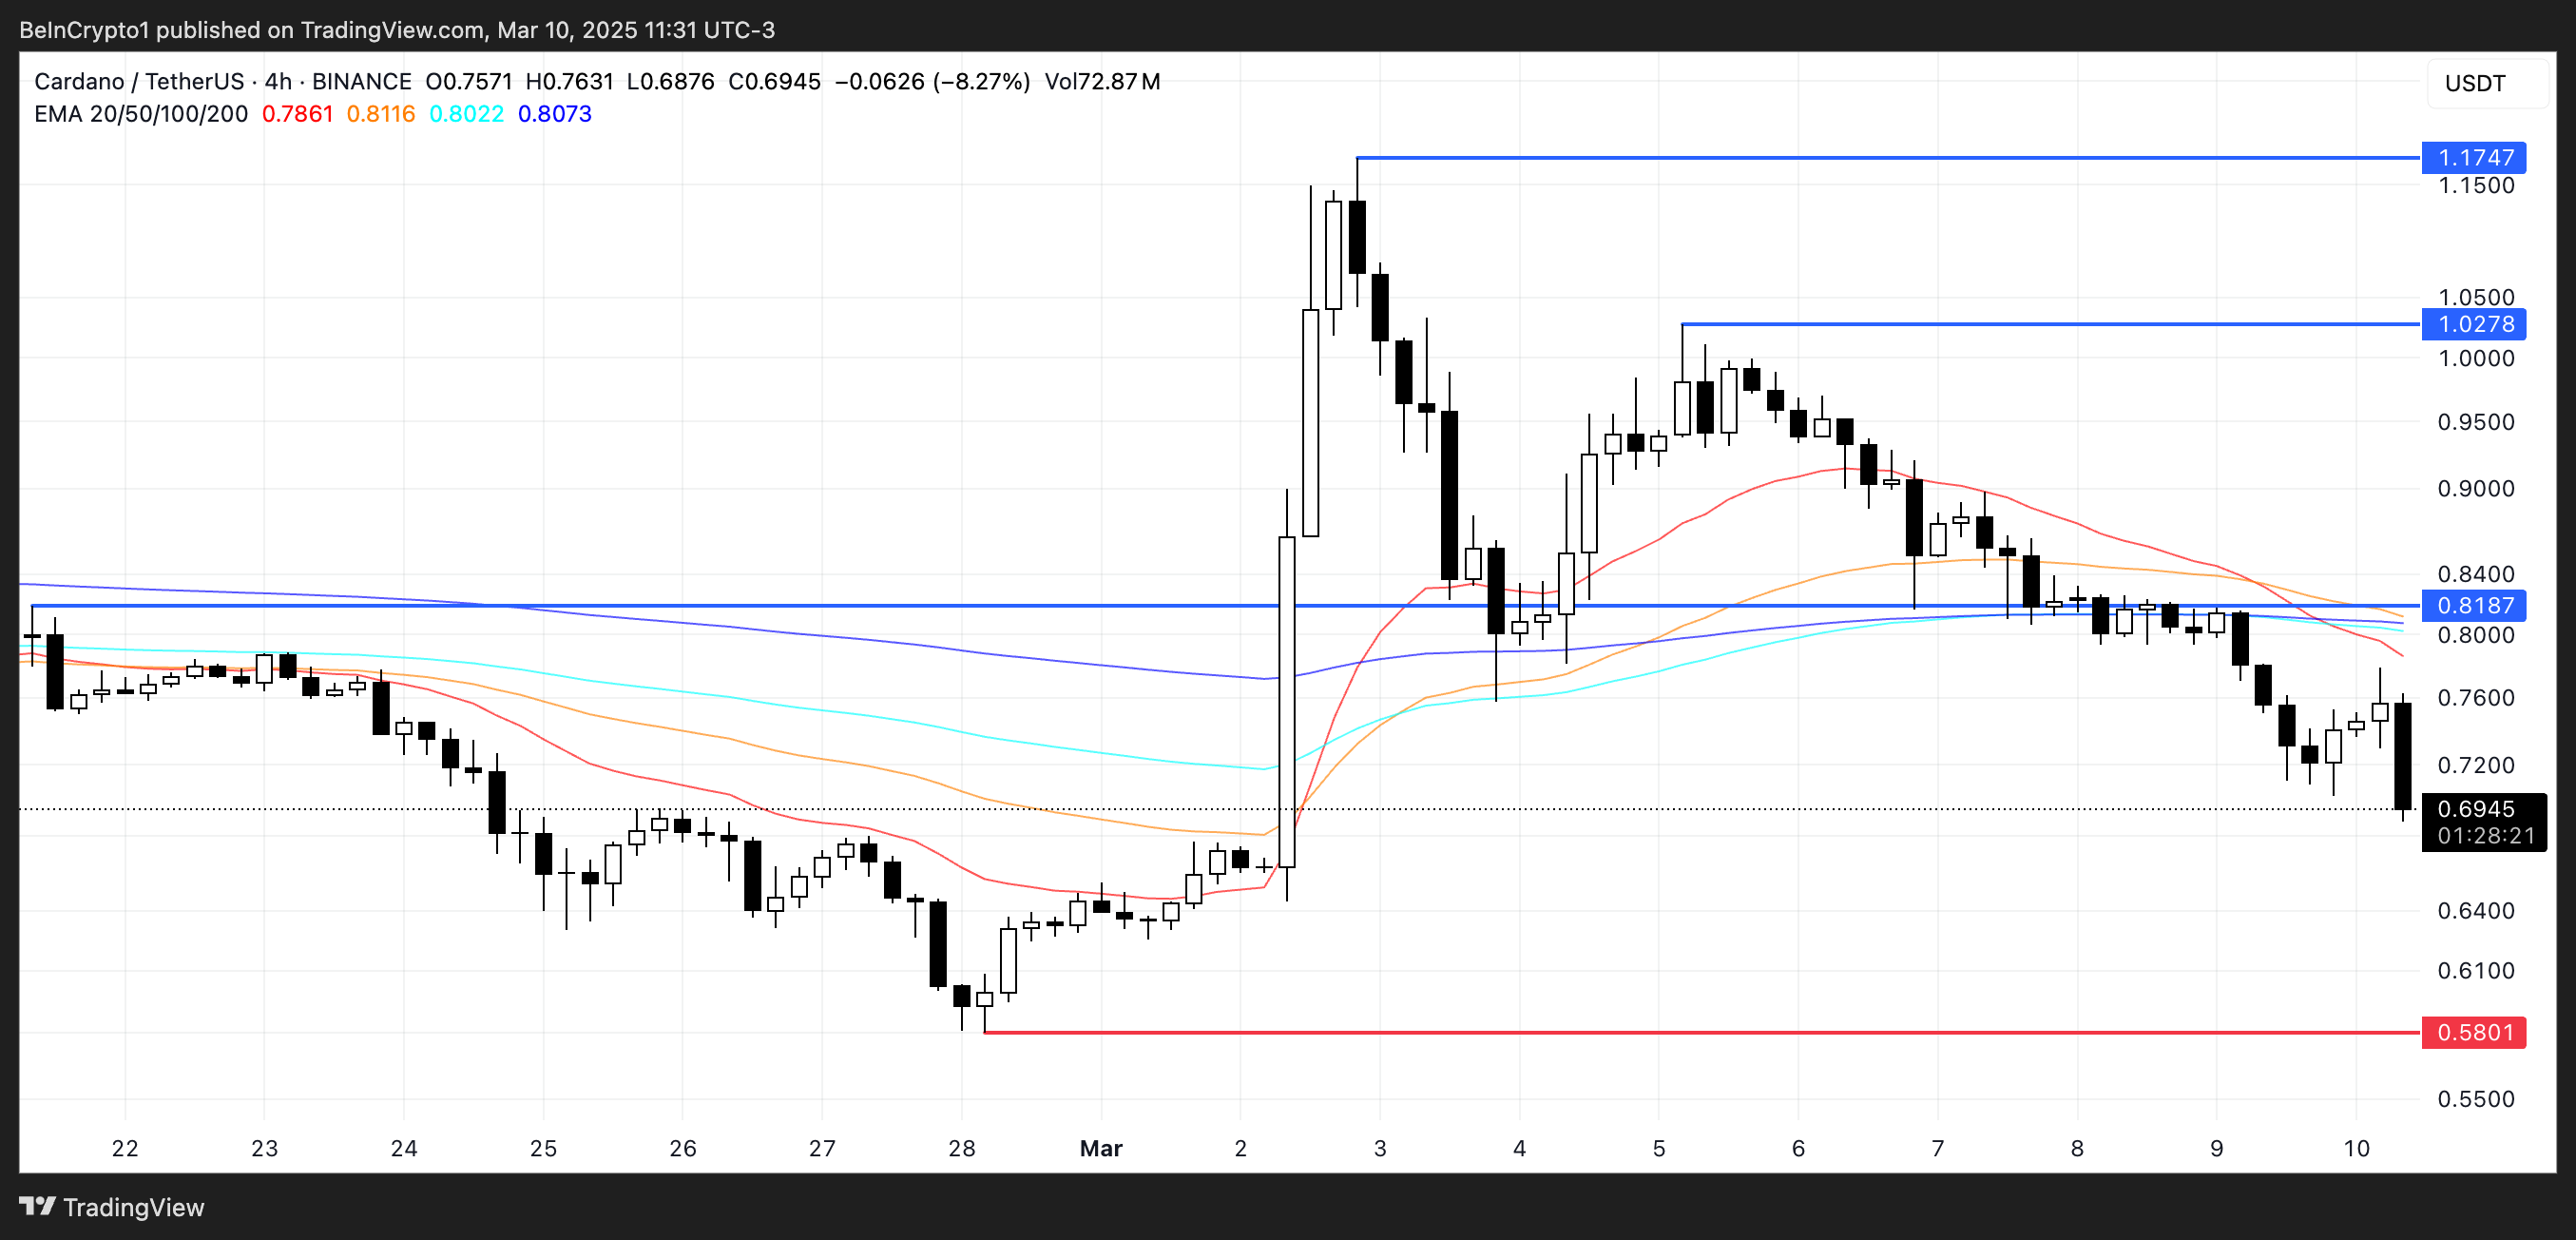
If this bearish crossover happens, ADA price could decline further, with the $0.58 support level becoming a key area to watch. A breakdown below this level could trigger even deeper losses.
However, if buyers regain control and ADA can reverse its trend, the price may rise toward the $0.818 resistance level. A breakout above that could open the door for further gains toward $1.02 and even $1.17 if momentum strengthens.
Disclaimer
In line with the Trust Project guidelines, this price analysis article is for informational purposes only and should not be considered financial or investment advice. BeInCrypto is committed to accurate, unbiased reporting, but market conditions are subject to change without notice. Always conduct your own research and consult with a professional before making any financial decisions. Please note that our Terms and Conditions, Privacy Policy, and Disclaimers have been updated.

Hedera (HBAR), Chainlink (LINK), Aptos (APT), Ondo Finance (ONDO), and Story (IP) are five of the most important Made in USA cryptos to watch this week. While IP has been the best-performing of the group in the last month, it is now undergoing a sharp correction, similar to ONDO, which has dropped over 22% in the past seven days.
Meanwhile, speculation is growing that HBAR and LINK could potentially be included in the U.S. strategic crypto reserve, which could impact their prices. With key support and resistance levels approaching, the coming days will determine whether these coins can regain bullish momentum or face further downside.
Hedera (HBAR)
Hedera is currently among the top 10 largest Made in USA cryptos by market cap, and there is growing speculation that it could be considered for inclusion in the U.S. strategic crypto reserve.
Despite this, HBAR has struggled in the past week, dropping 16.7% as its market cap hovers around $8.8 billion. The recent downturn has raised concerns about whether it can regain bullish momentum or continue facing selling pressure.
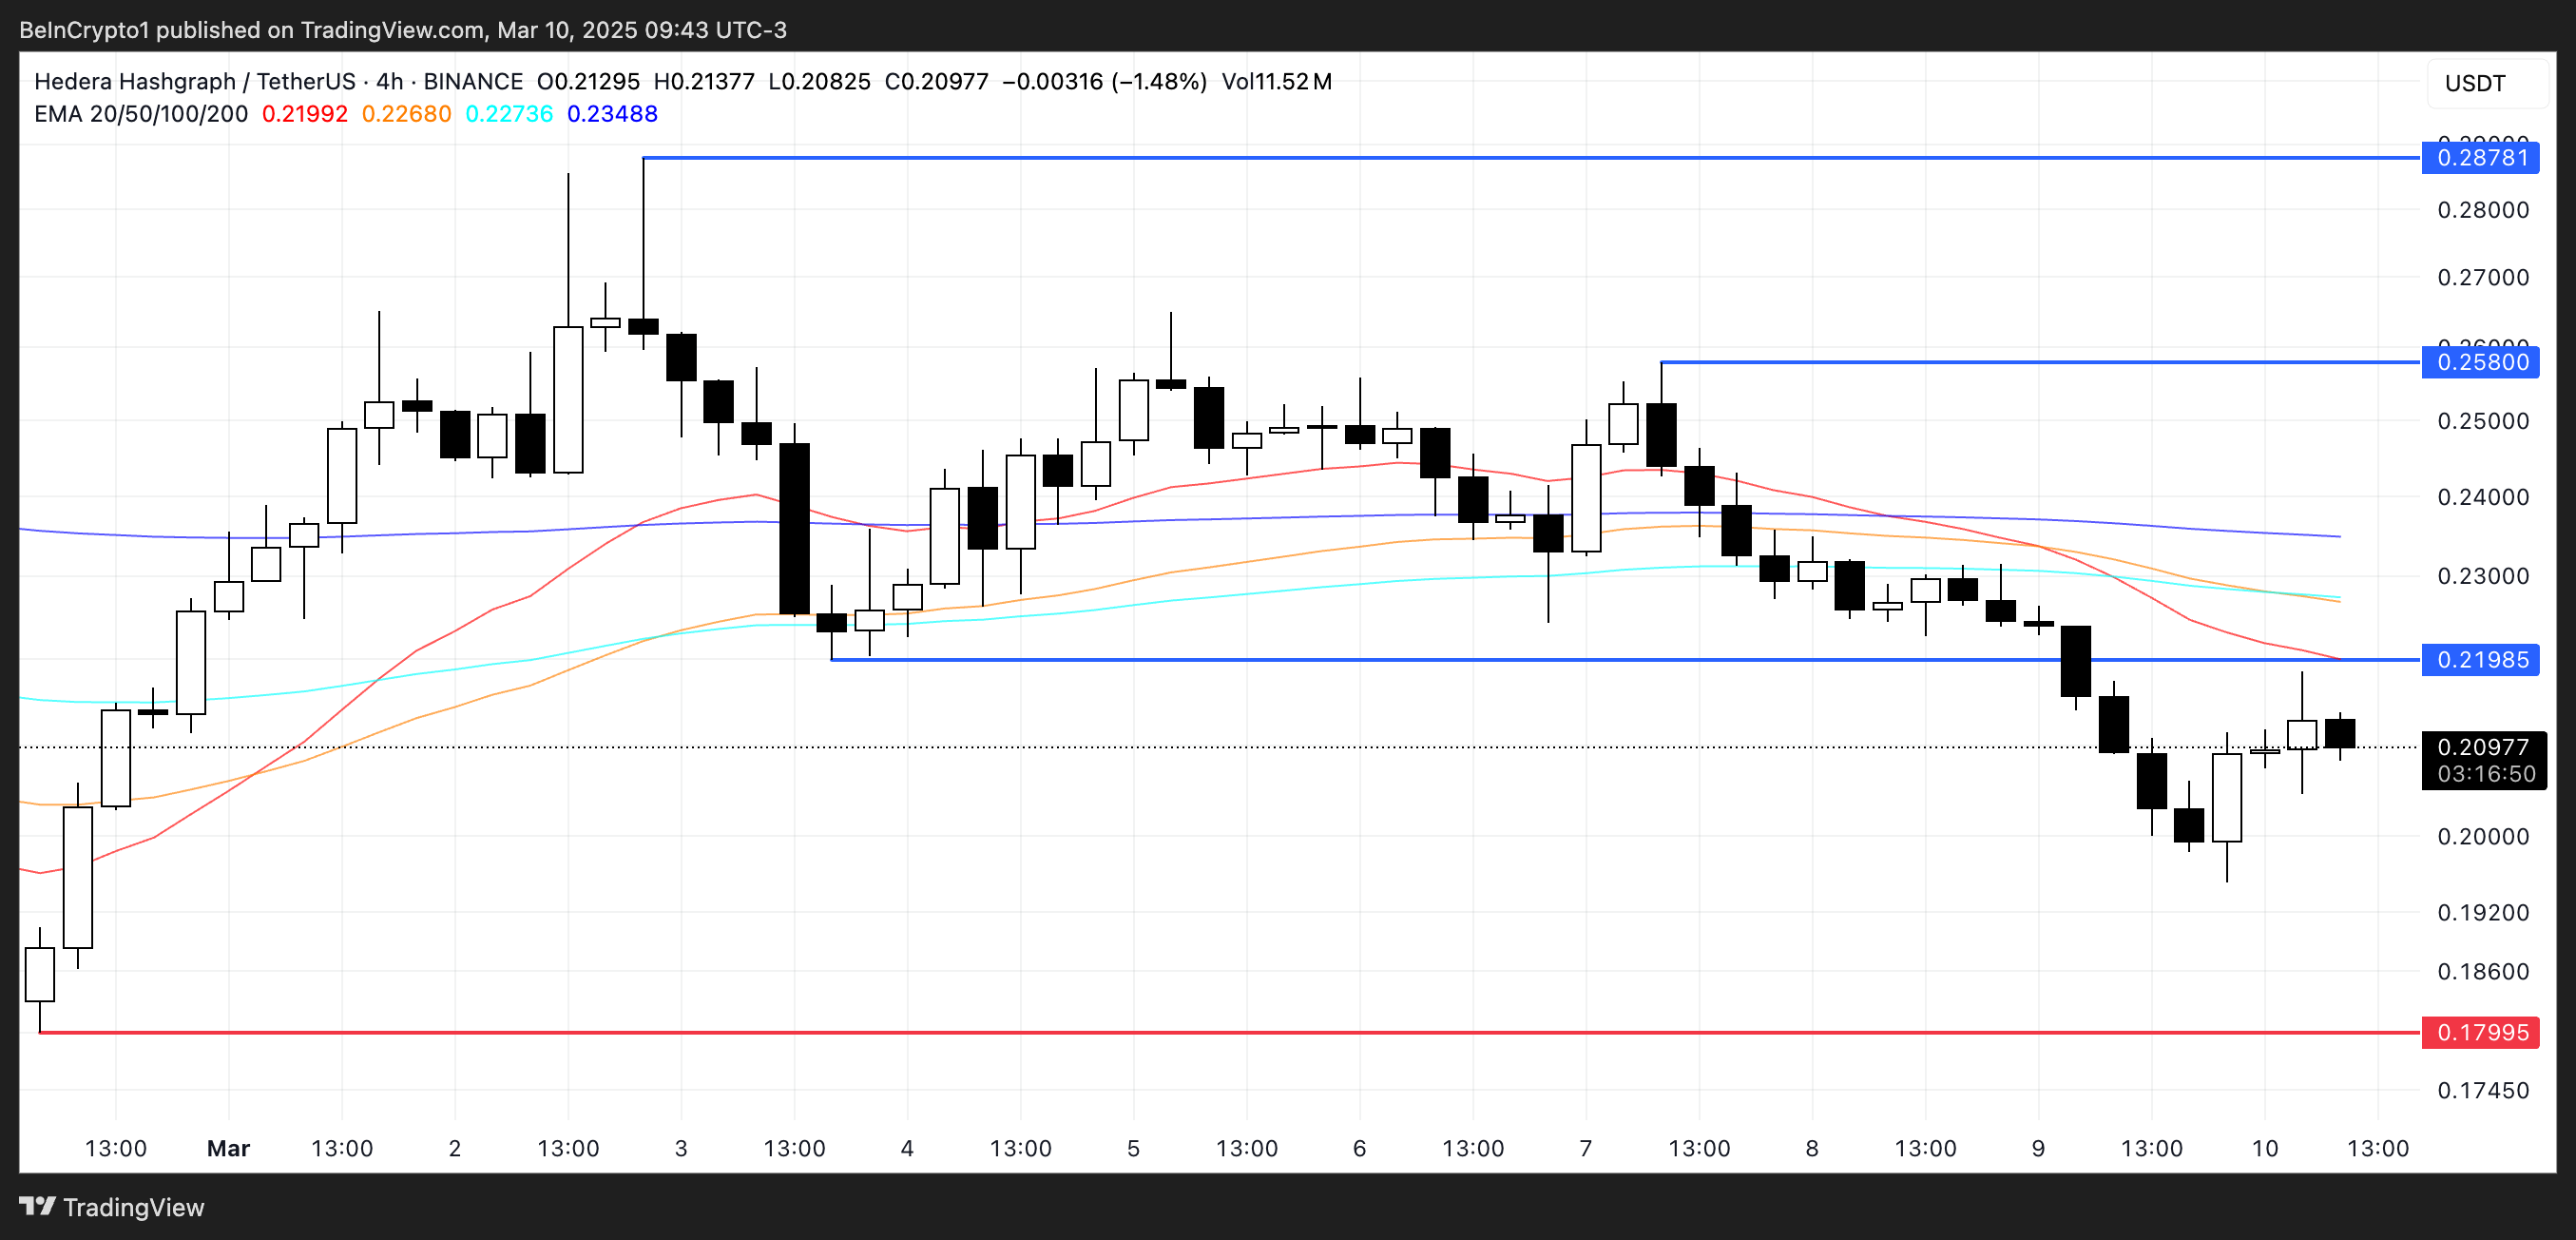
If HBAR can establish an uptrend, it could look to test key resistance levels at $0.219 and $0.258, with a stronger rally potentially pushing it toward $0.287. However, if the current price retracement deepens, it may face additional downside risk.
The $0.179 level stands out as a critical support area, where a breakdown could signal further losses. Whether HBAR can recover or extend its decline will depend on its ability to attract renewed buying interest.
Chainlink (LINK)
Chainlink is a dominant force in the oracle sector and has been expanding its presence in real-world assets (RWA), solidifying its importance in blockchain infrastructure.
Its key role in these industries strengthens the case for its potential inclusion in the U.S. strategic crypto reserve, alongside XRP and Solana.
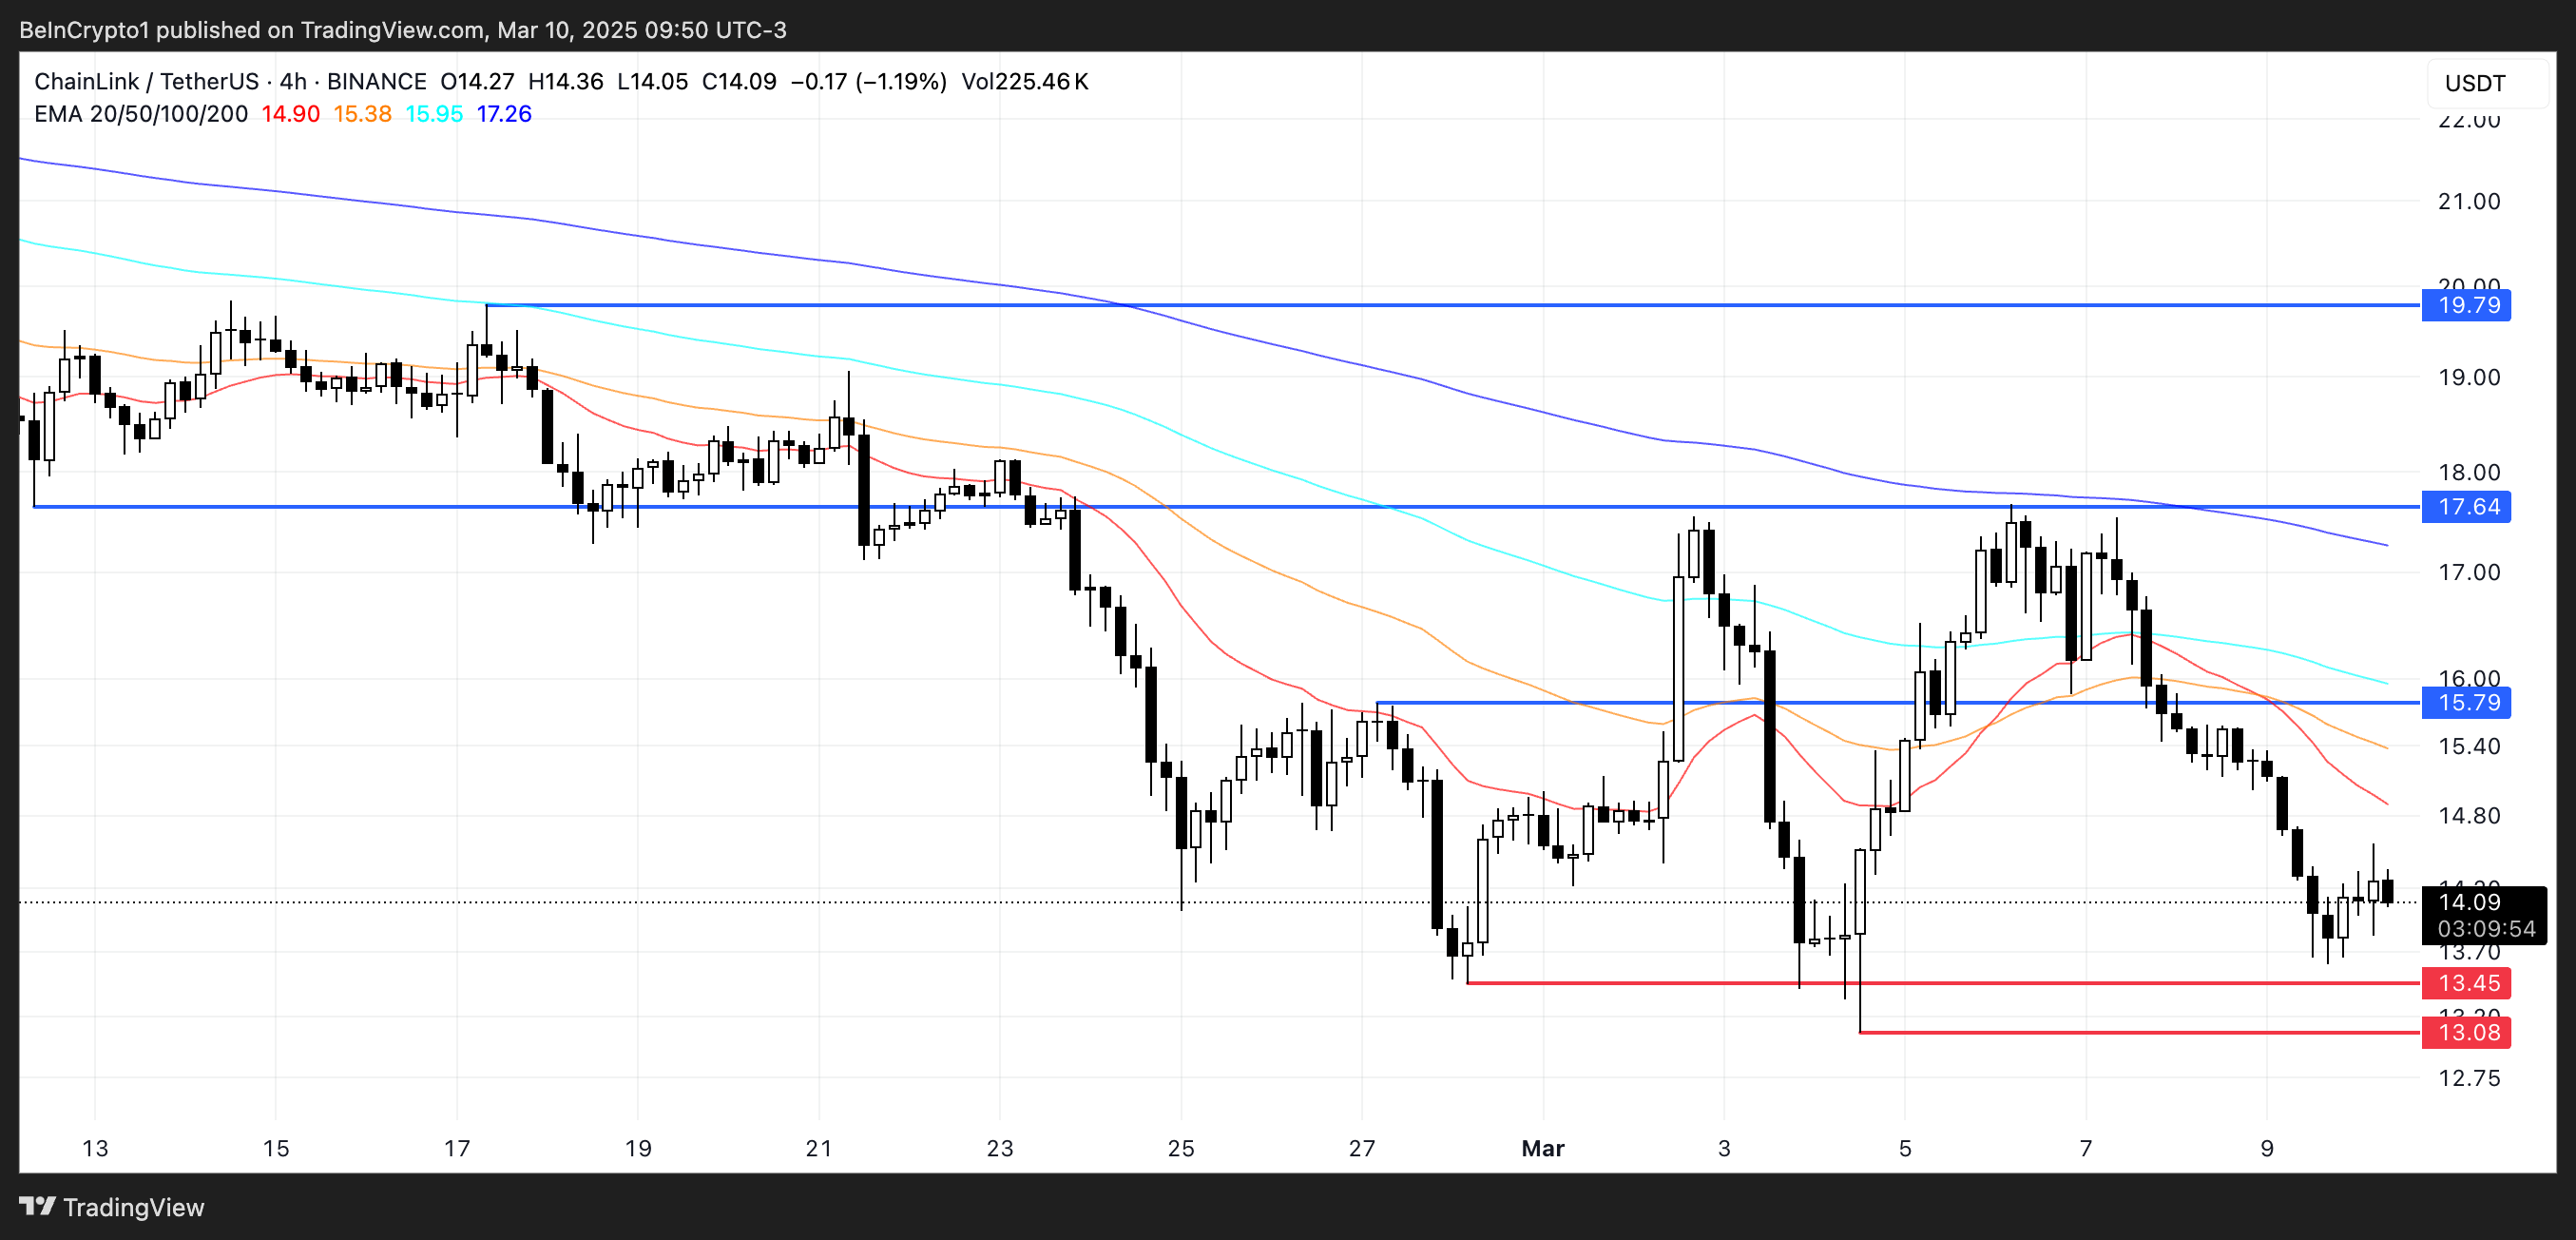
A potential inclusion could push LINK toward key resistance at $15.79, with further upside targeting $17.64 and $19.79 if momentum continues.
However, if market conditions turn bearish, LINK may retest support at $13.45, with the risk of further declines toward $13 or lower.
Aptos (APT)
Aptos has been one of the most hyped new layer-1 blockchains in recent years, and speculation about a potential ETF has fuelled discussions over the past week.
Despite this, APT has struggled, dropping nearly 12% in the last seven days. The recent downturn raises questions about whether it can regain bullish momentum or if further downside is ahead.
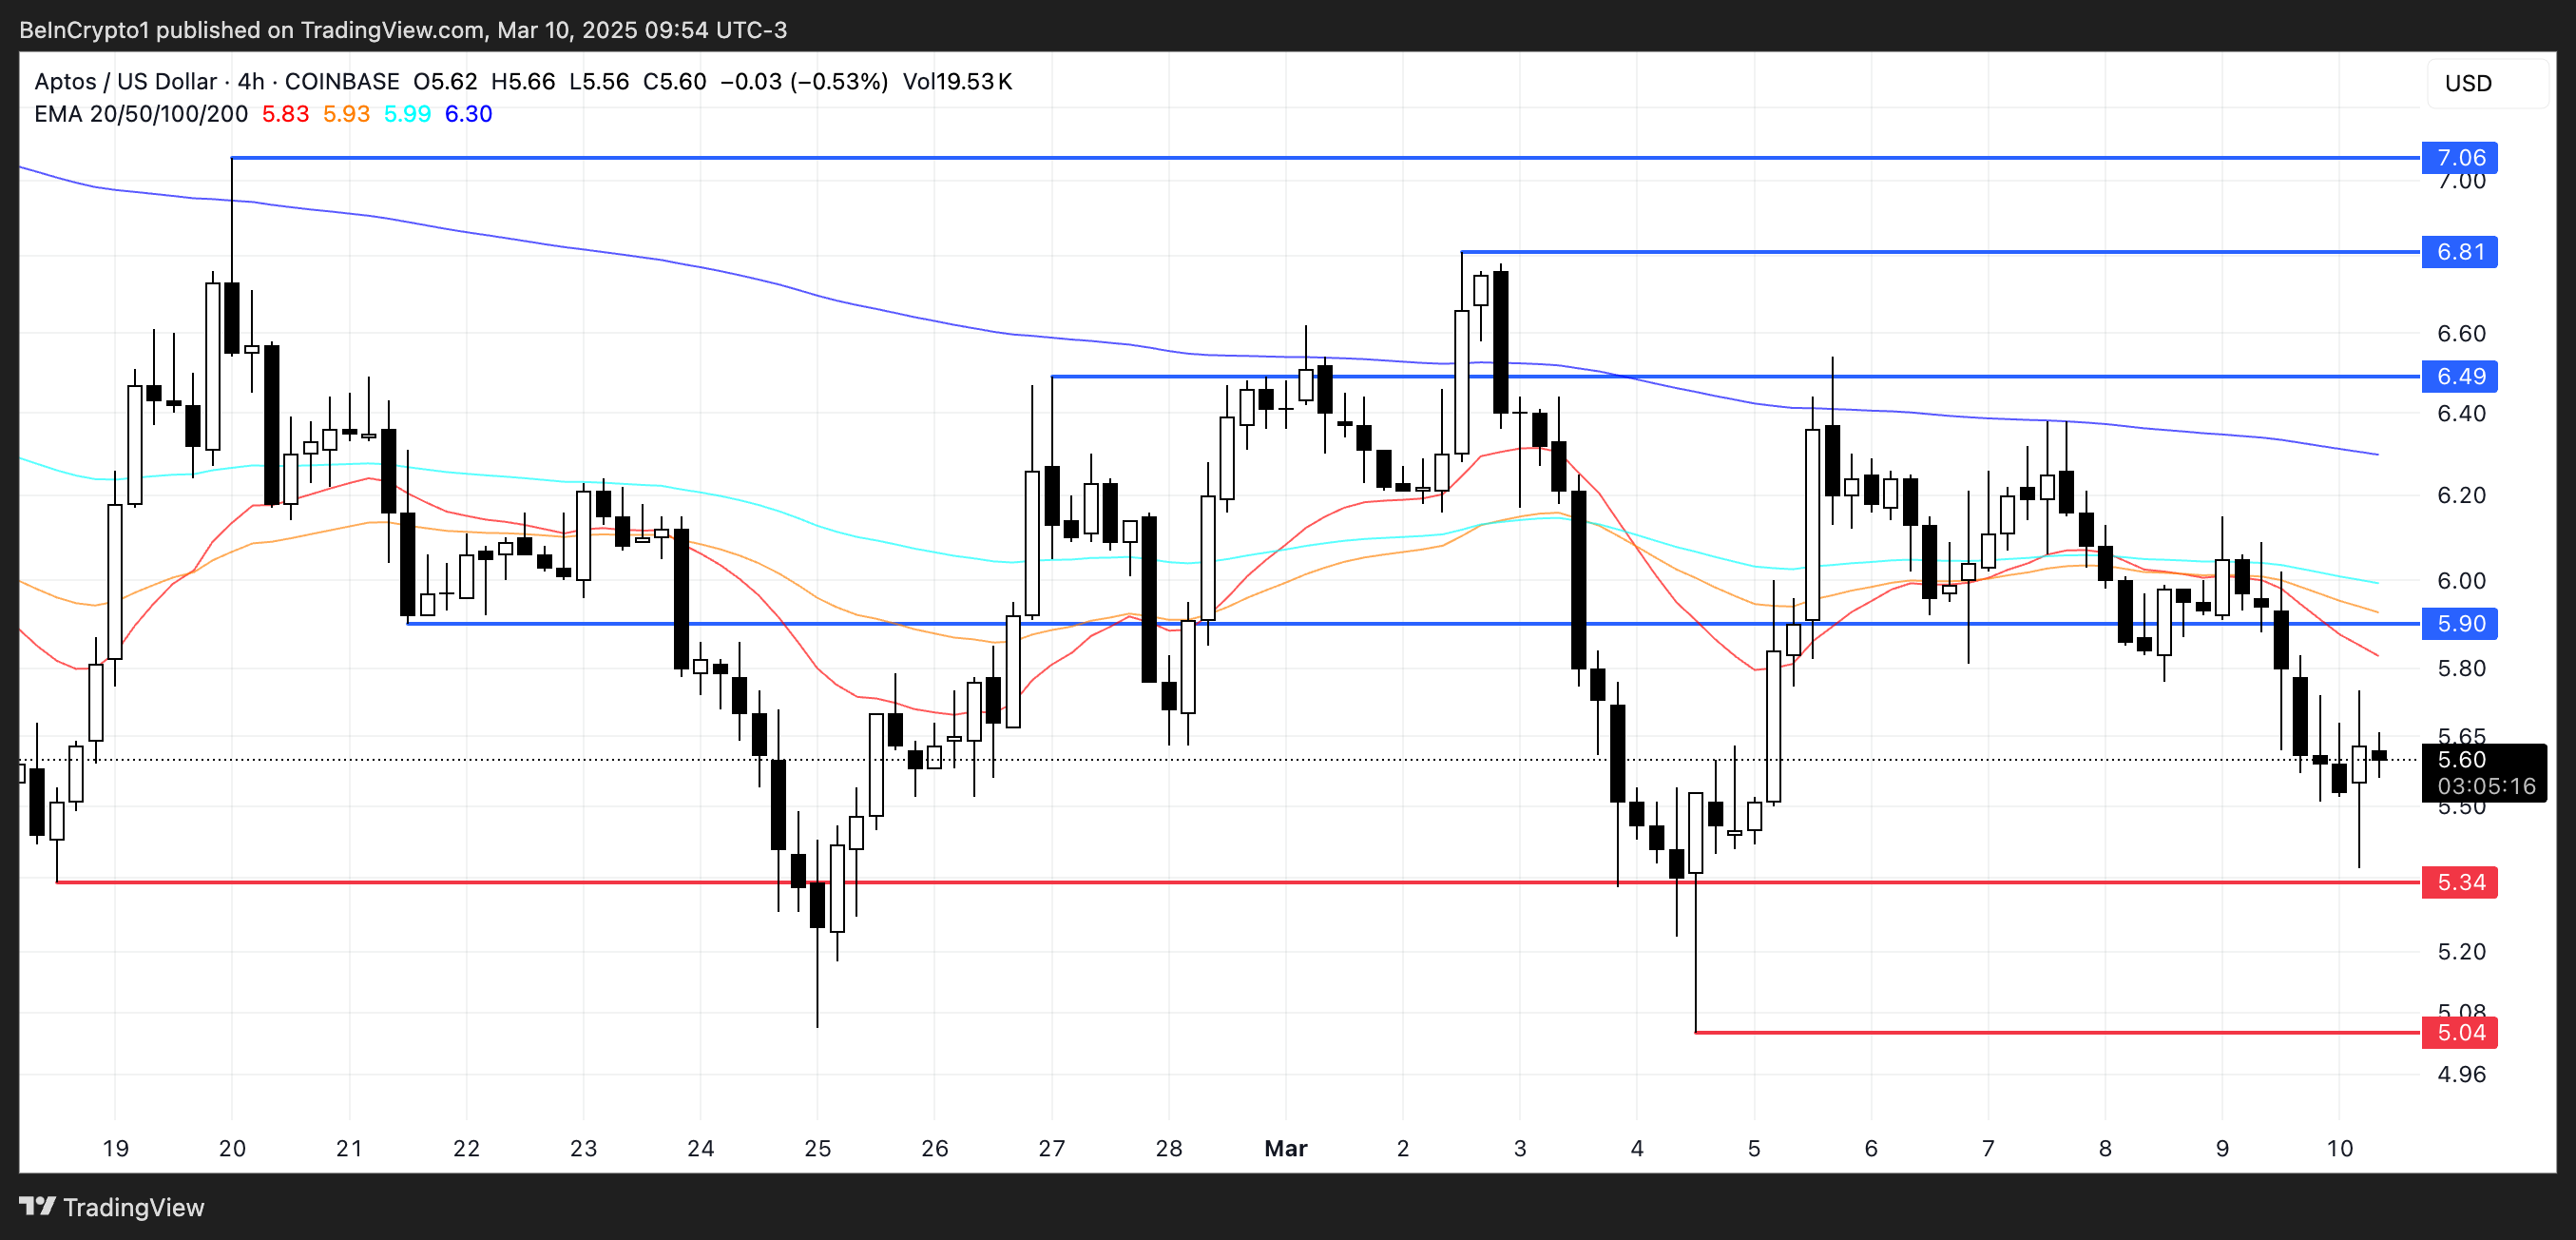
If the correction continues, APT could test support at $5.34, with a breakdown potentially sending it as low as $5.04. On the other hand, a reversal could see APT rising toward $5.90, with further resistance at $6.49.
If bullish momentum from previous months returns, APT could extend gains toward $6.81 or even $7.06. Whether it can turn the tide will depend on renewed buying interest and broader market conditions.
Ondo Finance (ONDO)
ONDO has dropped 22% in the last seven days, but it remains one of the most relevant real-world asset (RWA) tokens in the market. Despite the correction, its market cap still hovers around $2.8 billion, reflecting its strong position in the sector.
The recent pullback has put pressure on ONDO, raising questions about whether it can regain momentum or if further downside is ahead.
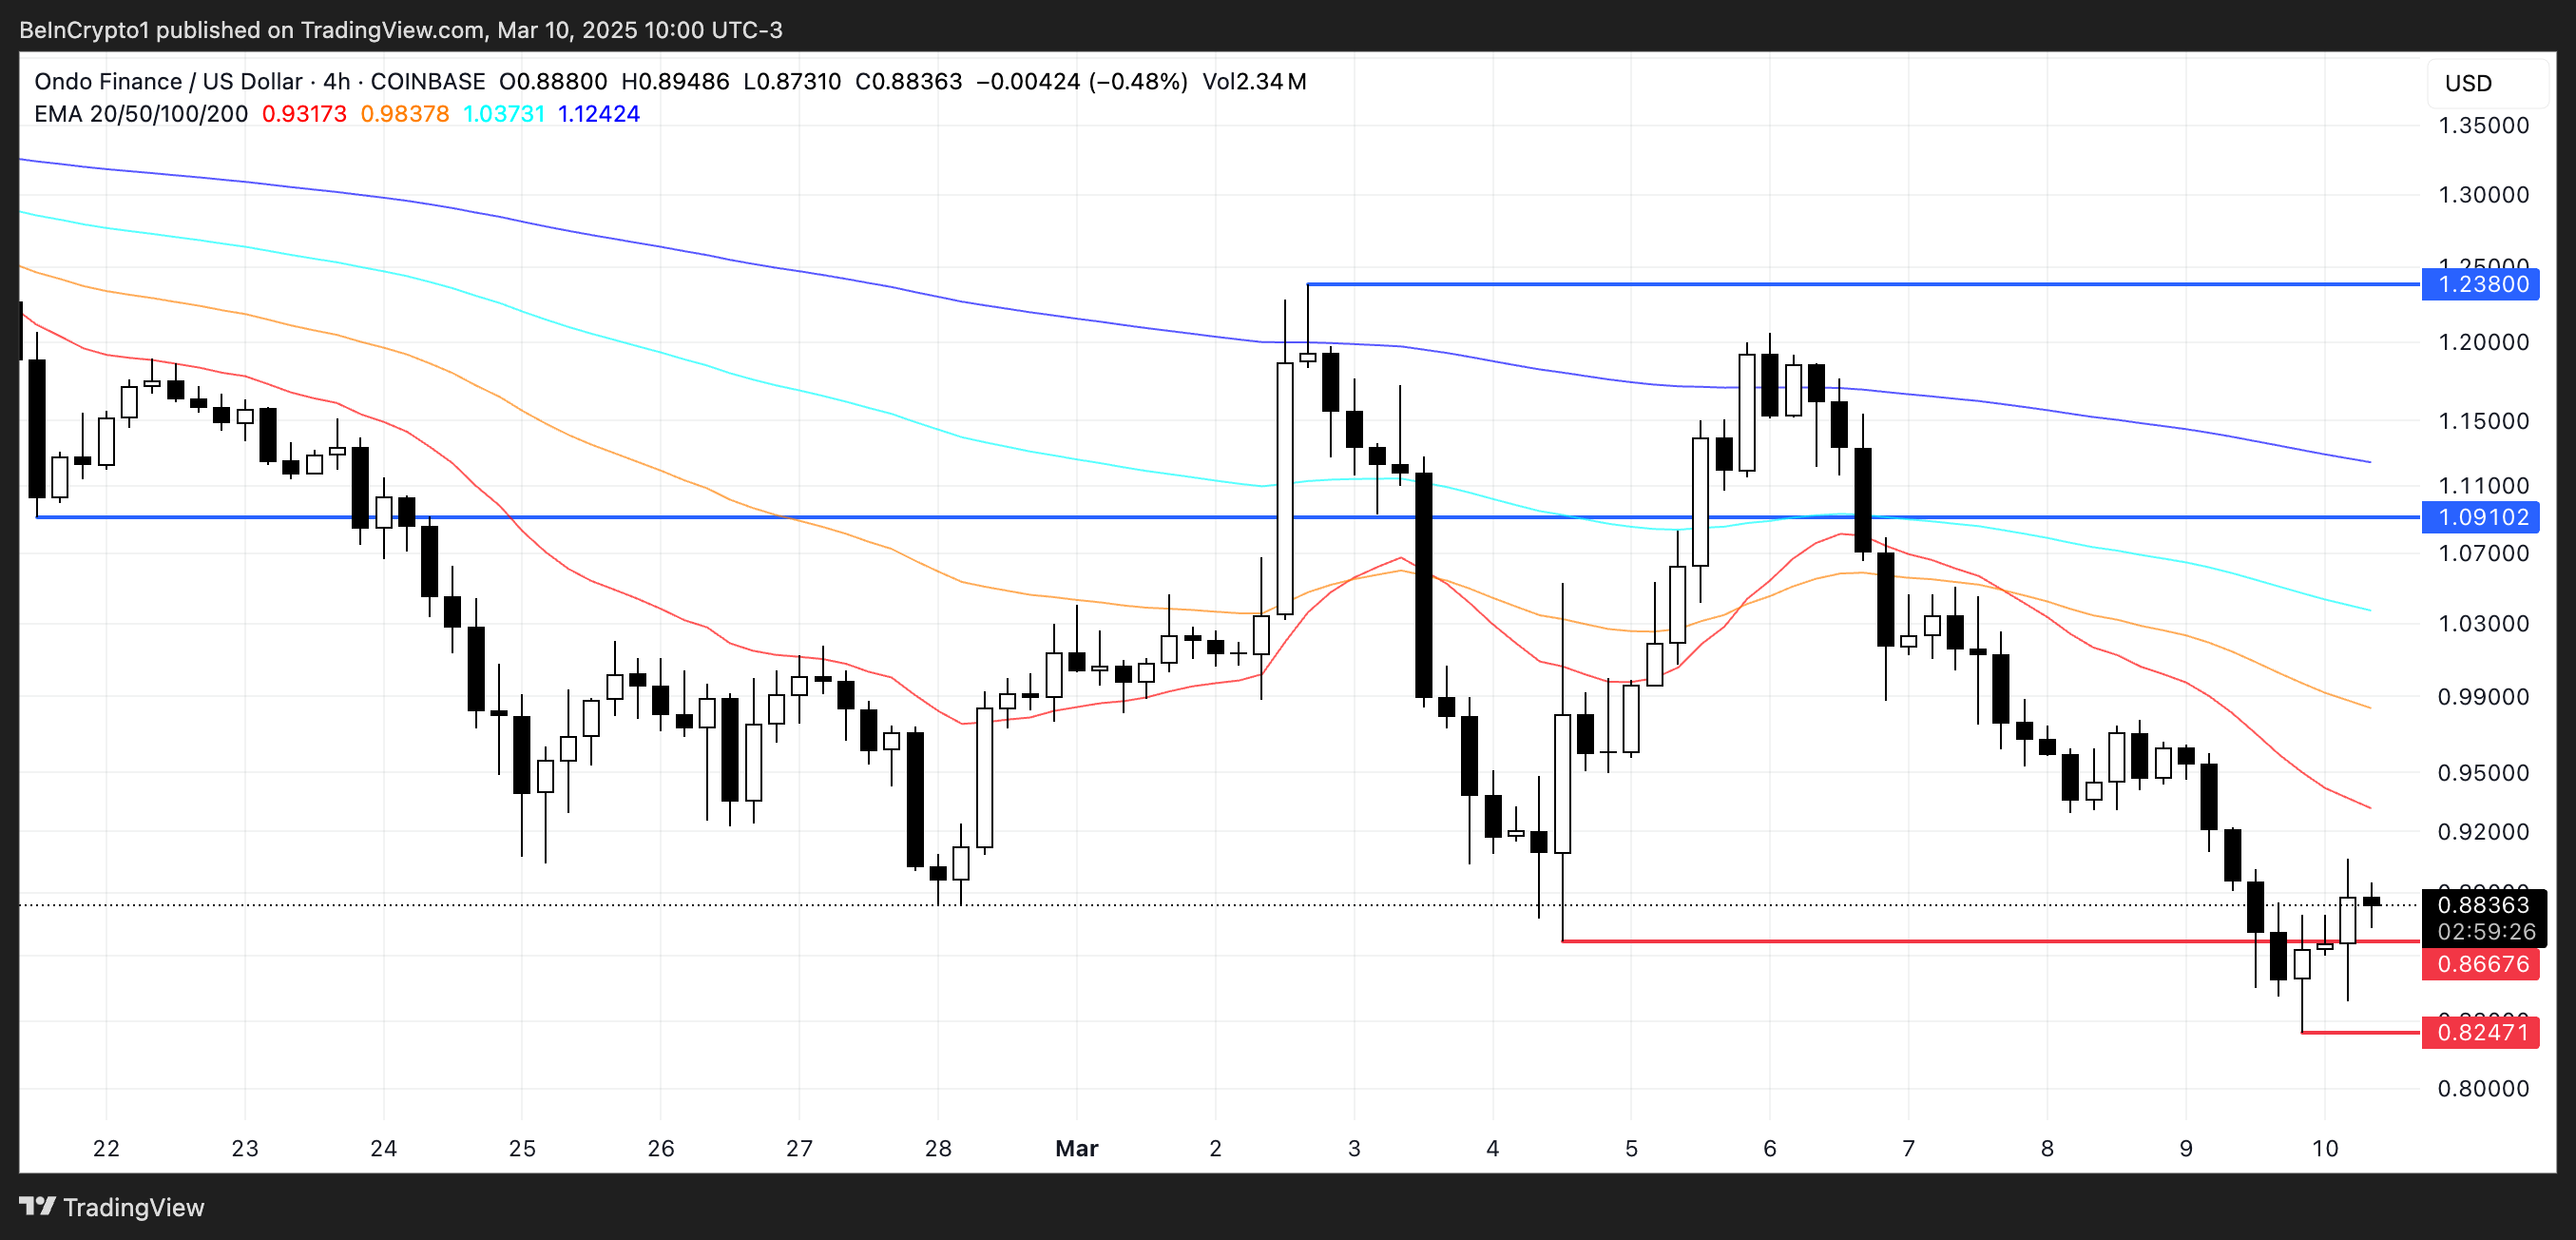
If the decline continues, ONDO could test support at $0.866, with a breakdown potentially sending it as low as $0.82.
On the upside, a recovery in momentum and renewed interest in RWA coins could push ONDO toward the $1.09 resistance level. If bullish momentum strengthens further, it could climb to $1.23
Story (IP)
IP has been one of the best-performing Made in USA cryptos, surging 77% in the last 30 days and standing out among top altcoins.
Despite its strong overall performance, IP has experienced a 19% correction over the past week, bringing its market cap to $1.27 billion.
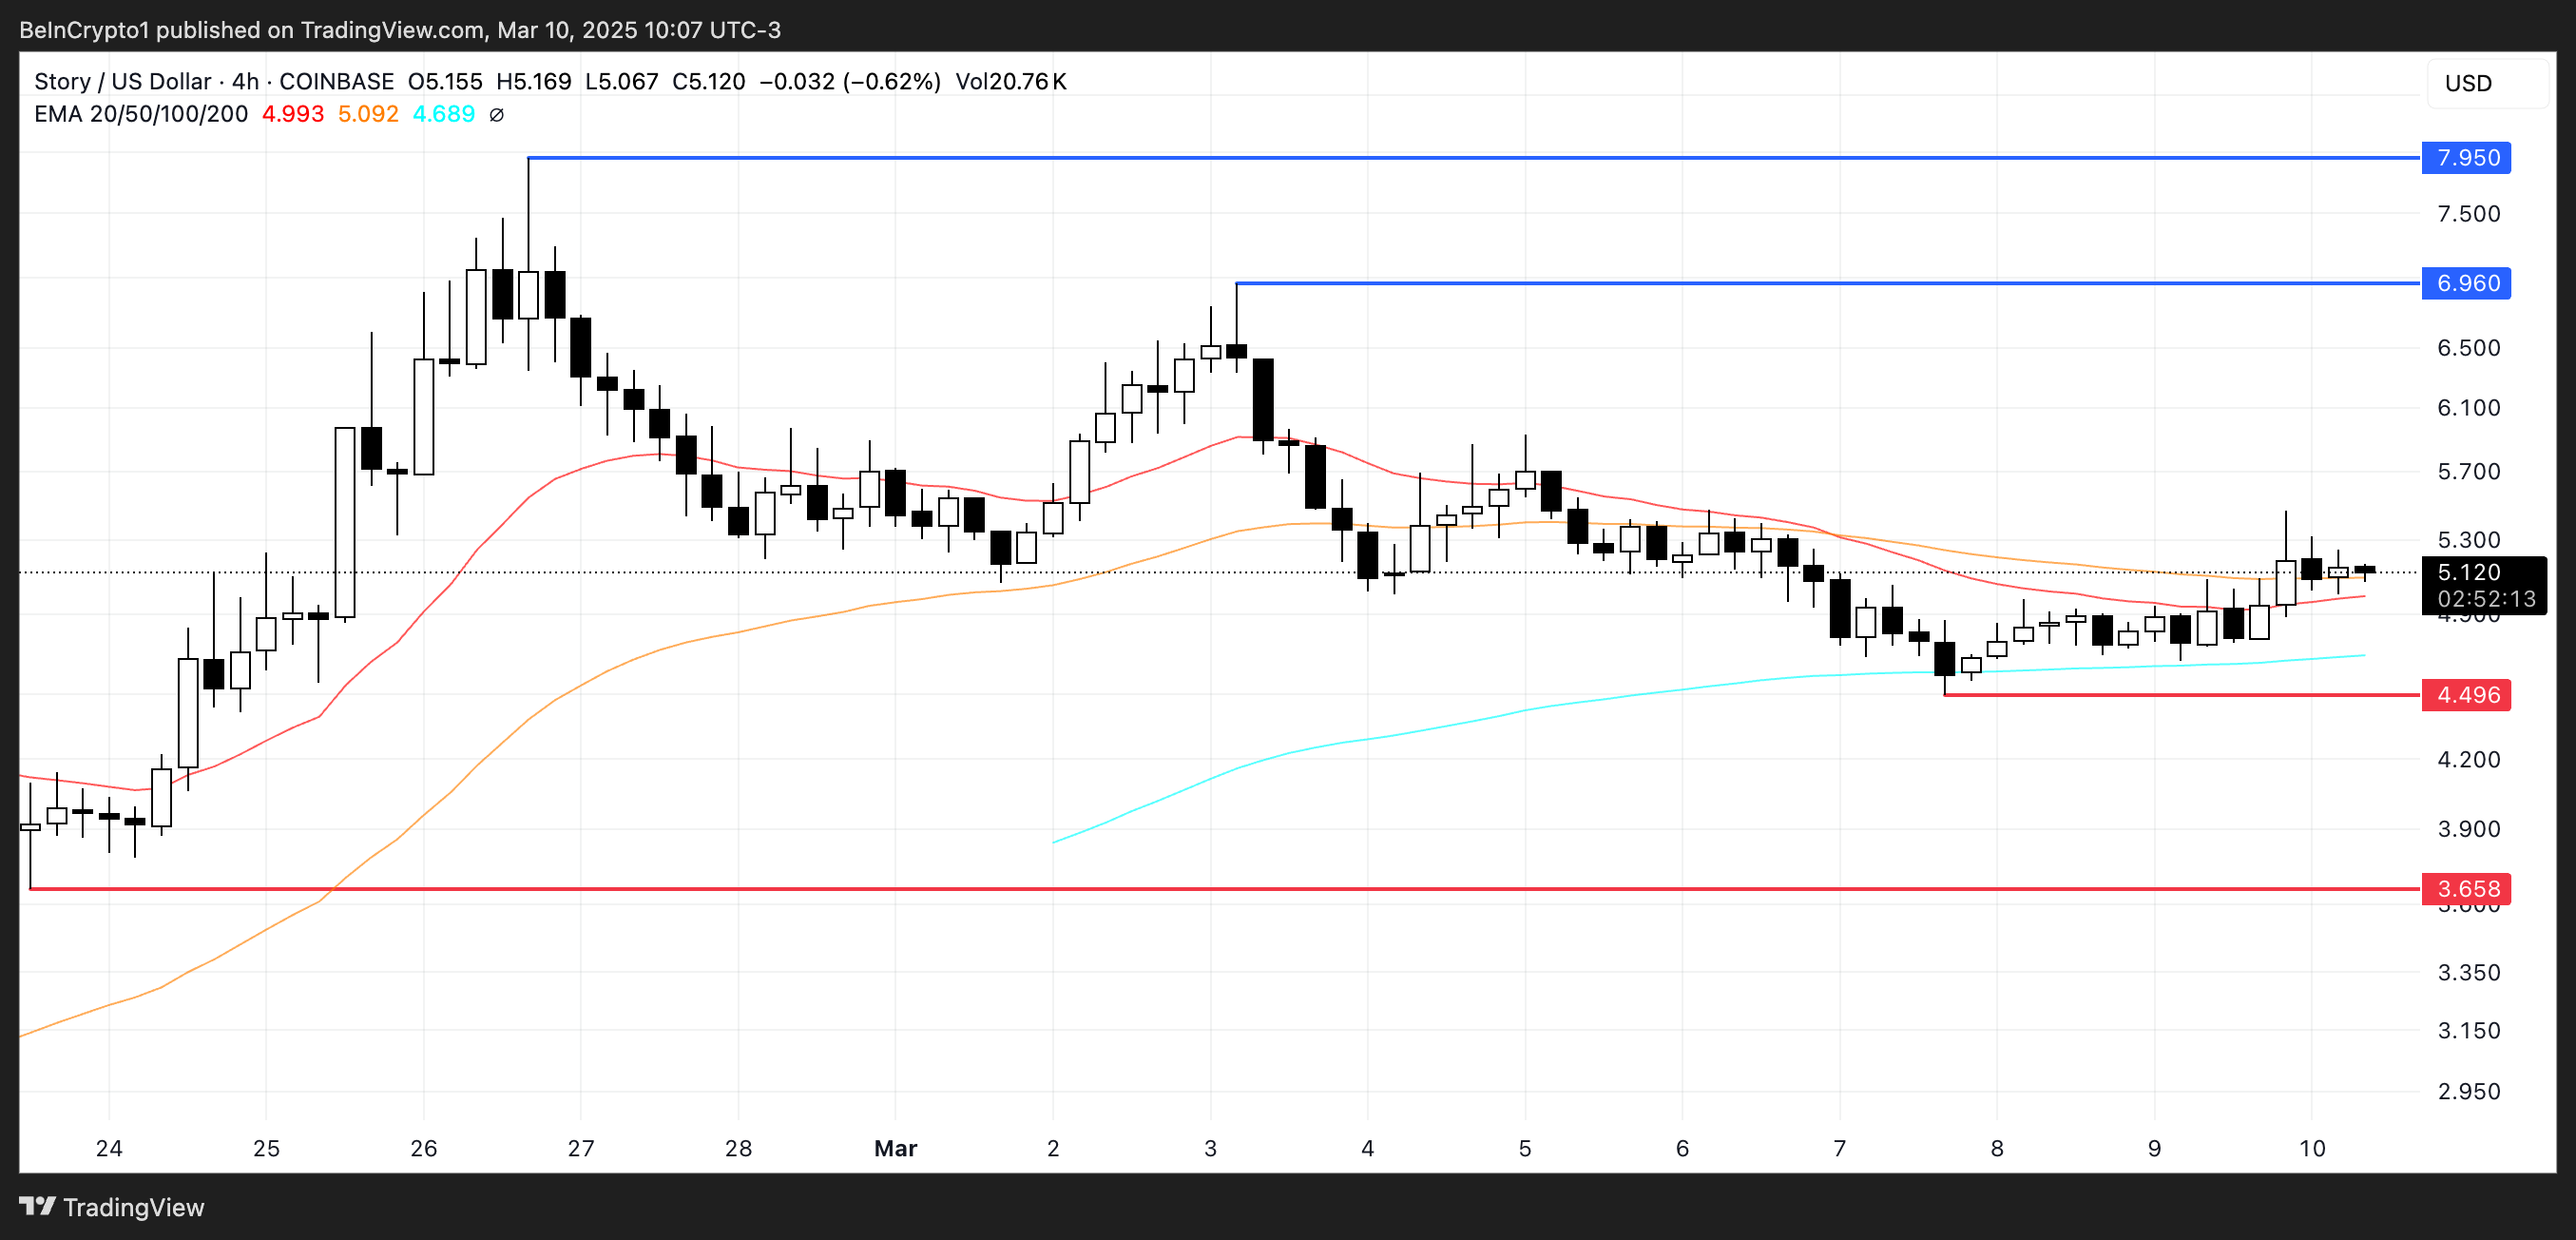
If IP can recover its strength from last month, it could rise toward $6.96 and potentially test $7.95, with the possibility of breaking above $8 for the first time, making it one of the most important Made in USA cryptos.
However, if the current downtrend intensifies, the price may test support at $4.49, and a further breakdown could push it as low as $3.65.
Disclaimer
In line with the Trust Project guidelines, this price analysis article is for informational purposes only and should not be considered financial or investment advice. BeInCrypto is committed to accurate, unbiased reporting, but market conditions are subject to change without notice. Always conduct your own research and consult with a professional before making any financial decisions. Please note that our Terms and Conditions, Privacy Policy, and Disclaimers have been updated.

Pi Network (PI) at Risk – Could It Drop Below $1 in March?

Cardano (ADA) Drops 39% After US Crypto Reserve Listing

Top 5 Made in USA Cryptos to Watch This Week

Top 3 Cryptos Smart Money Wallets Are Buying After the Crash

Ethereum Price Maintains Movement Inside Ascending Triangle, Is Another Crash Coming?

SEC Drops Rule Targeting Crypto Exchanges, Shifts Approach

2.52 Million Altcoins Are Ruining Crypto’s Future

Animoca Brands Valuation Tanks 75% In Two Years, Here’s Why

Crypto exchange BingX hacked for $43 million

Are The Big Players Losing Interest?

Hong Kong’s Securities Association Tips Authorities On Crypto Self-Regulation

Coinbase cbBTC Set to go Live on Solana
2.52 Million Altcoins Are Ruining Crypto’s Future
Animoca Brands Valuation Tanks 75% In Two Years, Here’s Why
Crypto exchange BingX hacked for $43 million
Are The Big Players Losing Interest?
Hong Kong’s Securities Association Tips Authorities On Crypto Self-Regulation
Coinbase cbBTC Set to go Live on Solana
-

 Market18 hours ago
US Economic Data Looms, Bitcoin Braces for Volatility
-

 Bitcoin17 hours ago
Trump Won’t Buy Bitcoin Until It Hits $60,000: Bitwise Exec
-
 Altcoin23 hours ago
Expert Reveals Why Bitcoin And Solana Have An Edge Over Ethereum
-

 Market21 hours ago
Bitcoin Price Dives Once More—Is a Deeper Correction Underway?
-

 Altcoin20 hours ago
BTC & Ether Prices Sink, Here’s Why
-

 Market19 hours ago
Pi Network Mainnet Woes: Pioneers Face Transfer Delays
-

 Market17 hours ago
$620 Million Liquidations Shake the Market
-
 Altcoin17 hours ago
Will Dogecoin Price See Strong Rebound After 270% Surge In Active Addresses?