
Market
Bitcoin Pepe maintains its shine as Bitcoin price bleeds further


Bitcoin season remains in play at an index of 14, as highlighted on CoinMarketCap. Even with heightened market volatility and revolutionary technologies like AI and Telegram gaming, BTC remains the most steady and reliable network. While it has dropped by about 20% since hitting its all-time high in late January, it is still 30% higher than it was a year ago.
Even so, savvy investors are increasingly looking for opportunities in the altcoins. More specifically, the meme culture has birthed numerous crypto millionaires. This is one of the reasons why revolutionary meme projects like Bitcoin Pepe are raising hefty figures in their first weeks of presale. Its adoption of the meme culture, coupled with the PEP-20 standard and layer-2 solution on the Bitcoin network places it on the list of crypto ICOs to watch in 2025.
Bitcoin ETFs record massive outflows as BTC price remains in the red
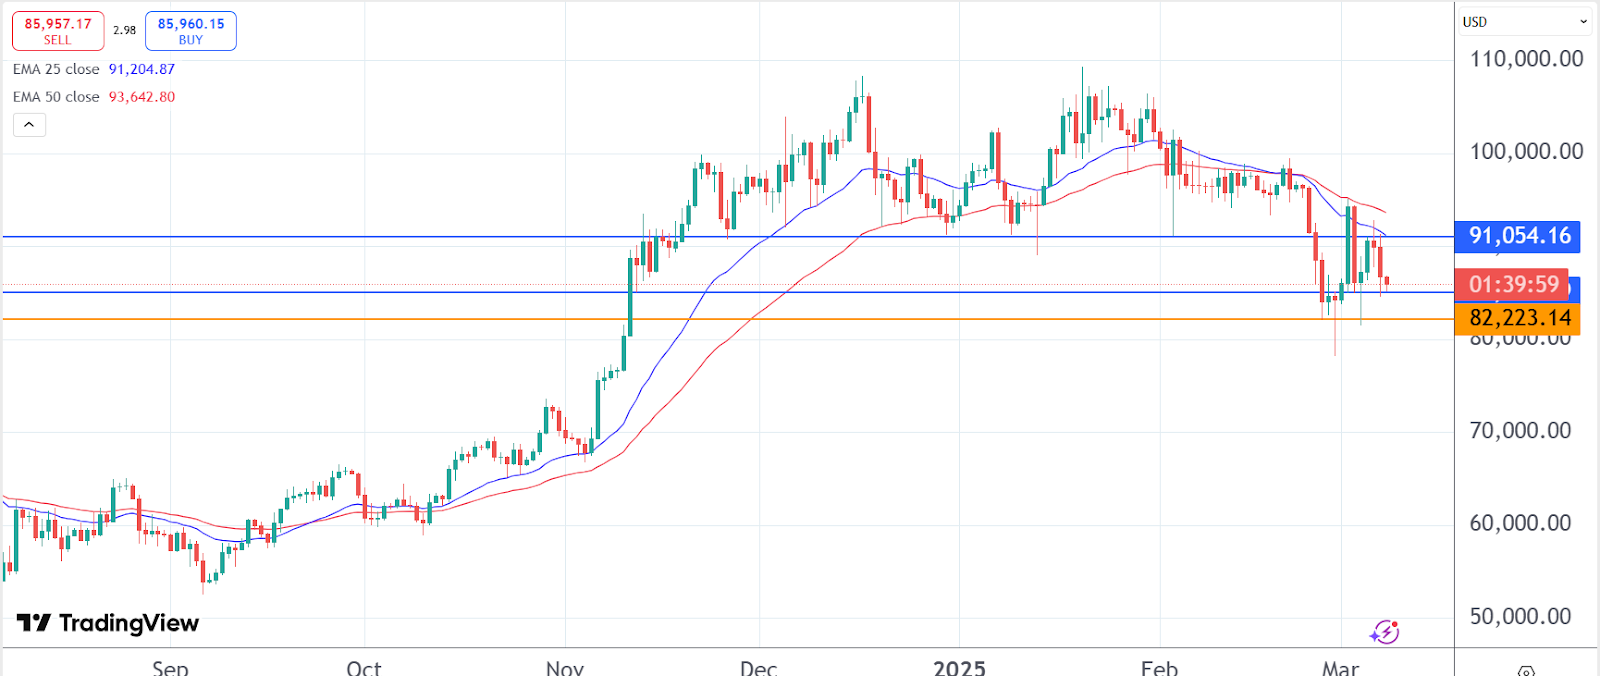
Bitcoin price is in the red for the second week in a row as the bulls strive to defend the support zone of $85,000. Since hitting its all-time high in late January 2025, it has dropped by over 20%; momentarily plunging below the crucial level of $80,000 a week ago.
Amid the selling pressure, Bitcoin ETFs recorded total net outflows of $409.21 million on 7th March as stated on SoSoValue. ARK 21Shares Bitcoin ETF and Fidelity Wise Origin Bitcoin Fund topped the list with daily net outflows of $160.03 million and $154.89 million respectively.
A look at its daily chart points to the continuation of the downtrend, atleast in the short term. More specifically, it will likely trade within the range of between $85,083 and the 25-day EMA of $91,054 for a while longer. Failure to attract enough buyers to defend the current support zone will give the bears an opportunity to retest the week’s low at $82,223.
Bitcoin Pepe surpasses $4 million in less than 4 weeks as momentum heightens
Less than 4 weeks since the launch of its presale, Bitcoin Pepe has already raised over $4 million. Indeed, it is more than a typical meme coin; it is a revolutionary project.
Through the new PEP-20 standard, anyone can launch a meme coin directly on the highly stable Bitcoin network. This has bridged the gap between the Bitcoin maximalists who view meme coins as an unserious venture and meme coin enthusiasts who saw BTC as being beyond their reach.
Besides, the Layer 2 solution is aimed at building “Solana on Bitcoin”. This means that investors are assured of Bitcoin’s top-notch security while enjoying lower fees and speedier transactions.
At stage 6 of its presale, the early adopters have already locked in 27.6% in gains. By the time it hits the public shelves in Q2, their capital investment will have earned cumulative returns of 311.4%. Read more on how to buy Bitcoin Pepe here.
Crypto downturn pushes Solana on range-bound trading
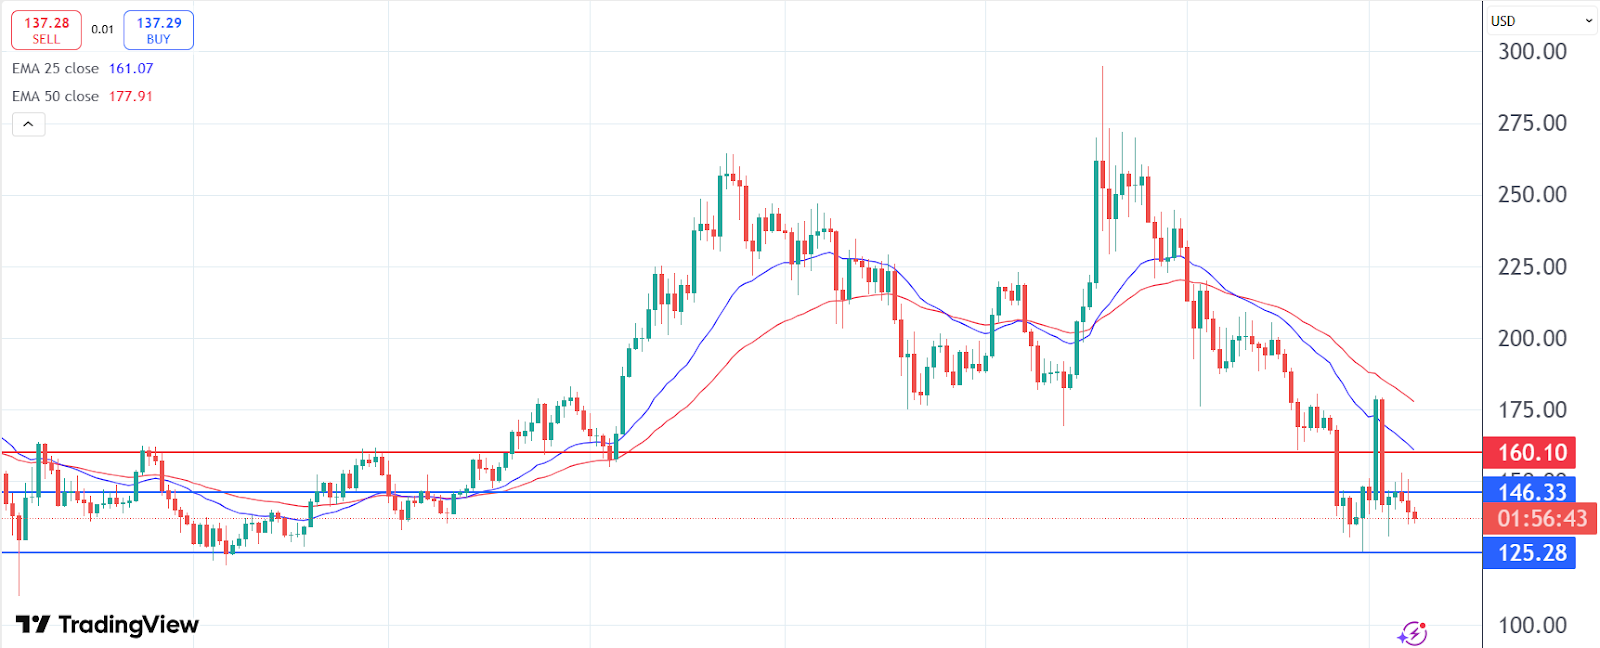
Solana price has experienced intense swings in recent weeks; plunging by about 53% since hitting its all-time high in late January 2025. During this timeframe, it has been in the red for six out of the past seven weeks.
A look at its daily chart shows the altcoin trading below the 25 and 50-day EMAs, indicating that it is not out of the woods yet. In the short term, the range between the steady support zone of $125.28 and the resistance level of $146.33 will be worth watching. Further rebounding will have the bulls eyeing the next target at $160.10.


Leading meme coin Shiba Inu has shed almost 10% of its value over the past week. As of this writing, SHIB trades at $0.0000125.
This price decline coincides with a significant drop in whale holdings during the same period. This signals waning confidence among large investors amid broader market weakness.
SHIB’s Market Confidence Wanes as Whale Sell-Off Accelerates
According to IntoTheBlock, SHIB’s large holders ’netflow has fallen 123% in the past week. This comes amid the meme coin’s 8% price dip.
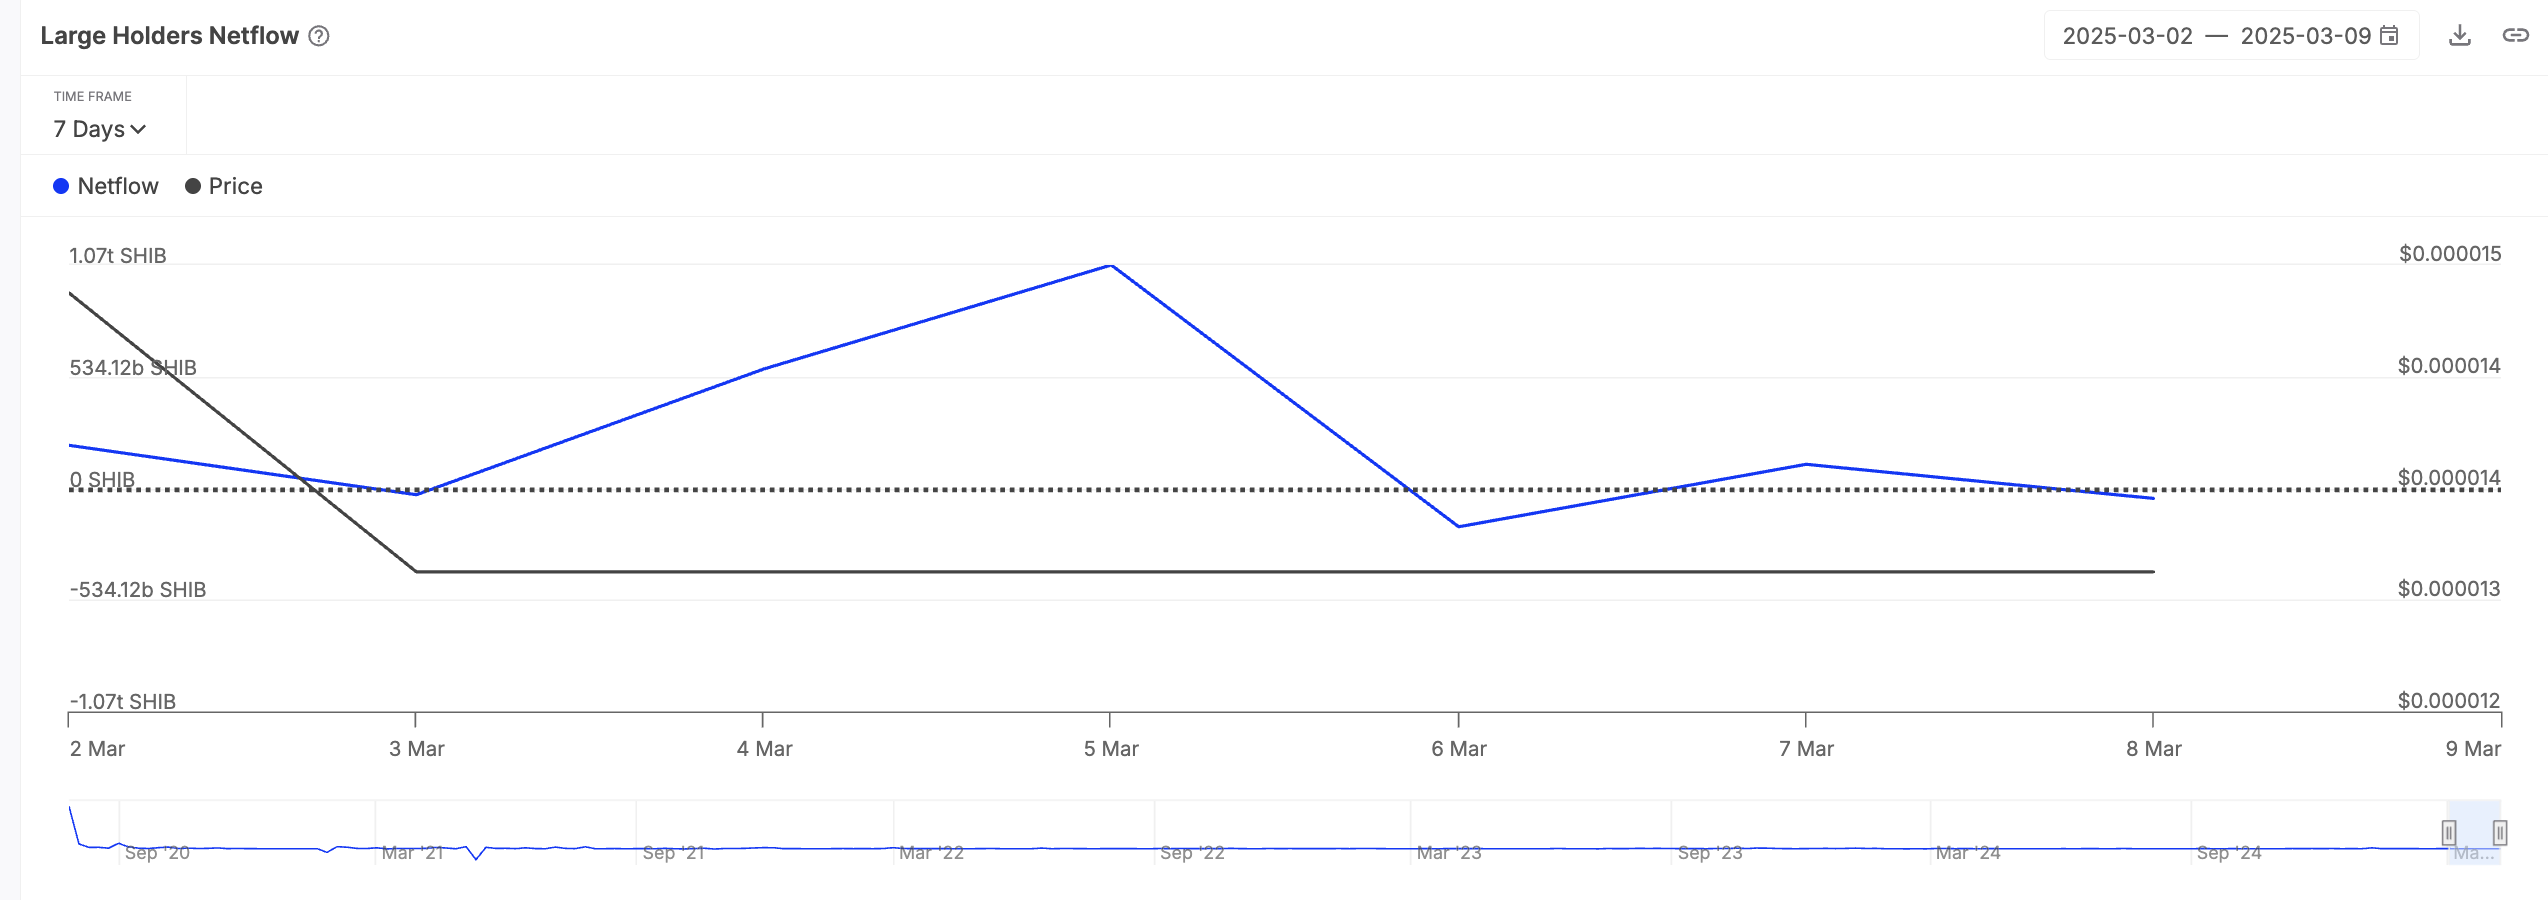
Large holders refer to whale addresses that hold more than 0.1% of an asset’s circulating supply. Their netflow measures the inflow and outflow of tokens in their wallets to track whether they are accumulating (positive netflow) or offloading (negative netflow) their holdings.
When this metric falls, it indicates that whales are selling large portions of their assets, leading to increased supply and putting more downward pressure on price.
Moreover, this decline in SHIB whale netflow could worsen the weakening confidence among SHIB retail traders, prompting them to sell their coins in anticipation of further losses. This can accelerate SHIB’s price dip in the short term.
On the daily chart, SHIB’s falling Relative Strength Index supports this bearish outlook. At press time, this momentum indicator is a downward trend at 35.34.
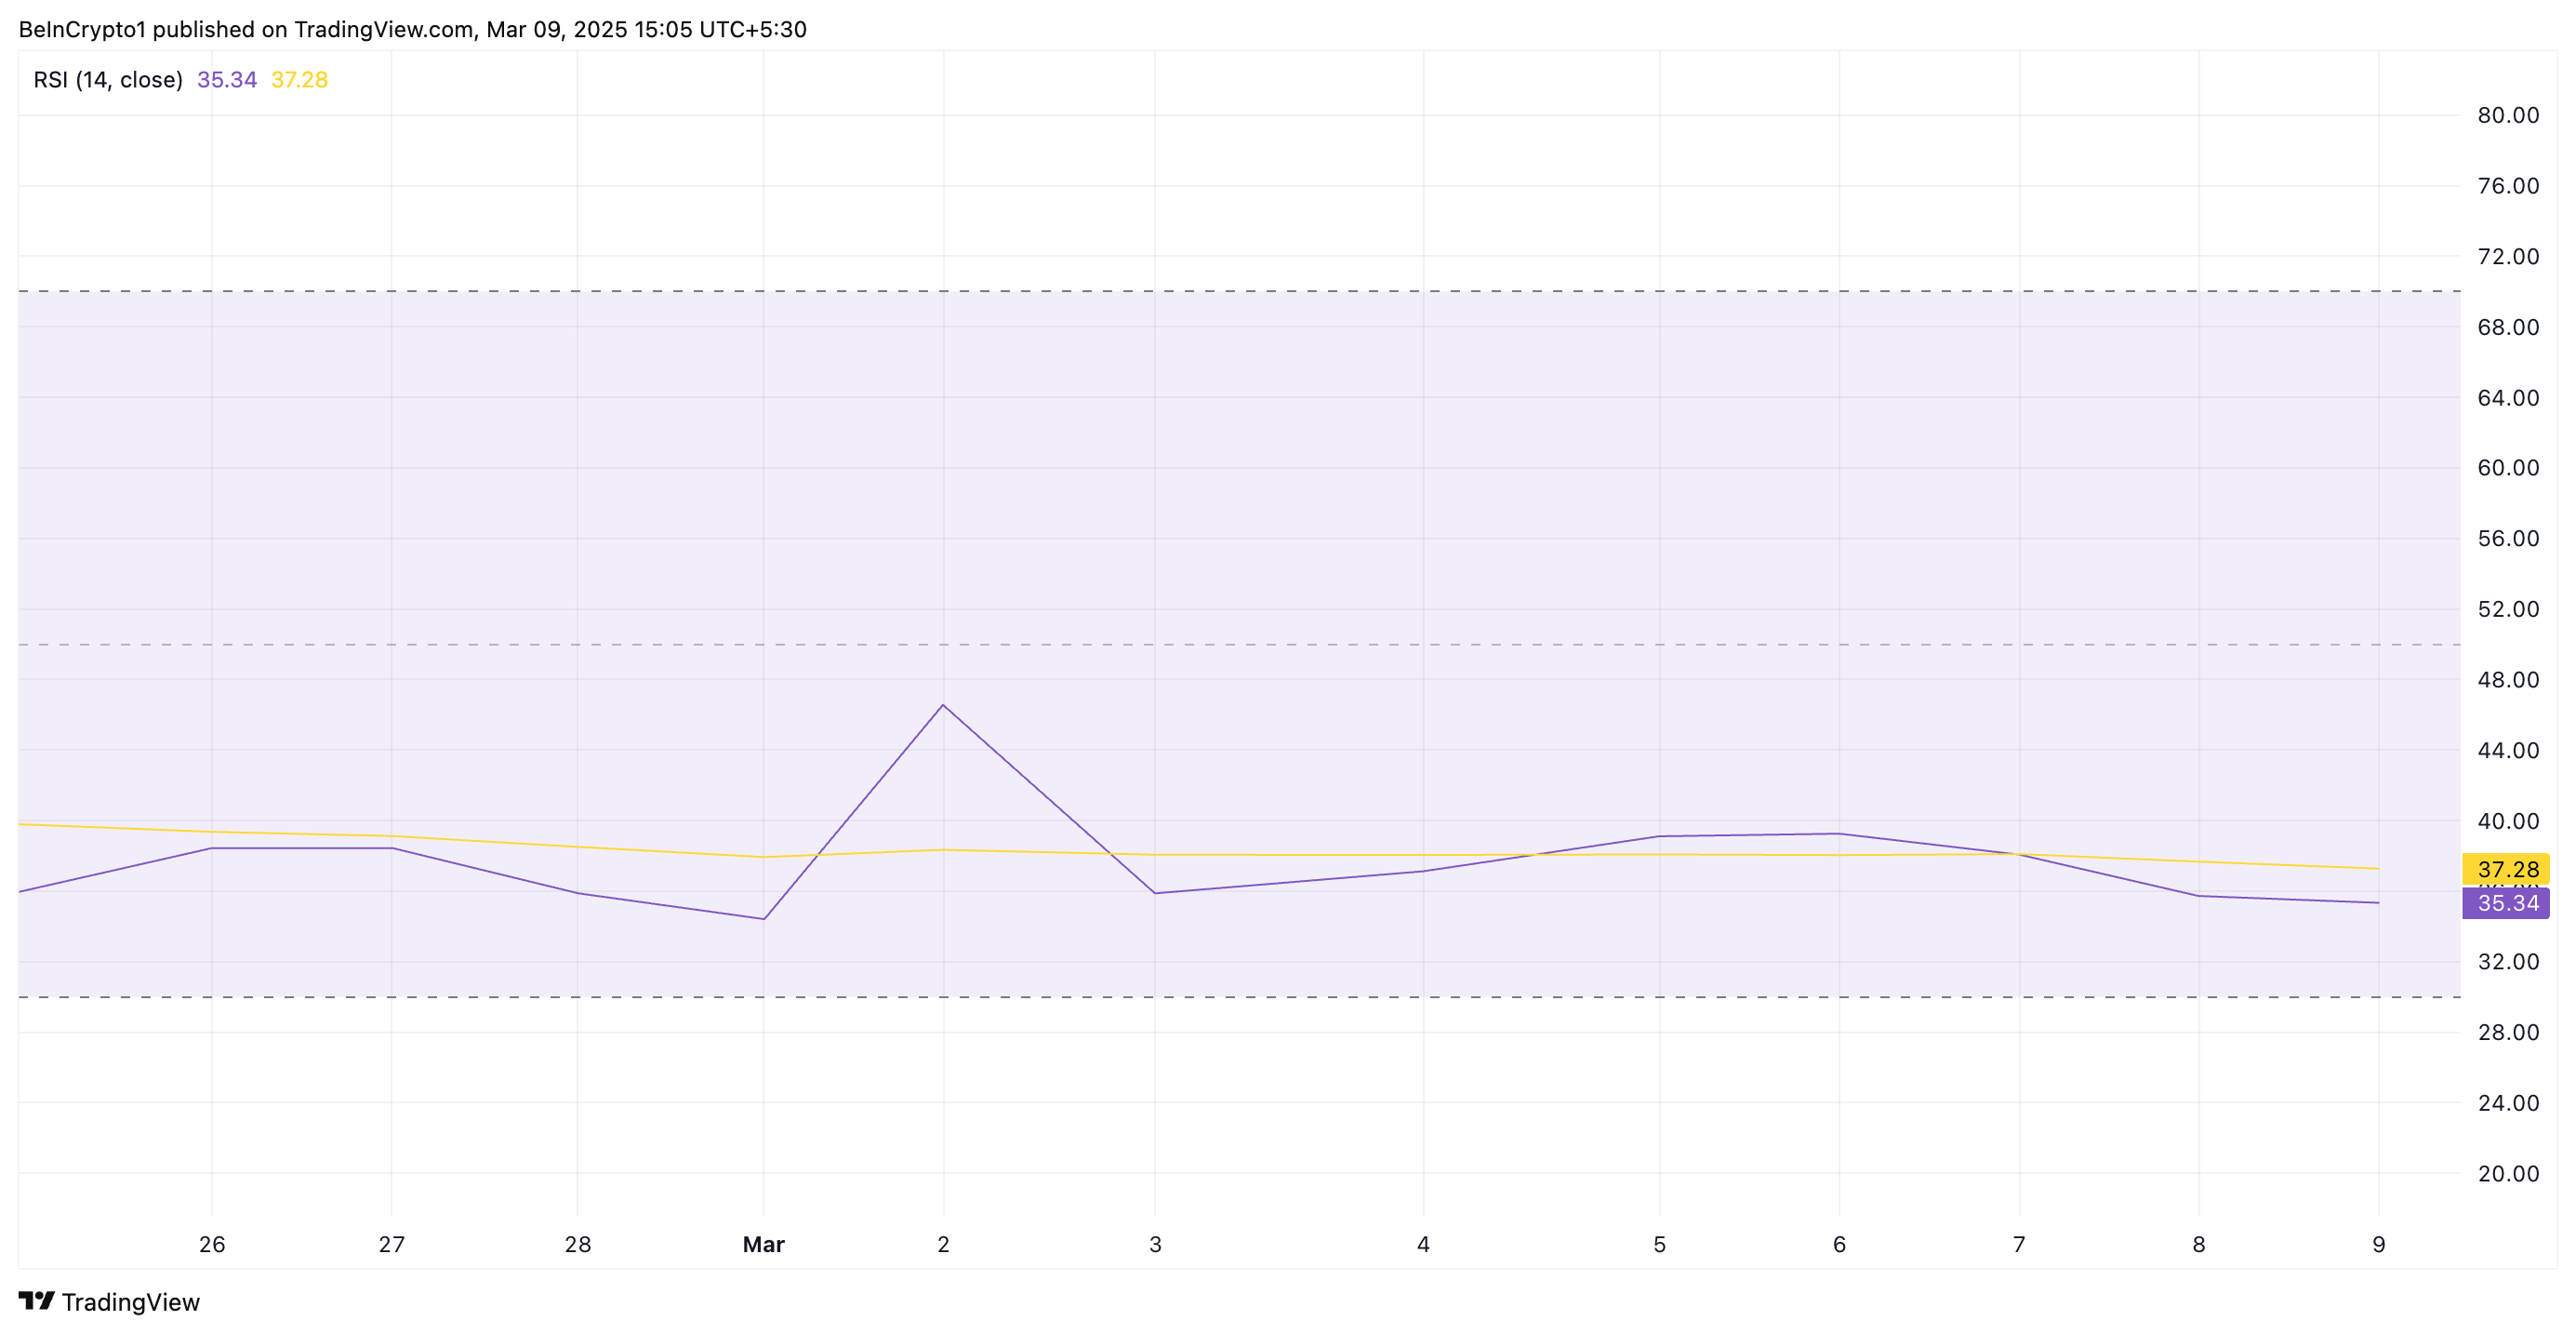
An asset’s RSI measures an asset’s oversold and overbought conditions. It ranges between 0 and 100, with values above 70 indicating that the asset is overbought and due for a decline. Conversely, values under 30 suggest that the asset is oversold and could witness a rebound.
At 35.05, SHIB’s RSI indicates that the asset is approaching oversold territory but has not fully entered it yet. This suggests weakening buying pressure and hints at the potential for further downside unless the meme coin demand picks up.
SHIB Holds Below Descending Trend Line
SHIB has remained below a descending trend line since December 8, keeping its price in decline. This pattern is formed when an asset’s price consistently makes lower highs over a period, connecting these peaks with a downward-sloping line. It is a bearish trend, indicating sustained selling pressure among SHIB market participants.
If this decline continues, SHIB risks falling to a seven-month low of $0.0000107.
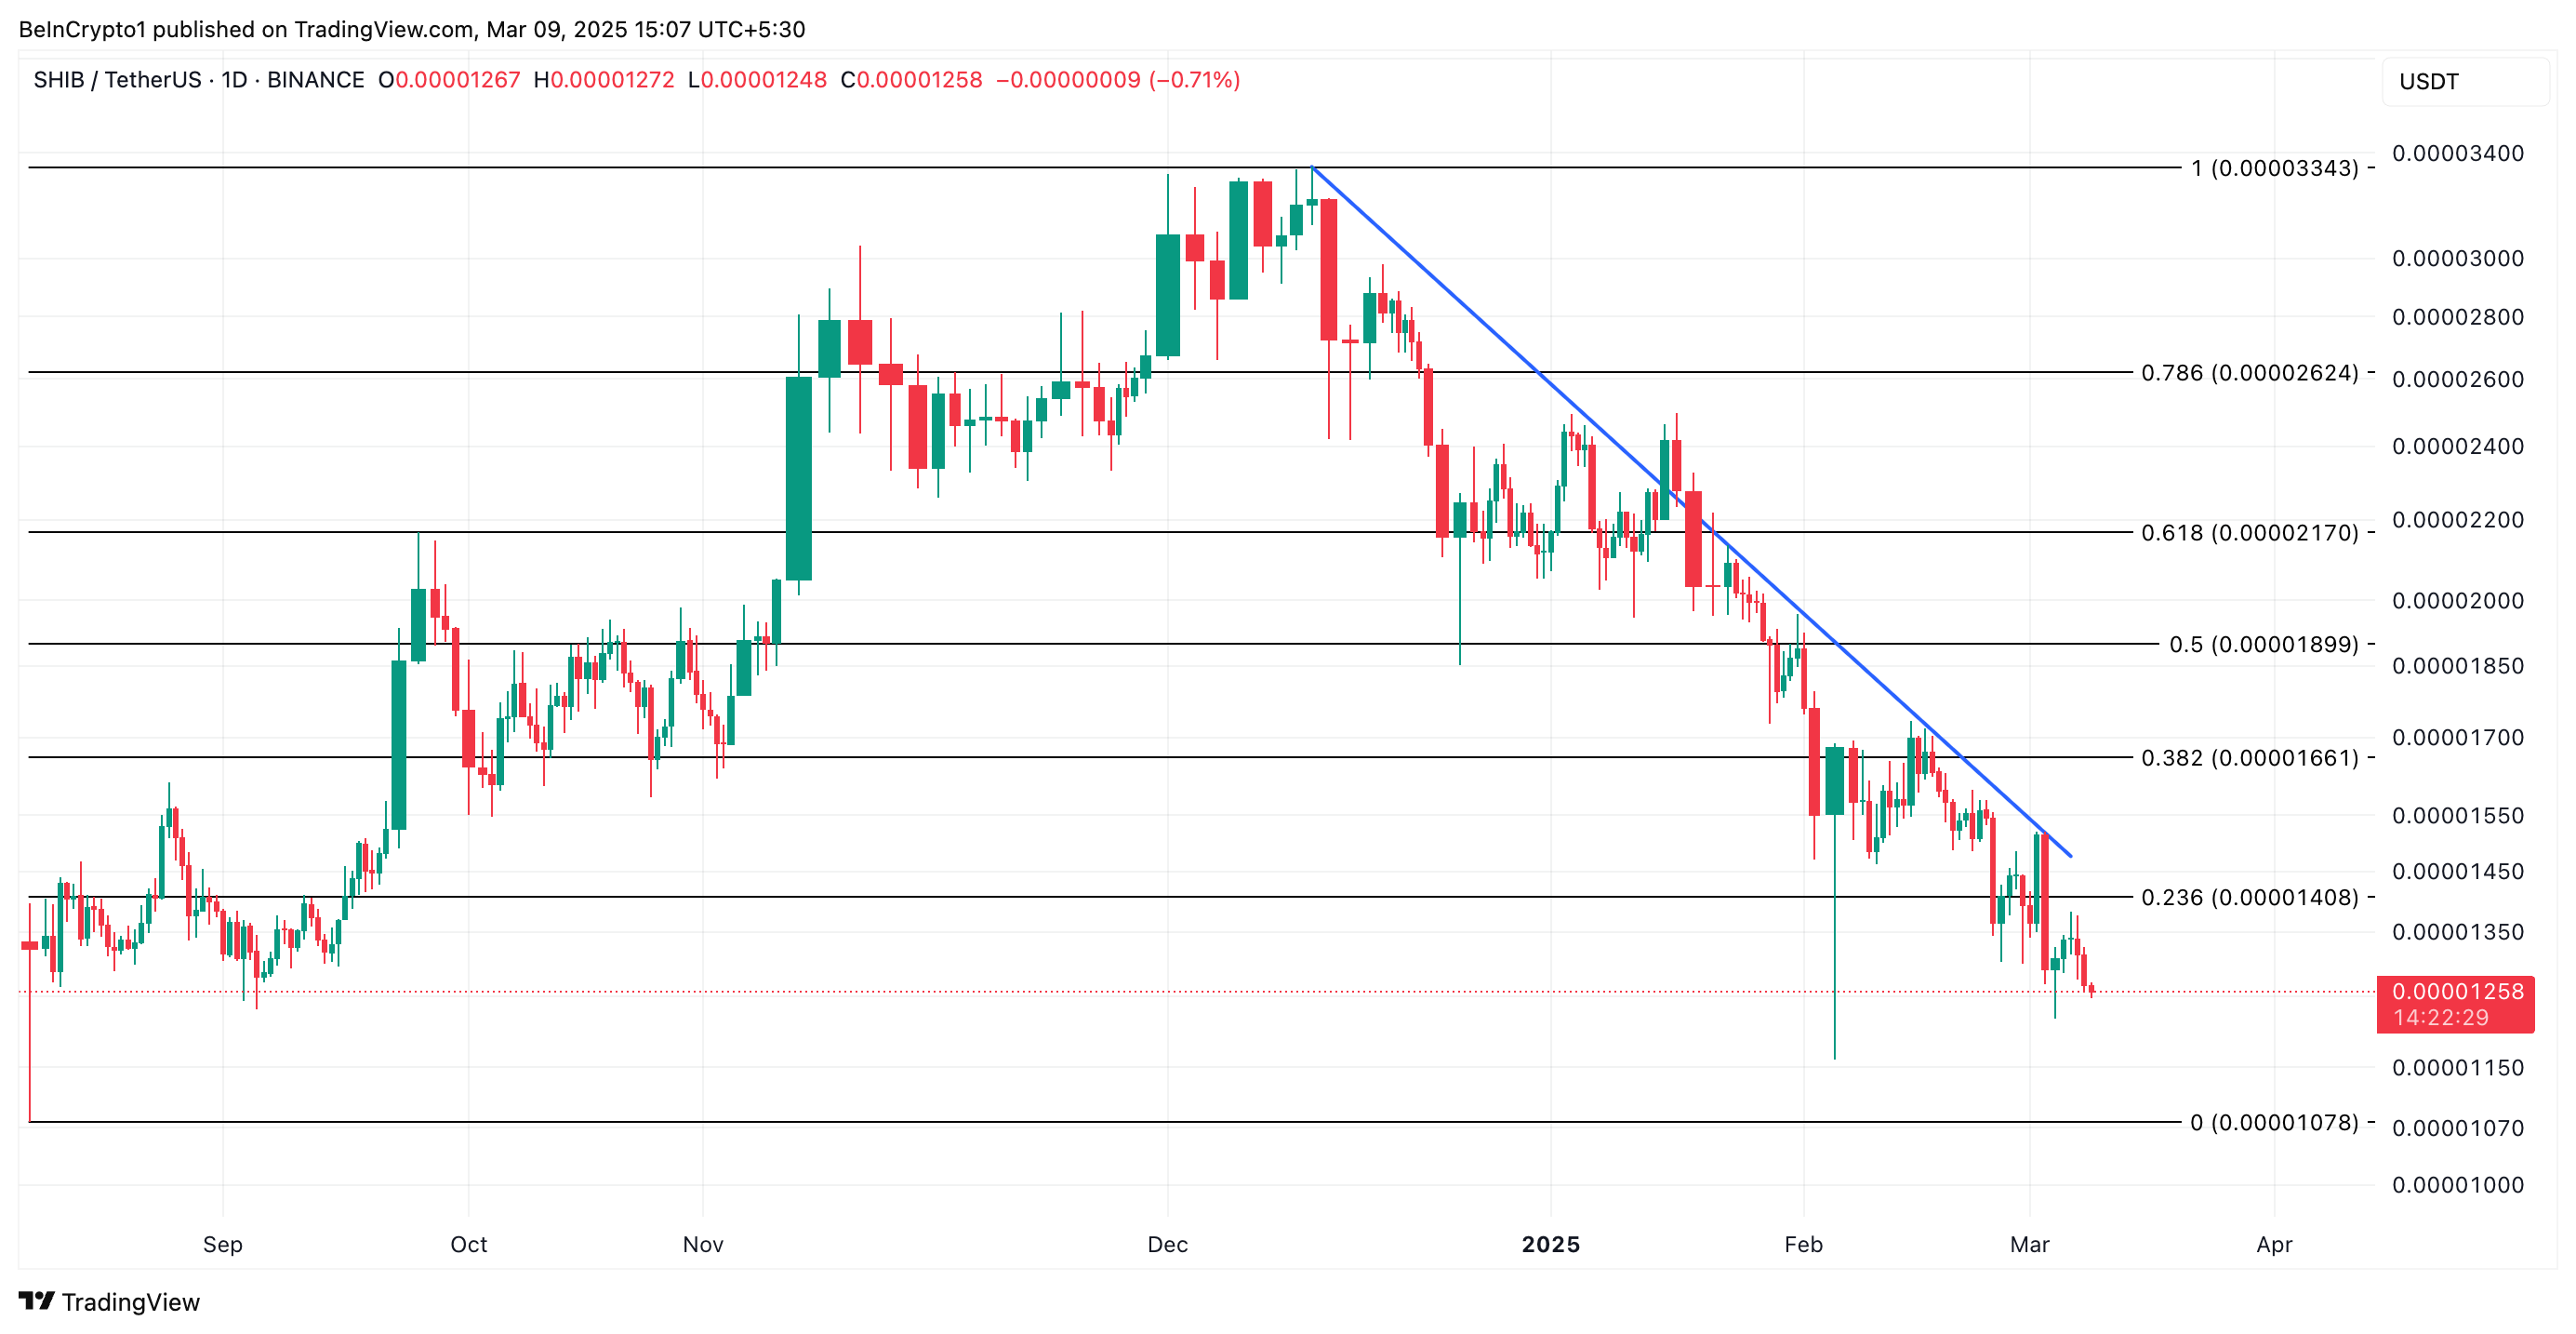
However, if buying pressure regains momentum, it could drive SHIB’s value to $0.0000166.
Disclaimer
In line with the Trust Project guidelines, this price analysis article is for informational purposes only and should not be considered financial or investment advice. BeInCrypto is committed to accurate, unbiased reporting, but market conditions are subject to change without notice. Always conduct your own research and consult with a professional before making any financial decisions. Please note that our Terms and Conditions, Privacy Policy, and Disclaimers have been updated.

SafeMoon’s price has climbed over 25% in the past week amid the broader market volatility. This double-digit price gain has been fueled by the uptick in the token’s demand following the project’s migration from BNB Chain to Solana.
However, profit-taking and increased selling pressure are now threatening to erase some of SFM’s recent gains. This analysis provides the details.
SafeMoon Battles Growing Sell-Offs
An assessment of the SFM/USD one-day chart highlights the growing selling pressure within SFM’s spot markets. A notable indicator of this trend is the token’s negative Balance of Power (BoP), which is at -0.96 at press time.
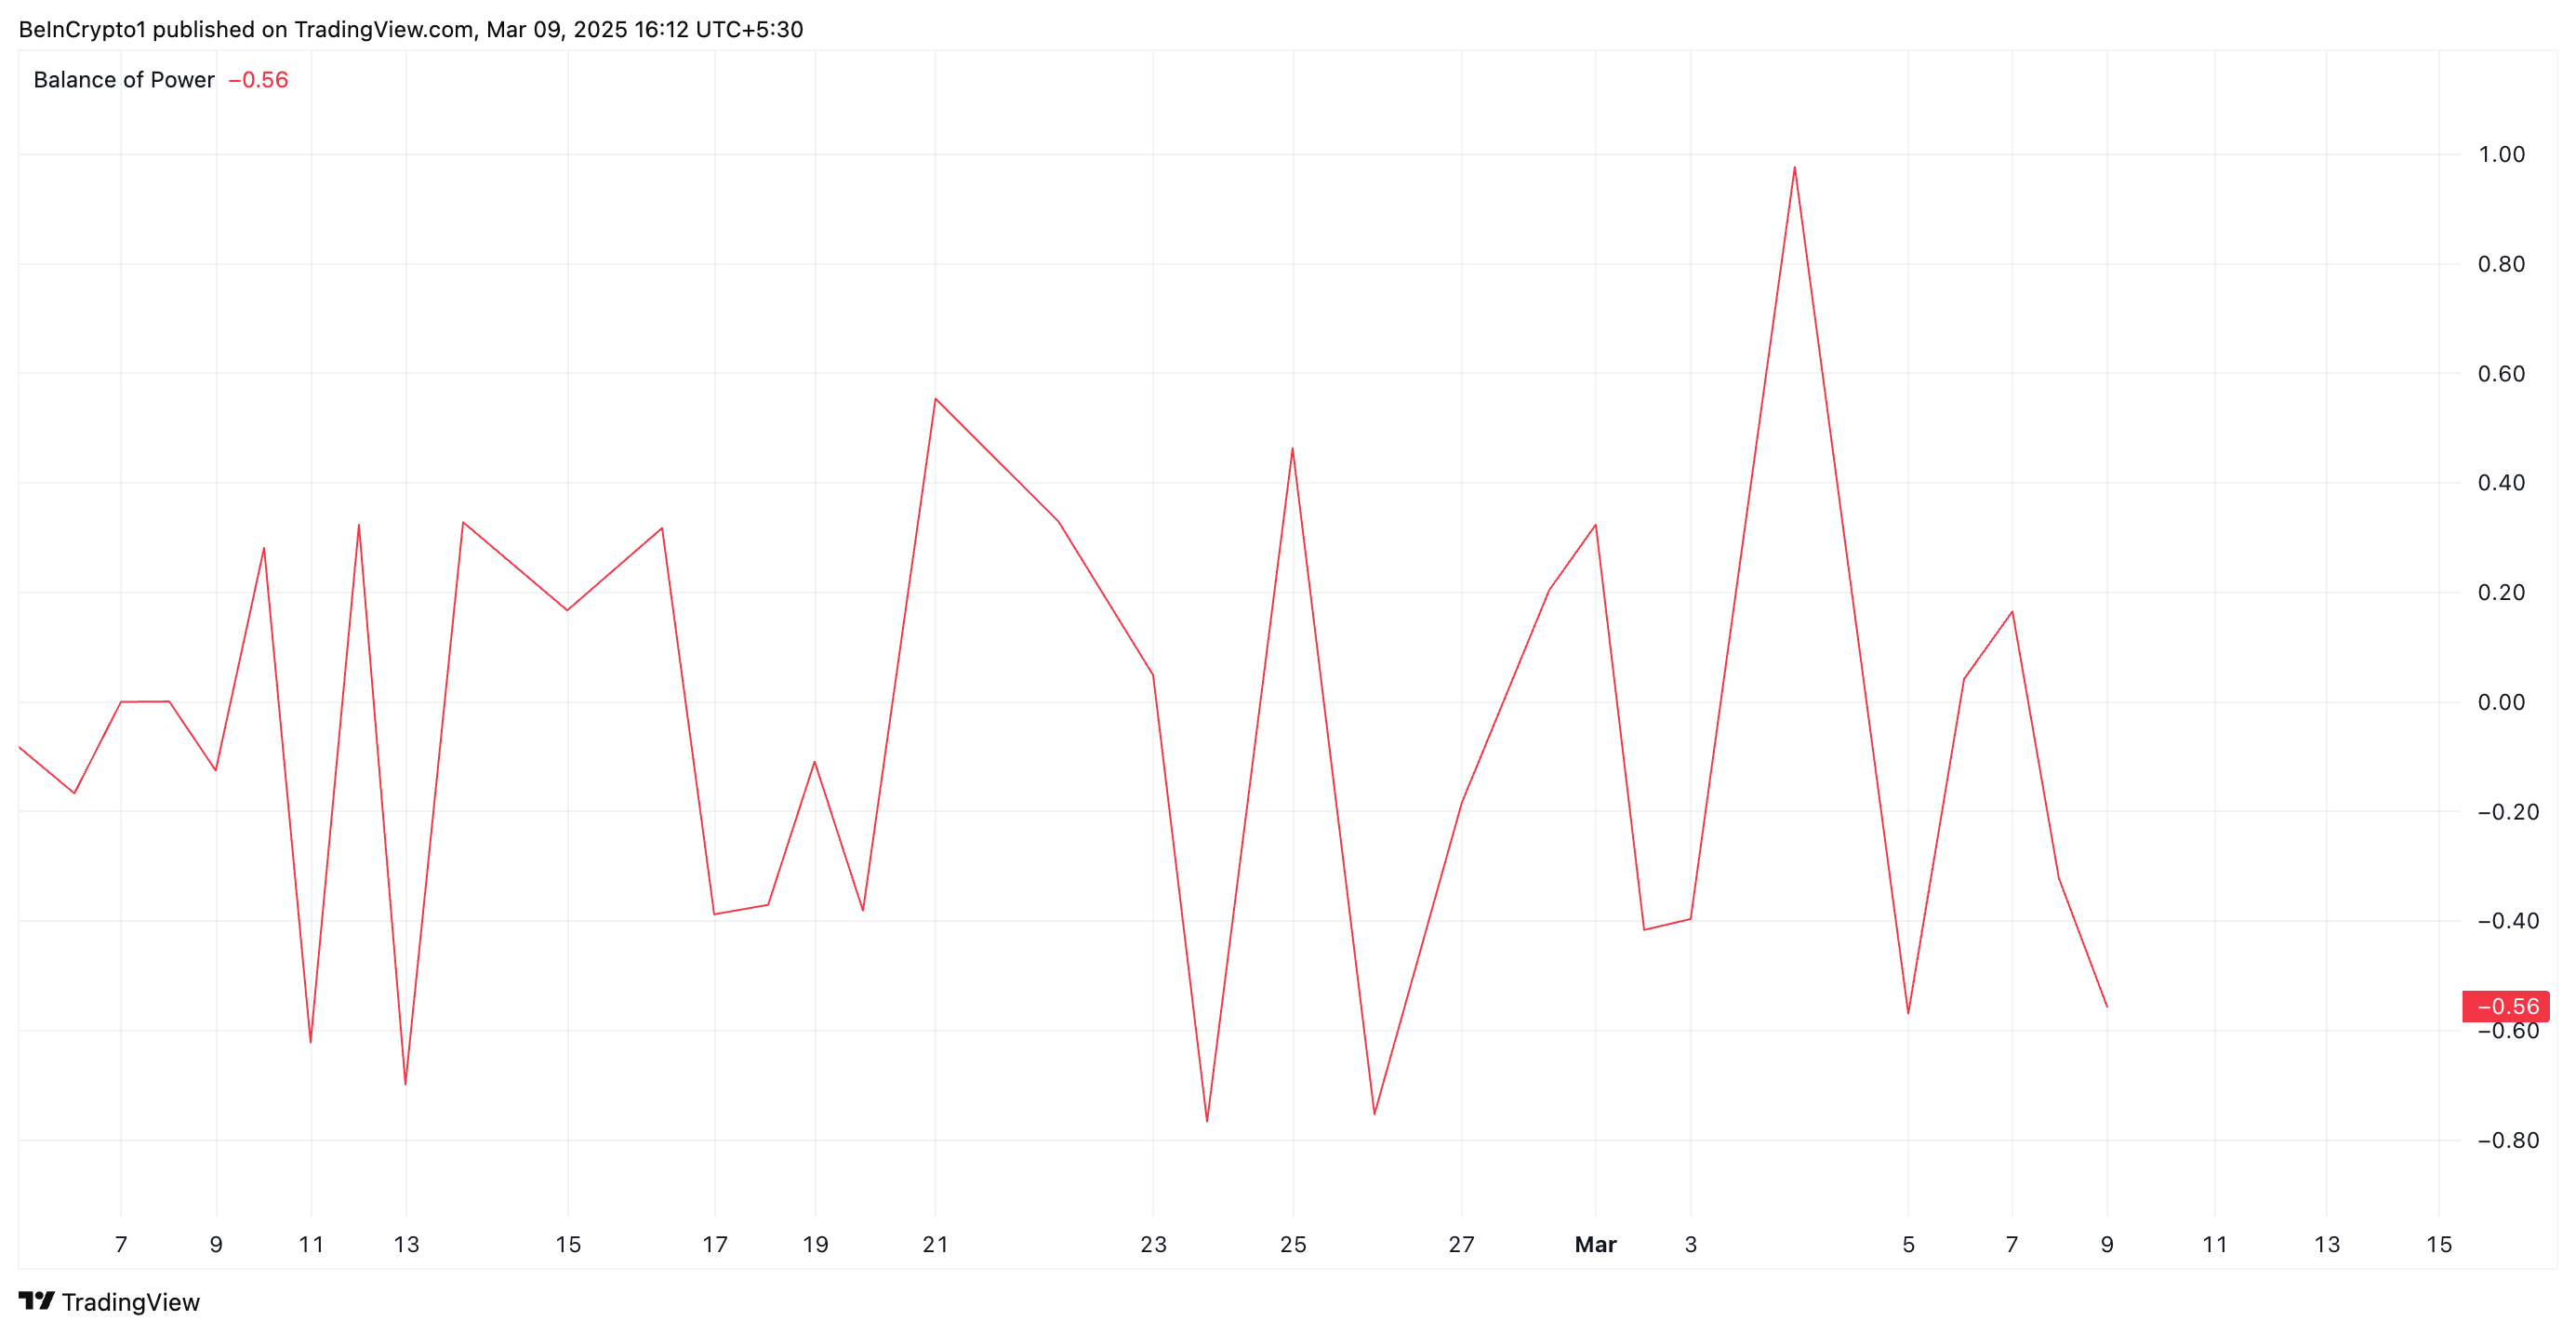
An asset’s BoP indicator compares buyers’ and sellers’ strengths by analyzing price movements within a given period. When its value is negative like this, it indicates that sellers have more control, meaning downward pressure is stronger, and the asset is likely experiencing a bearish trend.
This suggests weakening bullish momentum among SFM holders and hints at declines if selling pressure continues.
Furthermore, SFM’s price has dropped 8% over the past 24 hours, causing the altcoin to trade near its 20-day exponential moving average (EMA).
This moving average measures an asset’s average price over the past 20 trading days, giving more weight to recent prices to identify short-term trends.
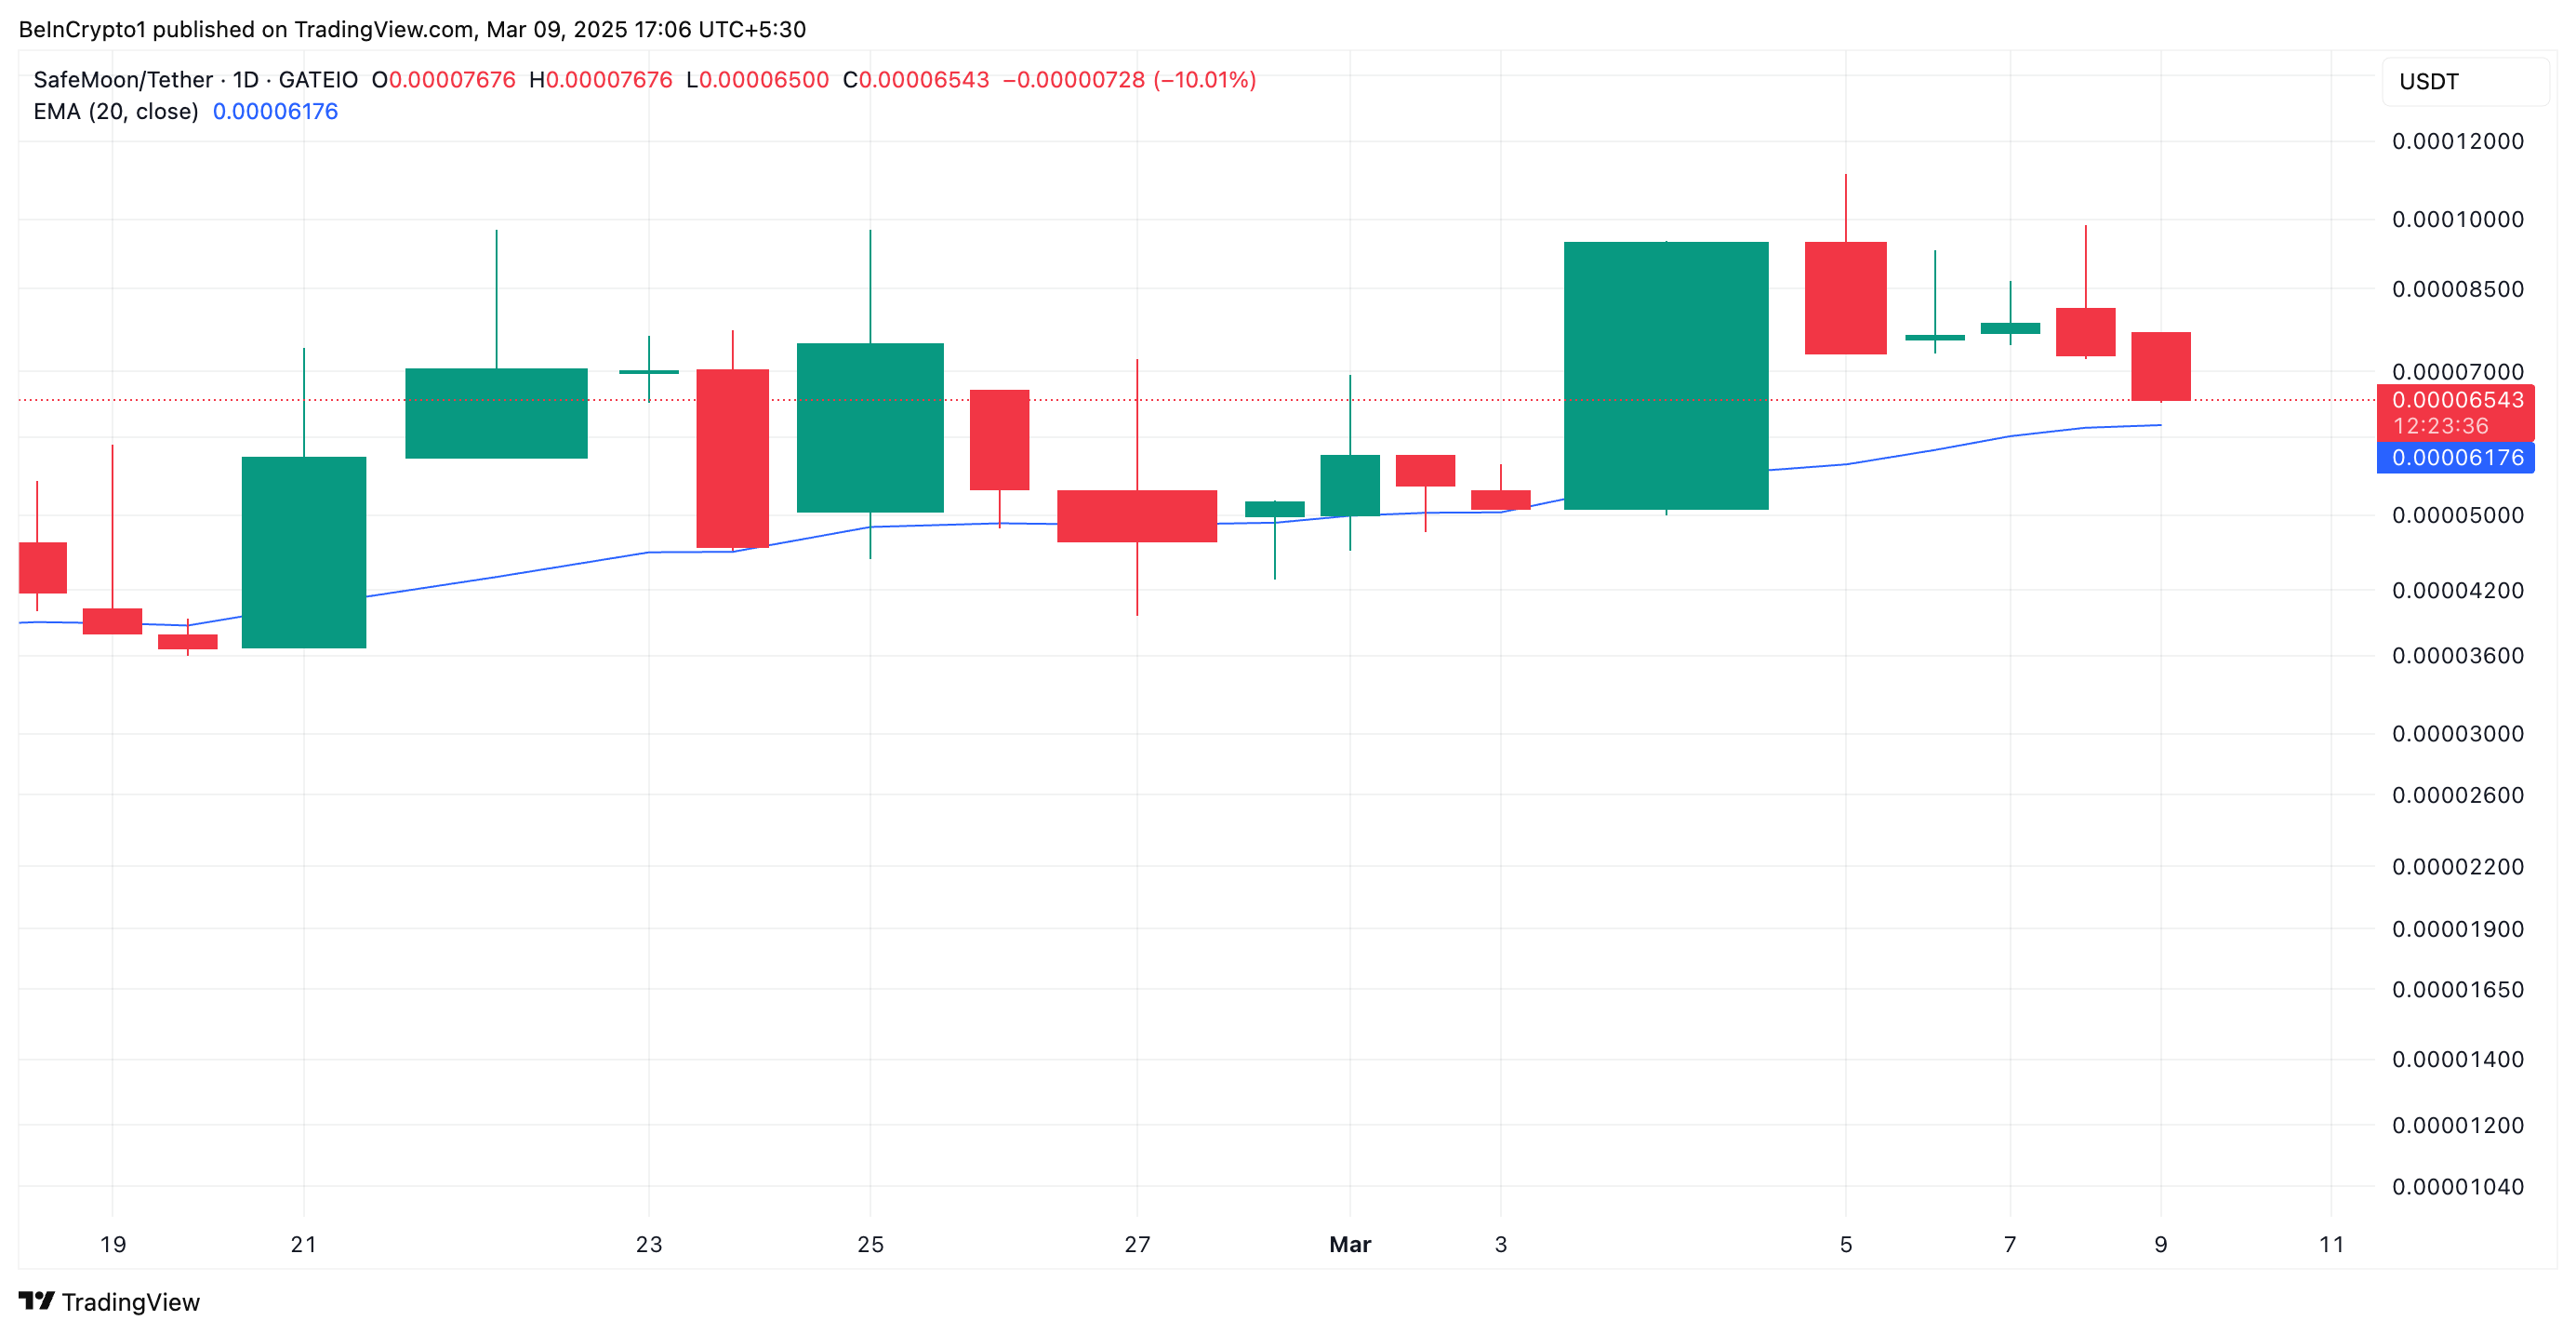
As with SFM, when an asset’s price is poised to break below the 20-day EMA, it signals increased selling pressure. It is a sign of weakening bullish momentum and a shift toward a bearish trend.
SFM Finds Key Support at $0.000061
A successful breach of the dynamic support offered by SafeMoon’s 20-day EMA at $0.000061 would strengthen the bearish trend. In this scenario, the altcoin’s price could plummet further to $0.000047.
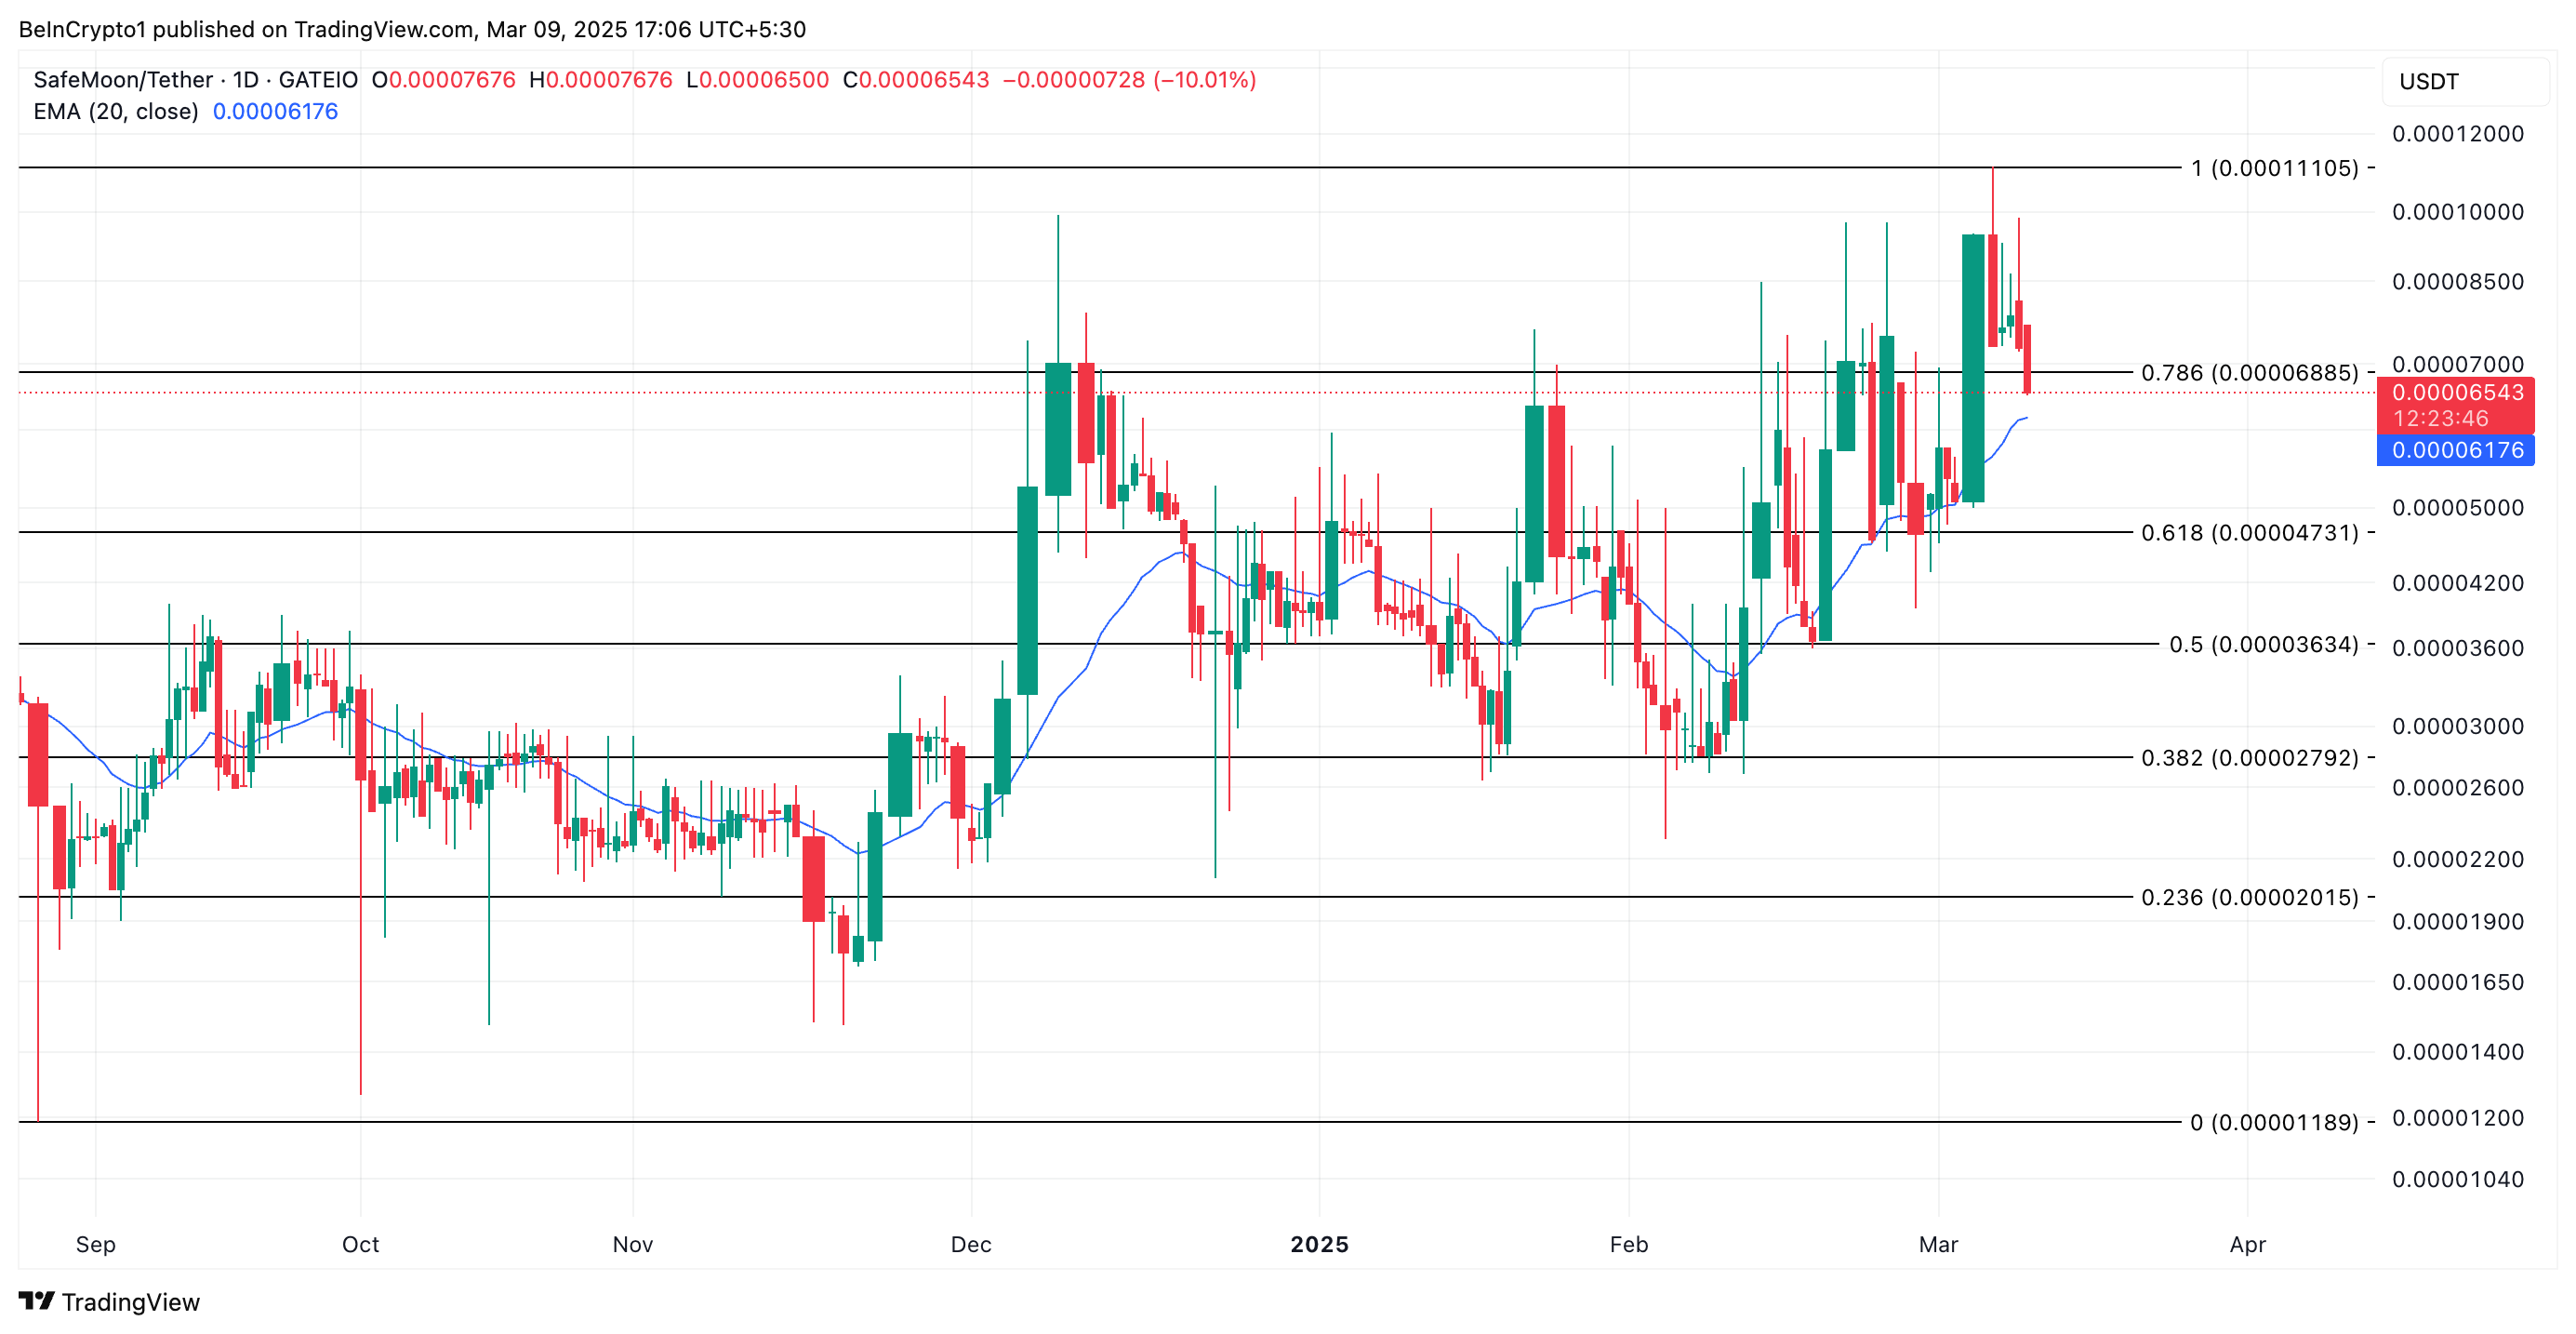
However, a spike in new demand would invalidate this bearish outlook. If spot inflows rally, it could drive SFM’s price above the resistance at $0.000068 toward its multi-year high at $0.000011.
Disclaimer
In line with the Trust Project guidelines, this price analysis article is for informational purposes only and should not be considered financial or investment advice. BeInCrypto is committed to accurate, unbiased reporting, but market conditions are subject to change without notice. Always conduct your own research and consult with a professional before making any financial decisions. Please note that our Terms and Conditions, Privacy Policy, and Disclaimers have been updated.

Berachain (BERA) has suffered a steep decline over the past week, shedding 30% of its value as bearish sentiment plagues the general market.
In the past 24 hours alone, the token has slid another 6%, deepening concerns of further downside. With growing bearish bias against the altcoin, this might be the case in the near term.
BERA Faces Mounting Downside Risk
Berachain’s sharp decline has triggered a surge in short positions across its futures market. This rise in demand for shorts is evident in its funding rate, which has been negative since the token’s launch on February 6. At press time, this is at -0.11%.
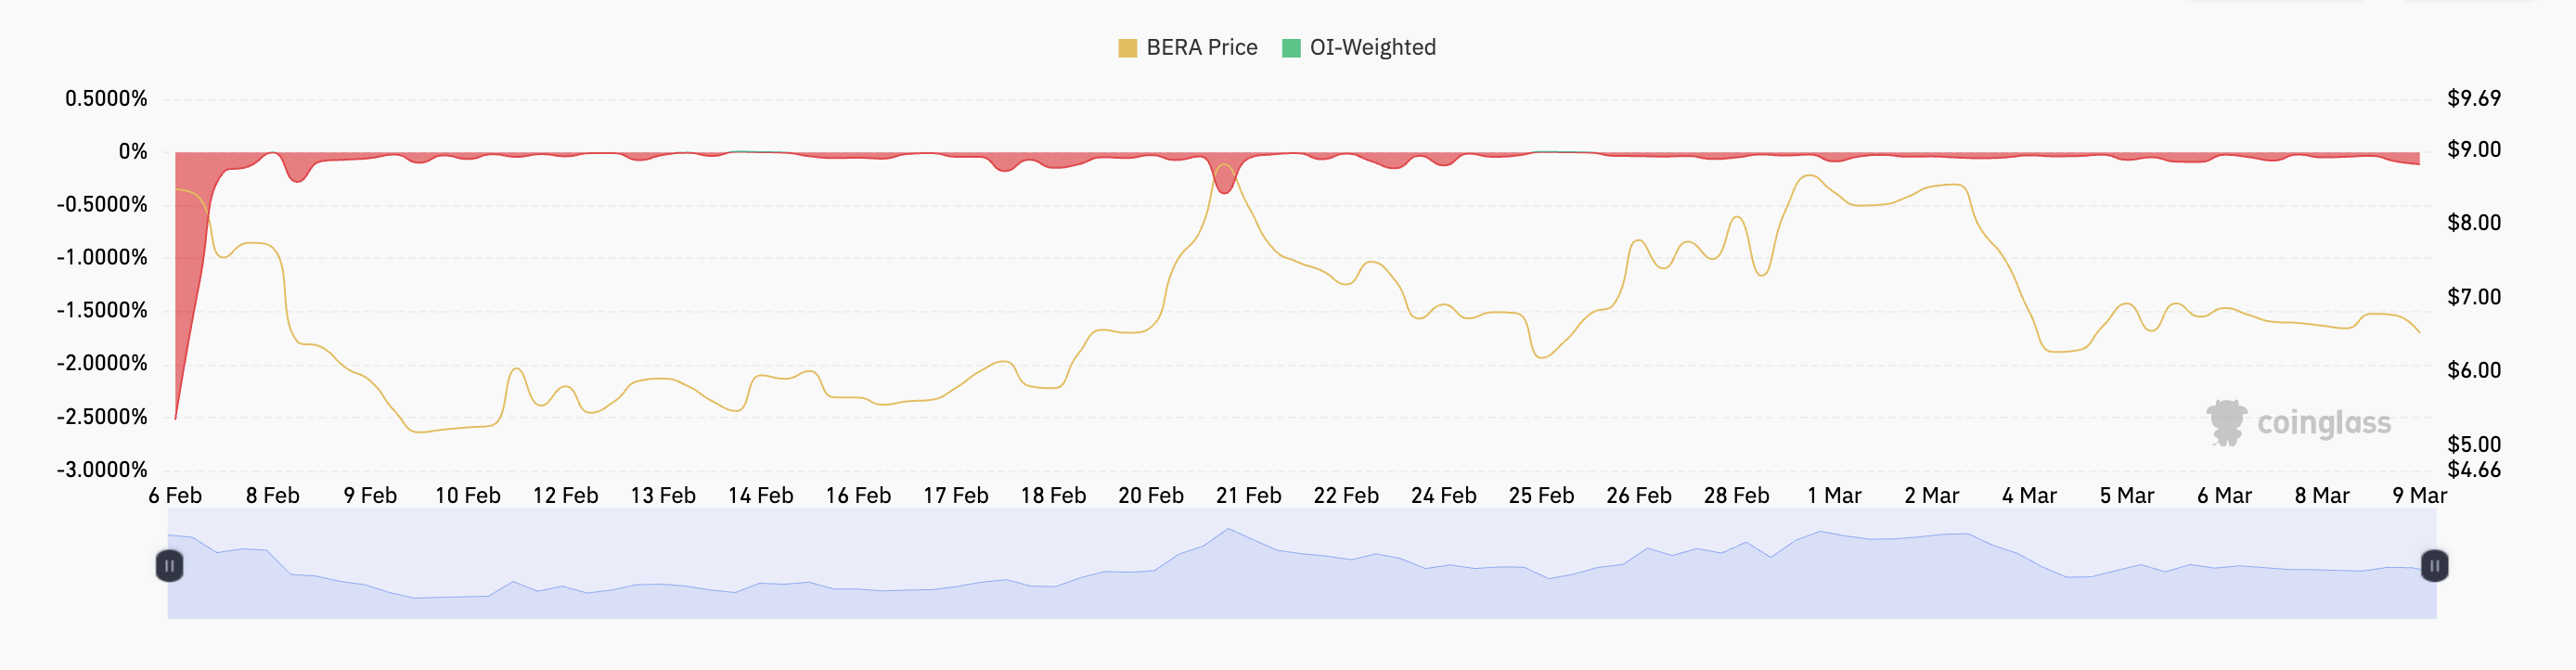
The funding rate is a periodic fee exchanged between long and short traders in perpetual futures contracts to keep prices aligned with the spot market.
A negative funding rate means that short traders are paying long traders, indicating a stronger demand for short positions.
As with BERA, if an asset experiences an extended period of negative funding rates, it suggests sustained bearish sentiment. It indicates that the token’s traders consistently bet on further price declines. This prolonged negativity could increase BERA’s price volatility and extend its price fall.
In addition, BERA has noted significant fund outflows from its spot markets over the past few days. Per Coinglass, the altcoin has noted almost $2 million in spot market outflows today alone.
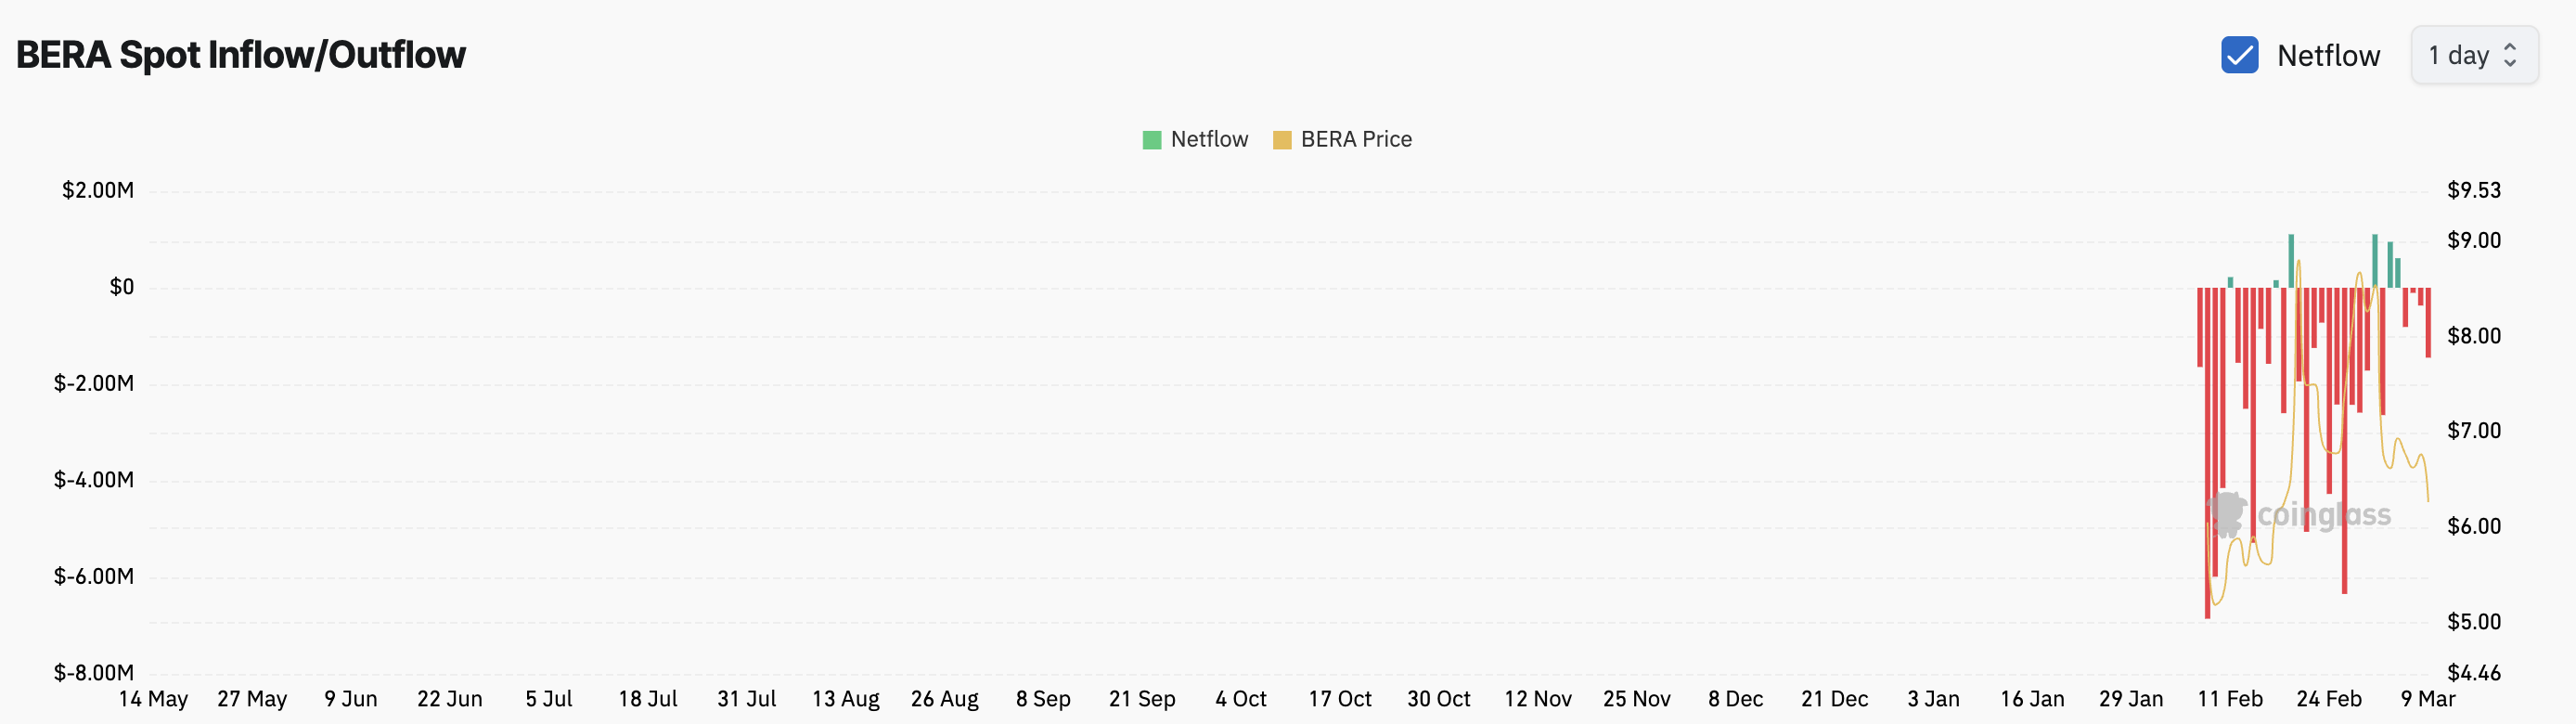
When an asset experiences spot outflows like this, it signals a surge in selling pressure. It indicates a bearish trend as investors reduce exposure or take profits, potentially leading to further price declines.
BERA at a Crossroads—Break Below $6.07 or Rally Toward $7.36?
Berachain trades at $6.14 at press time, resting slightly above support at $6.07. If the bearish bias against the altcoin strengthens, its price could break below this support floor, causing the token to trade at a low of $5.35.
If the bulls fail to defend this level, BERA could slip to its all-time low of $4.74.
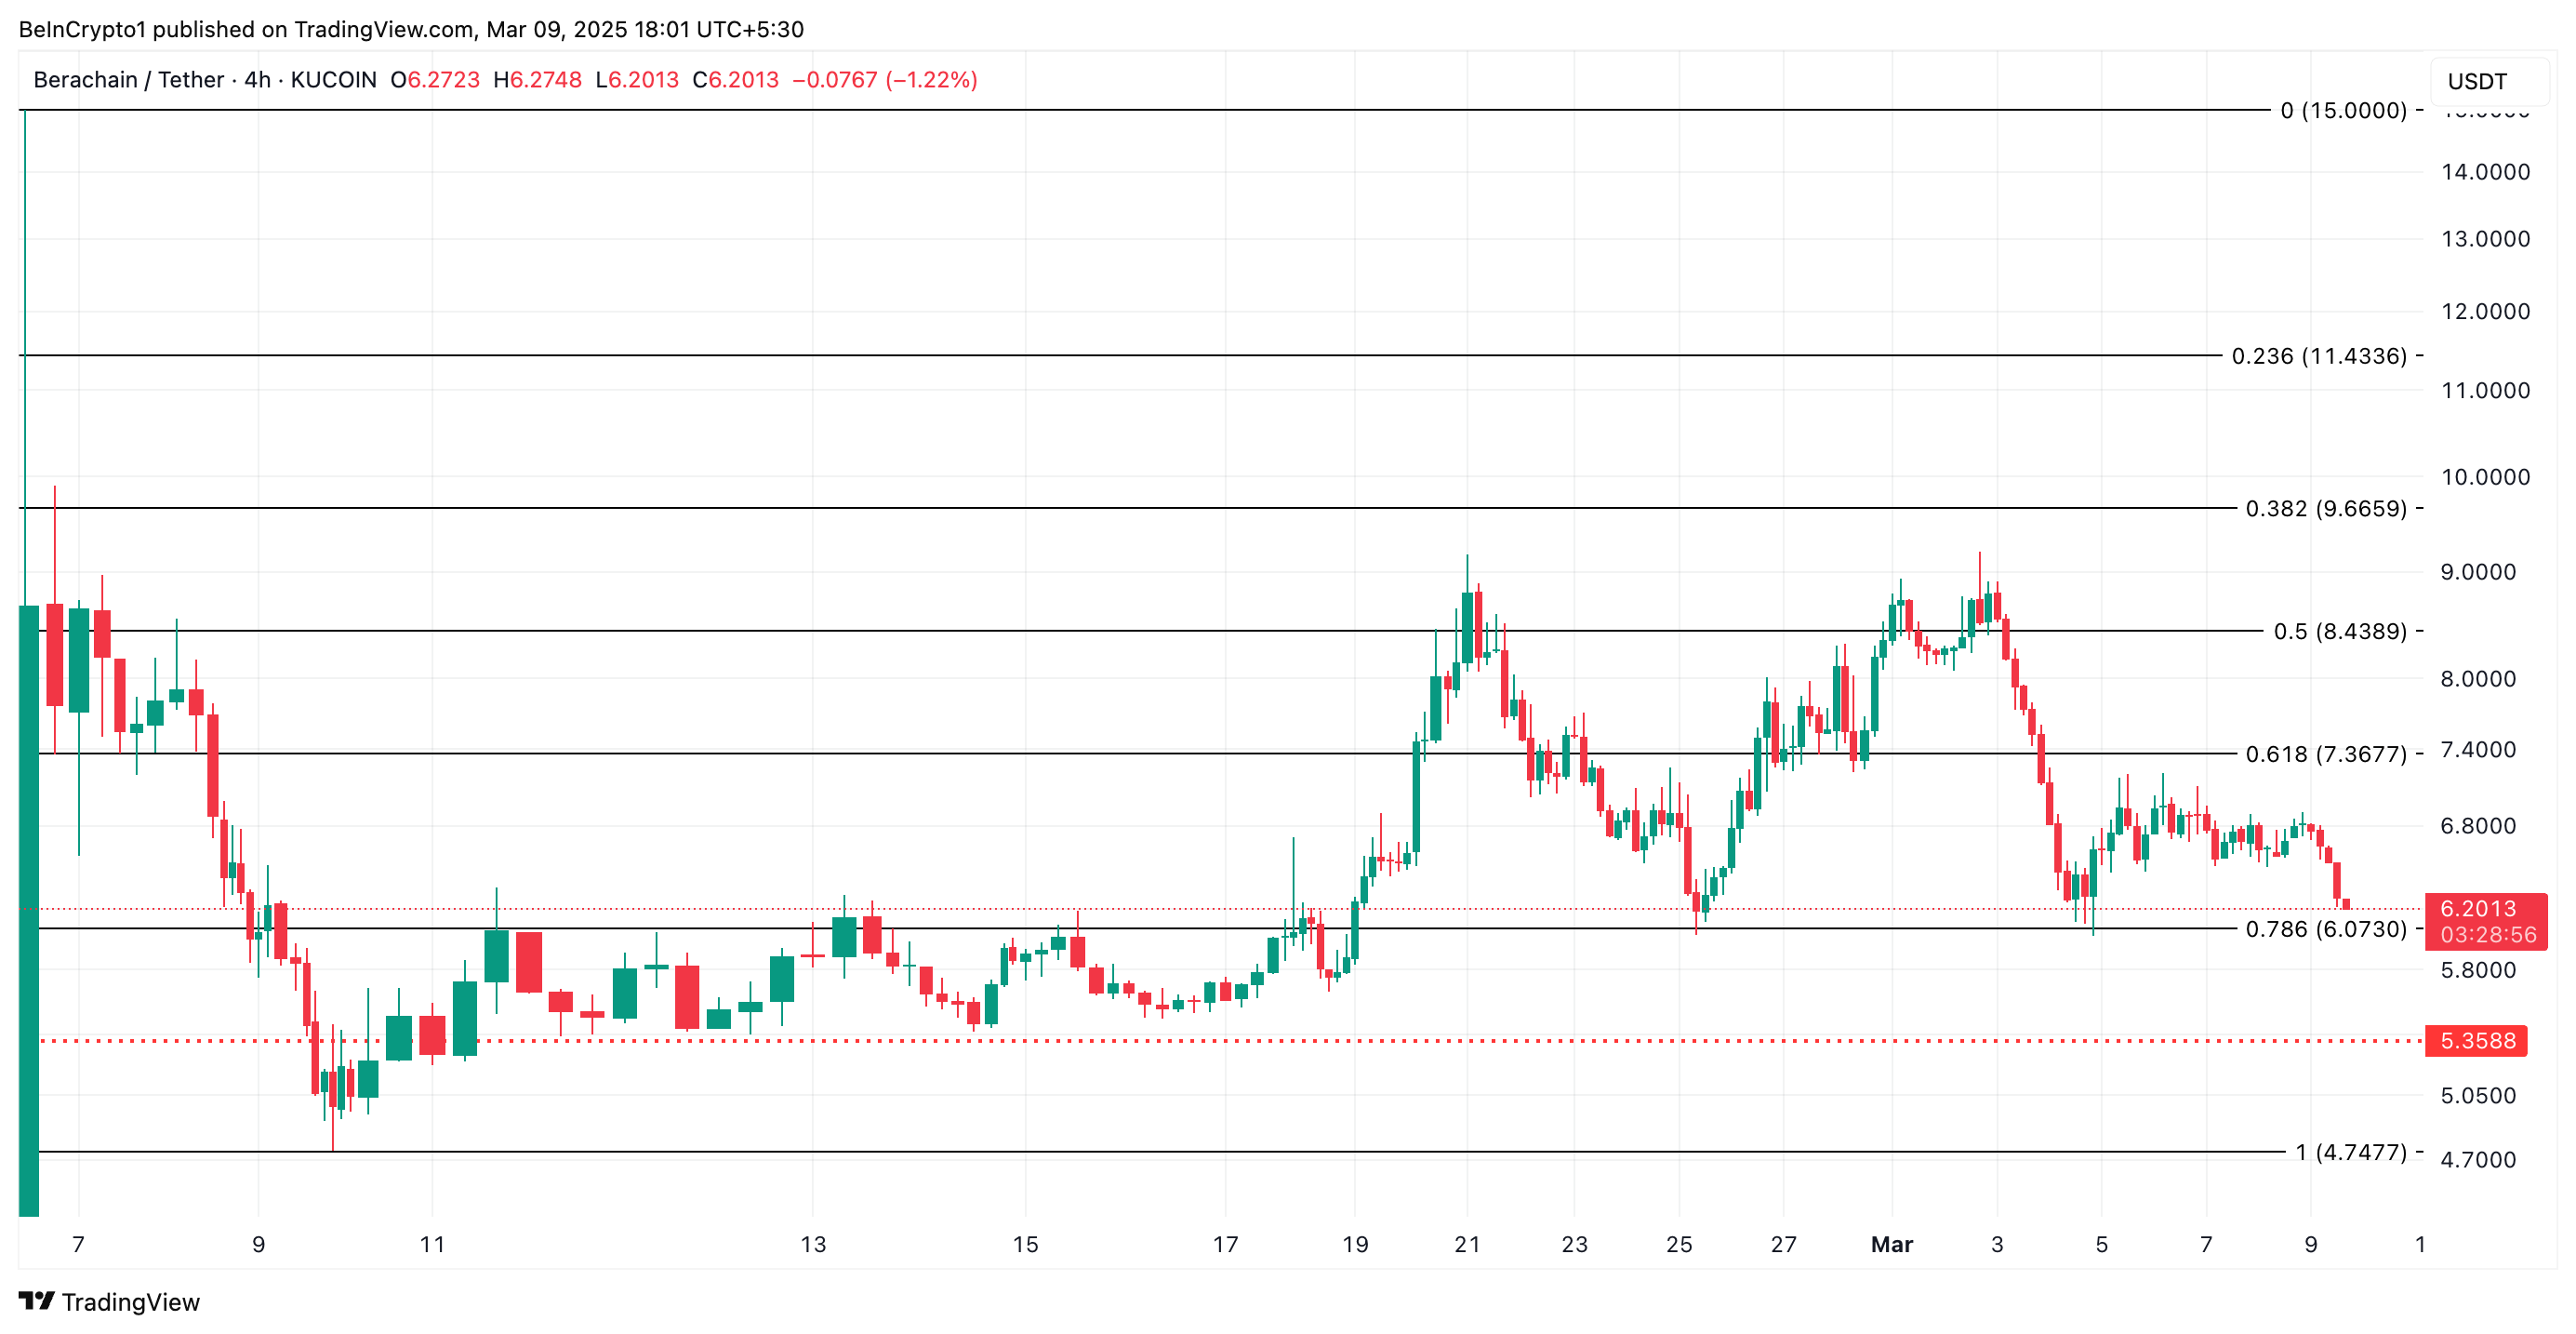
On the other hand, if market sentiment improves and BERA’s demand soars, its price could rally to $7.36.
Disclaimer
In line with the Trust Project guidelines, this price analysis article is for informational purposes only and should not be considered financial or investment advice. BeInCrypto is committed to accurate, unbiased reporting, but market conditions are subject to change without notice. Always conduct your own research and consult with a professional before making any financial decisions. Please note that our Terms and Conditions, Privacy Policy, and Disclaimers have been updated.

Shiba Inu Whales Cut Holdings—Is a Bigger Price Drop Ahead?

SafeMoon (SFM) Selling Pressure Threatens Previous Gains

Bitcoin Liquidation Heatmap Signals Potential Bitcoin Price Swings – What’s Next

Berachain Price Drops 30%—More Losses Ahead?

Fintech Leaders Push for US Federal Regulatory Sandbox

XRP Price Chart Signals Trouble – Is A Drop To $1.20 Possible?

2.52 Million Altcoins Are Ruining Crypto’s Future

Animoca Brands Valuation Tanks 75% In Two Years, Here’s Why

Crypto exchange BingX hacked for $43 million

Are The Big Players Losing Interest?

Hong Kong’s Securities Association Tips Authorities On Crypto Self-Regulation

Coinbase cbBTC Set to go Live on Solana
2.52 Million Altcoins Are Ruining Crypto’s Future
Animoca Brands Valuation Tanks 75% In Two Years, Here’s Why
Crypto exchange BingX hacked for $43 million
Are The Big Players Losing Interest?
Hong Kong’s Securities Association Tips Authorities On Crypto Self-Regulation
Coinbase cbBTC Set to go Live on Solana
-

 Ethereum21 hours ago
330,000 Ethereum Withdrawn From Exchanges In 72 Hours – Supply Squeeze Incoming?
-
 Regulation17 hours ago
Gemini Cofounder Reveals How Much David Sacks Will Lose In Crypto Gains In Four Years
-
 Altcoin23 hours ago
Tron Founder Justin Sun Asserts TRX Price Will Hit New ATH
-
 Altcoin21 hours ago
Analyst Confirms Dogecoin Price Can Reach $90, Here’s When
-

 Altcoin20 hours ago
Andre Cronje Outlines Reasons For Ethereum’s Underperformance This Cycle
-
 Altcoin17 hours ago
Cardano Price Could Be On Its Way To $2 — Here’s How
-

 Altcoin16 hours ago
Here’s Why The Dogecoin And Shiba Inu Prices Have Been On A Recovery Trend
-

 Ethereum14 hours ago
Ethereum Breaks Out Of Descending Triangle Pattern – Fakeout Or Recovery Rally?