
Market
PI Network Struggles to Hit $2 – More Losses Ahead?

Pi Network has witnessed a double-digit decline in the past week, shedding nearly 20% of its value. This price dip comes amid an uptick in the market’s volatility triggered by Donald Trump’s trade war, which has weighed heavily on investor sentiment across risk assets.
With bullish momentum fading, Pi Network remains vulnerable to further losses. This analysis explains why.
PI’s Decline Far From Over? Key Indicators Hint at Further Downside Risks
PI’s declining on-balance volume (OBV) on a four-hour chart confirms the surge in bearish pressure. Since March 6, this momentum indicator, which tracks money flow into and out of an asset, has trended downward, falling 20%.
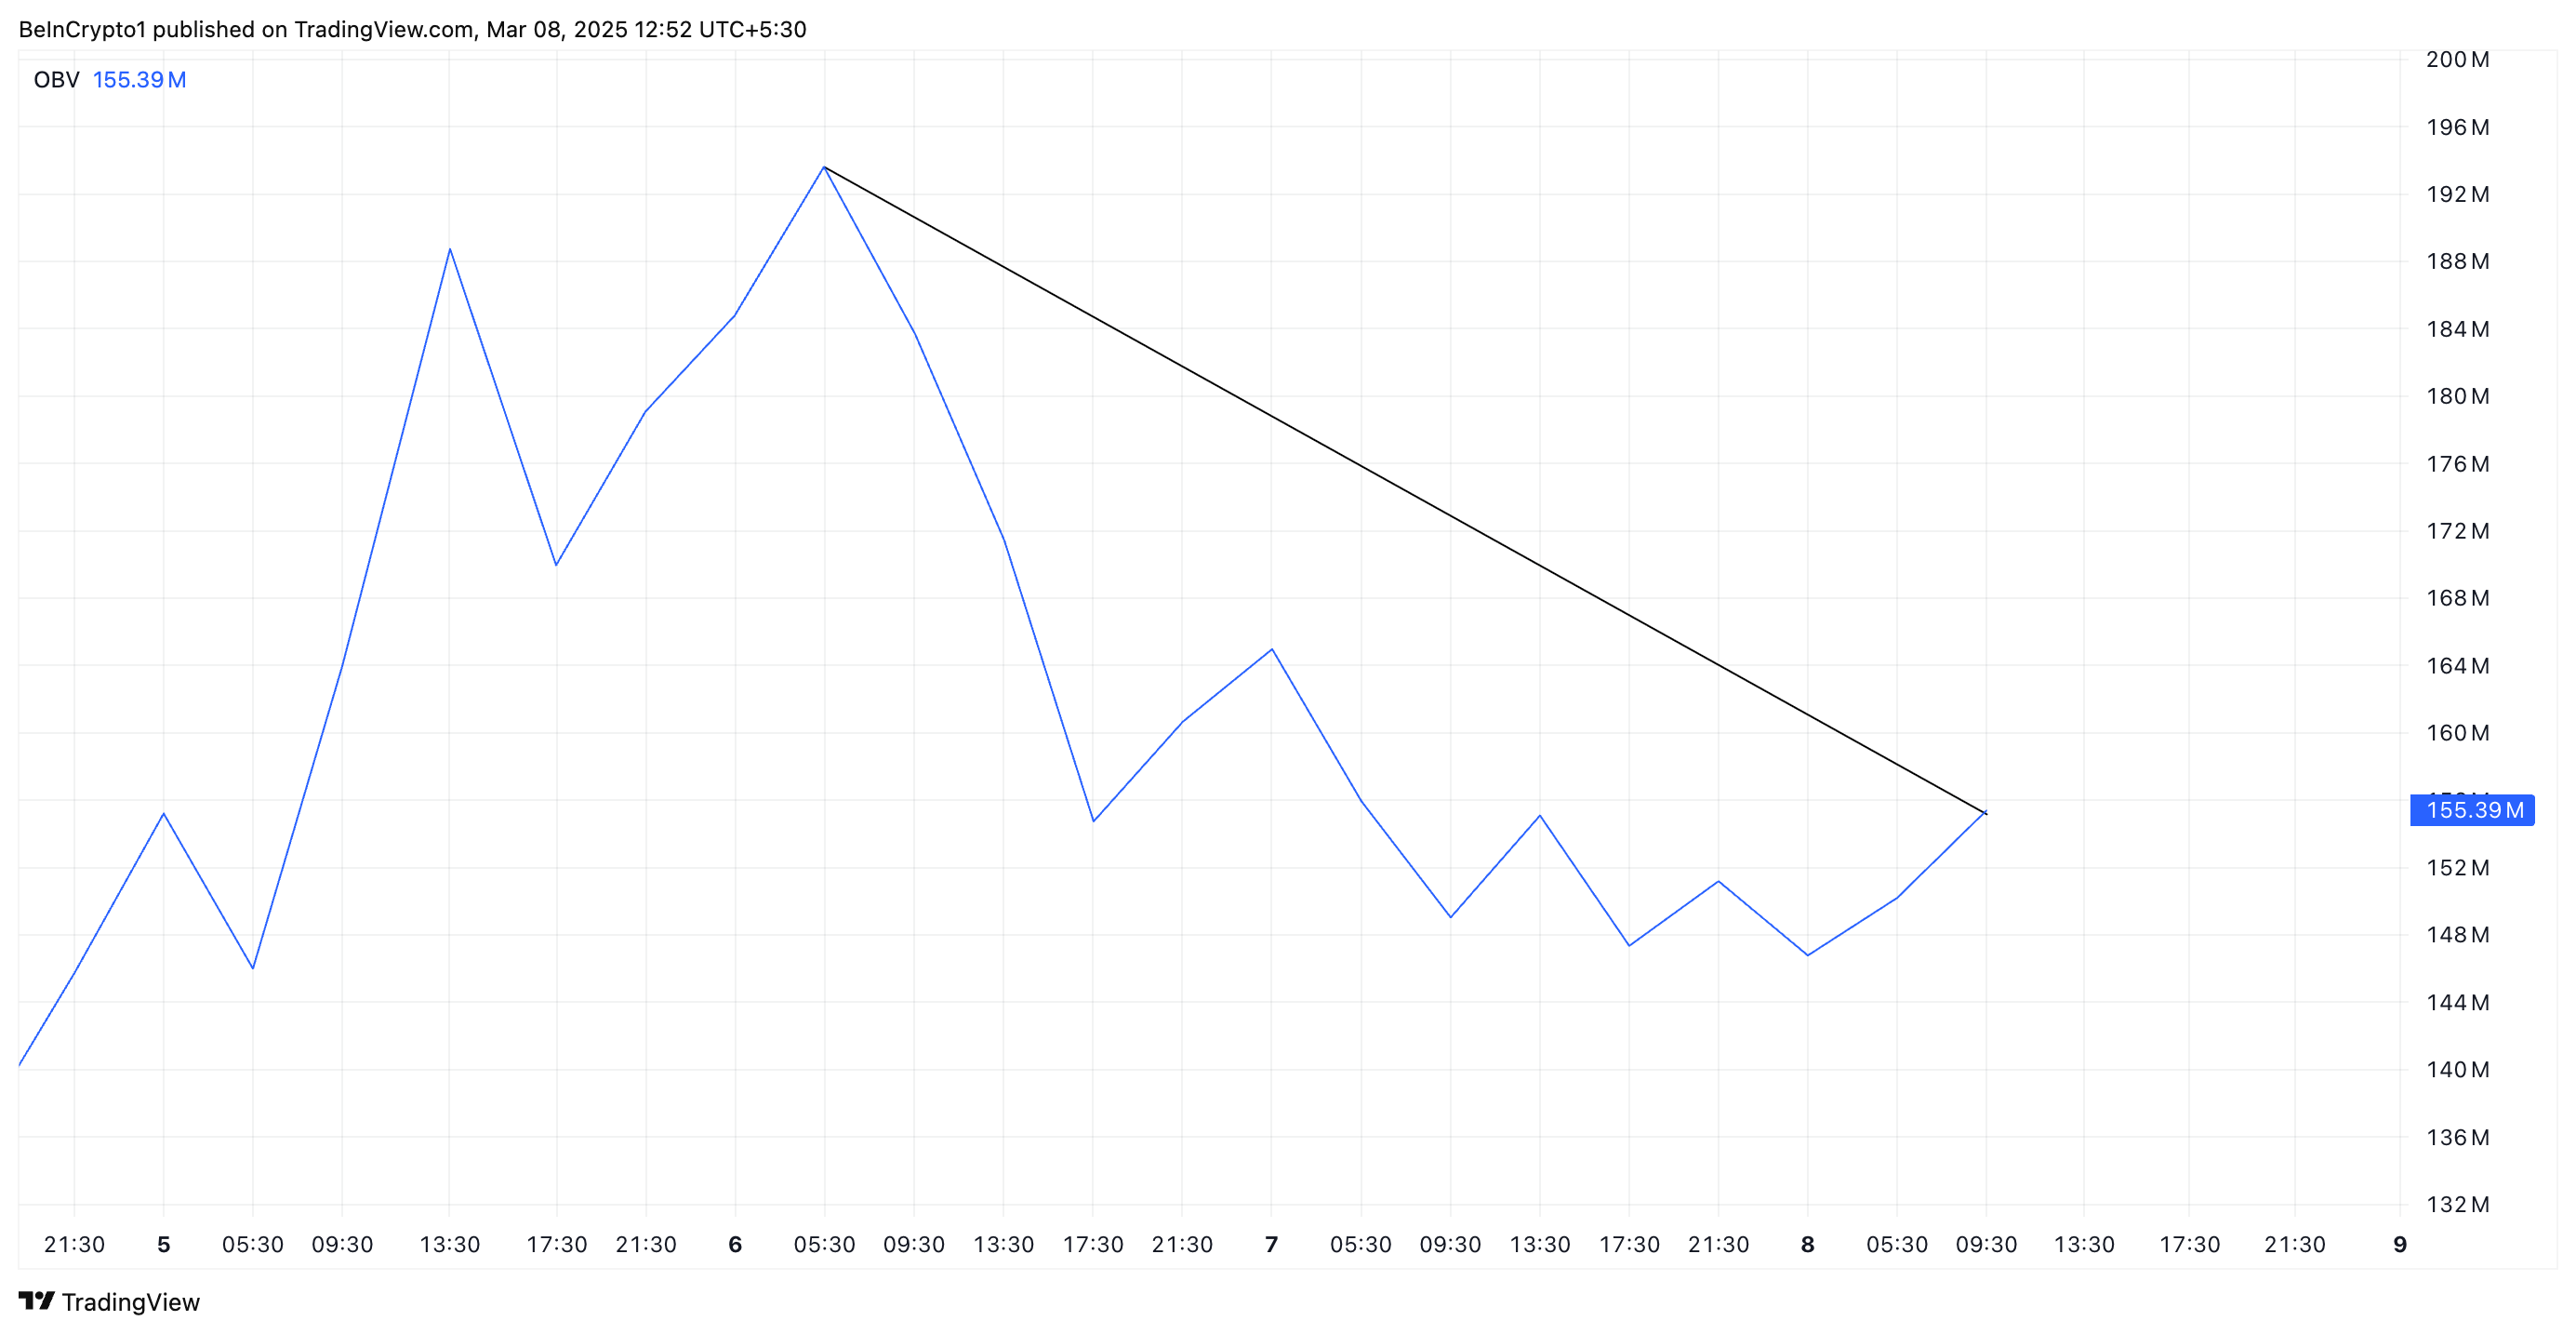
When an asset’s OBV falls, selling pressure outweighs buying pressure, as more volume is associated with price declines than price increases.
This suggests weakening momentum in the PI market and hints at the likelihood of a potential further downside as traders continue to offload their positions.
Further, readings from its Elder-Ray Index confirm this bearish outlook. At press time, the indicator posts a negative value of -0.0070, reflecting the high selloffs among market participants.
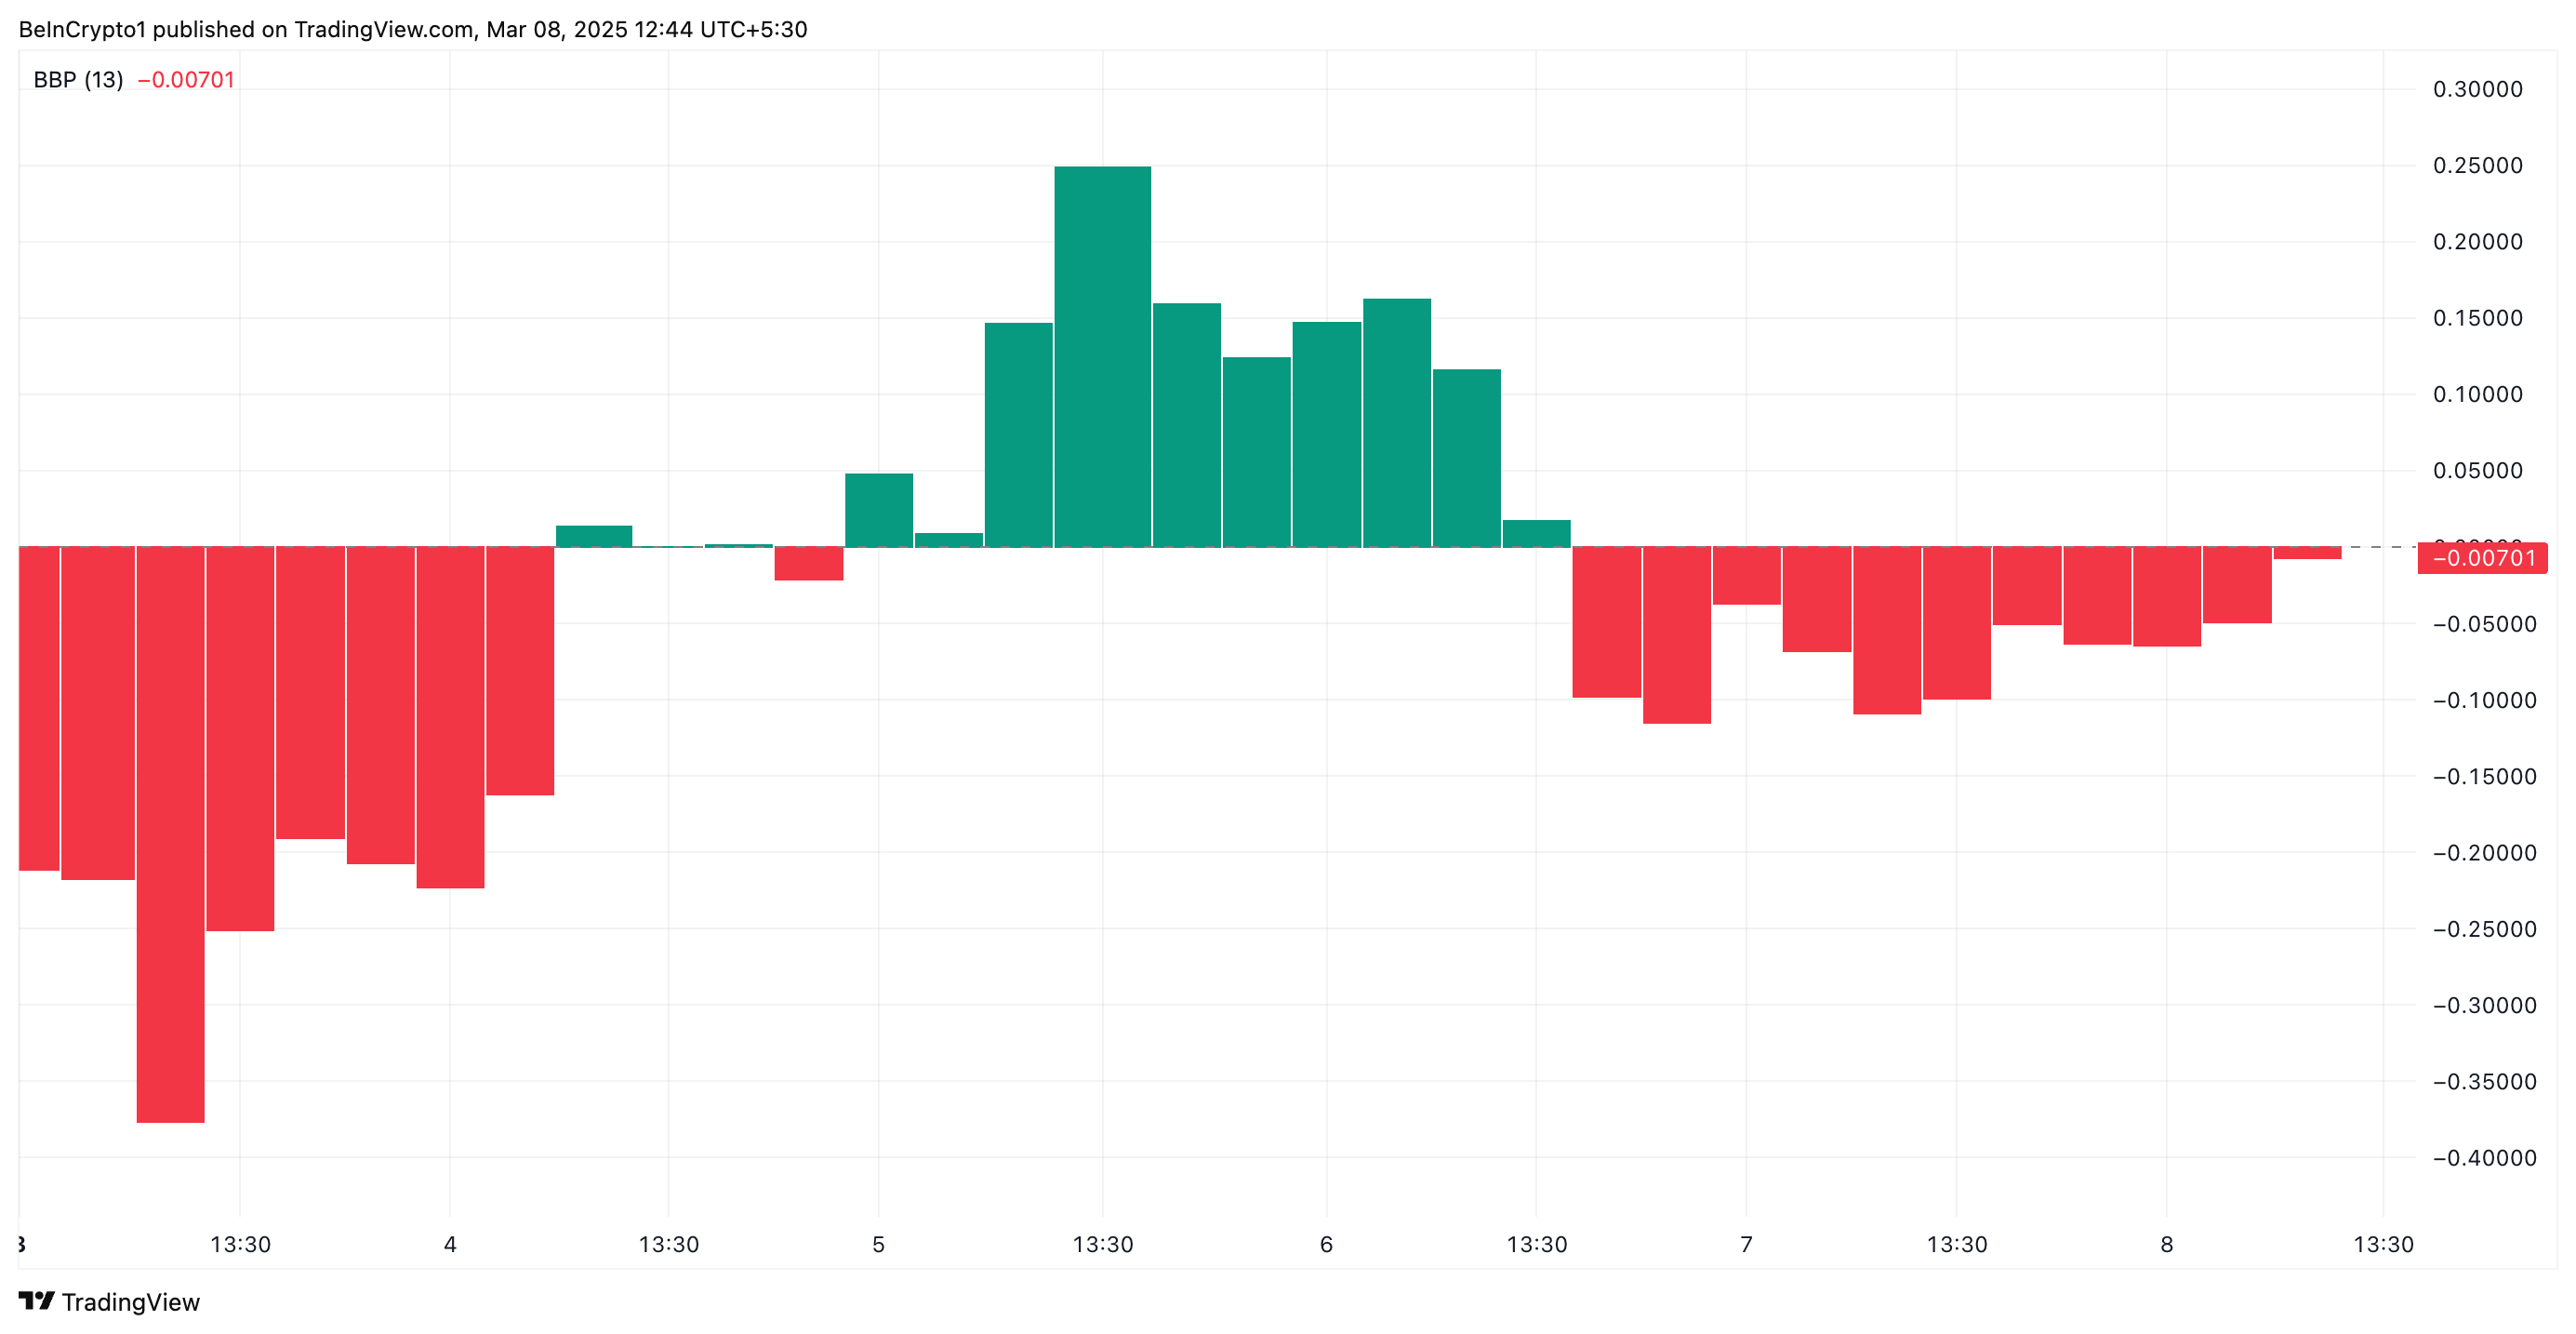
An asset’s Elder-Ray Index compares the strength of its bulls and bears in the market. When the index declines like this, it signals increasing bearish strength, suggesting that sellers are gaining control and downward pressure is intensifying.
Bulls vs. Bears: PI Faces Critical Battle Between $1.62 and $2.12
Pi Network currently trades at $1.80, resting above the support formed at $1.62. If sellofs strengthen, the bulls may be unable to defend this level. In this scenario, the altcoin’s value could plummet to $1.62.
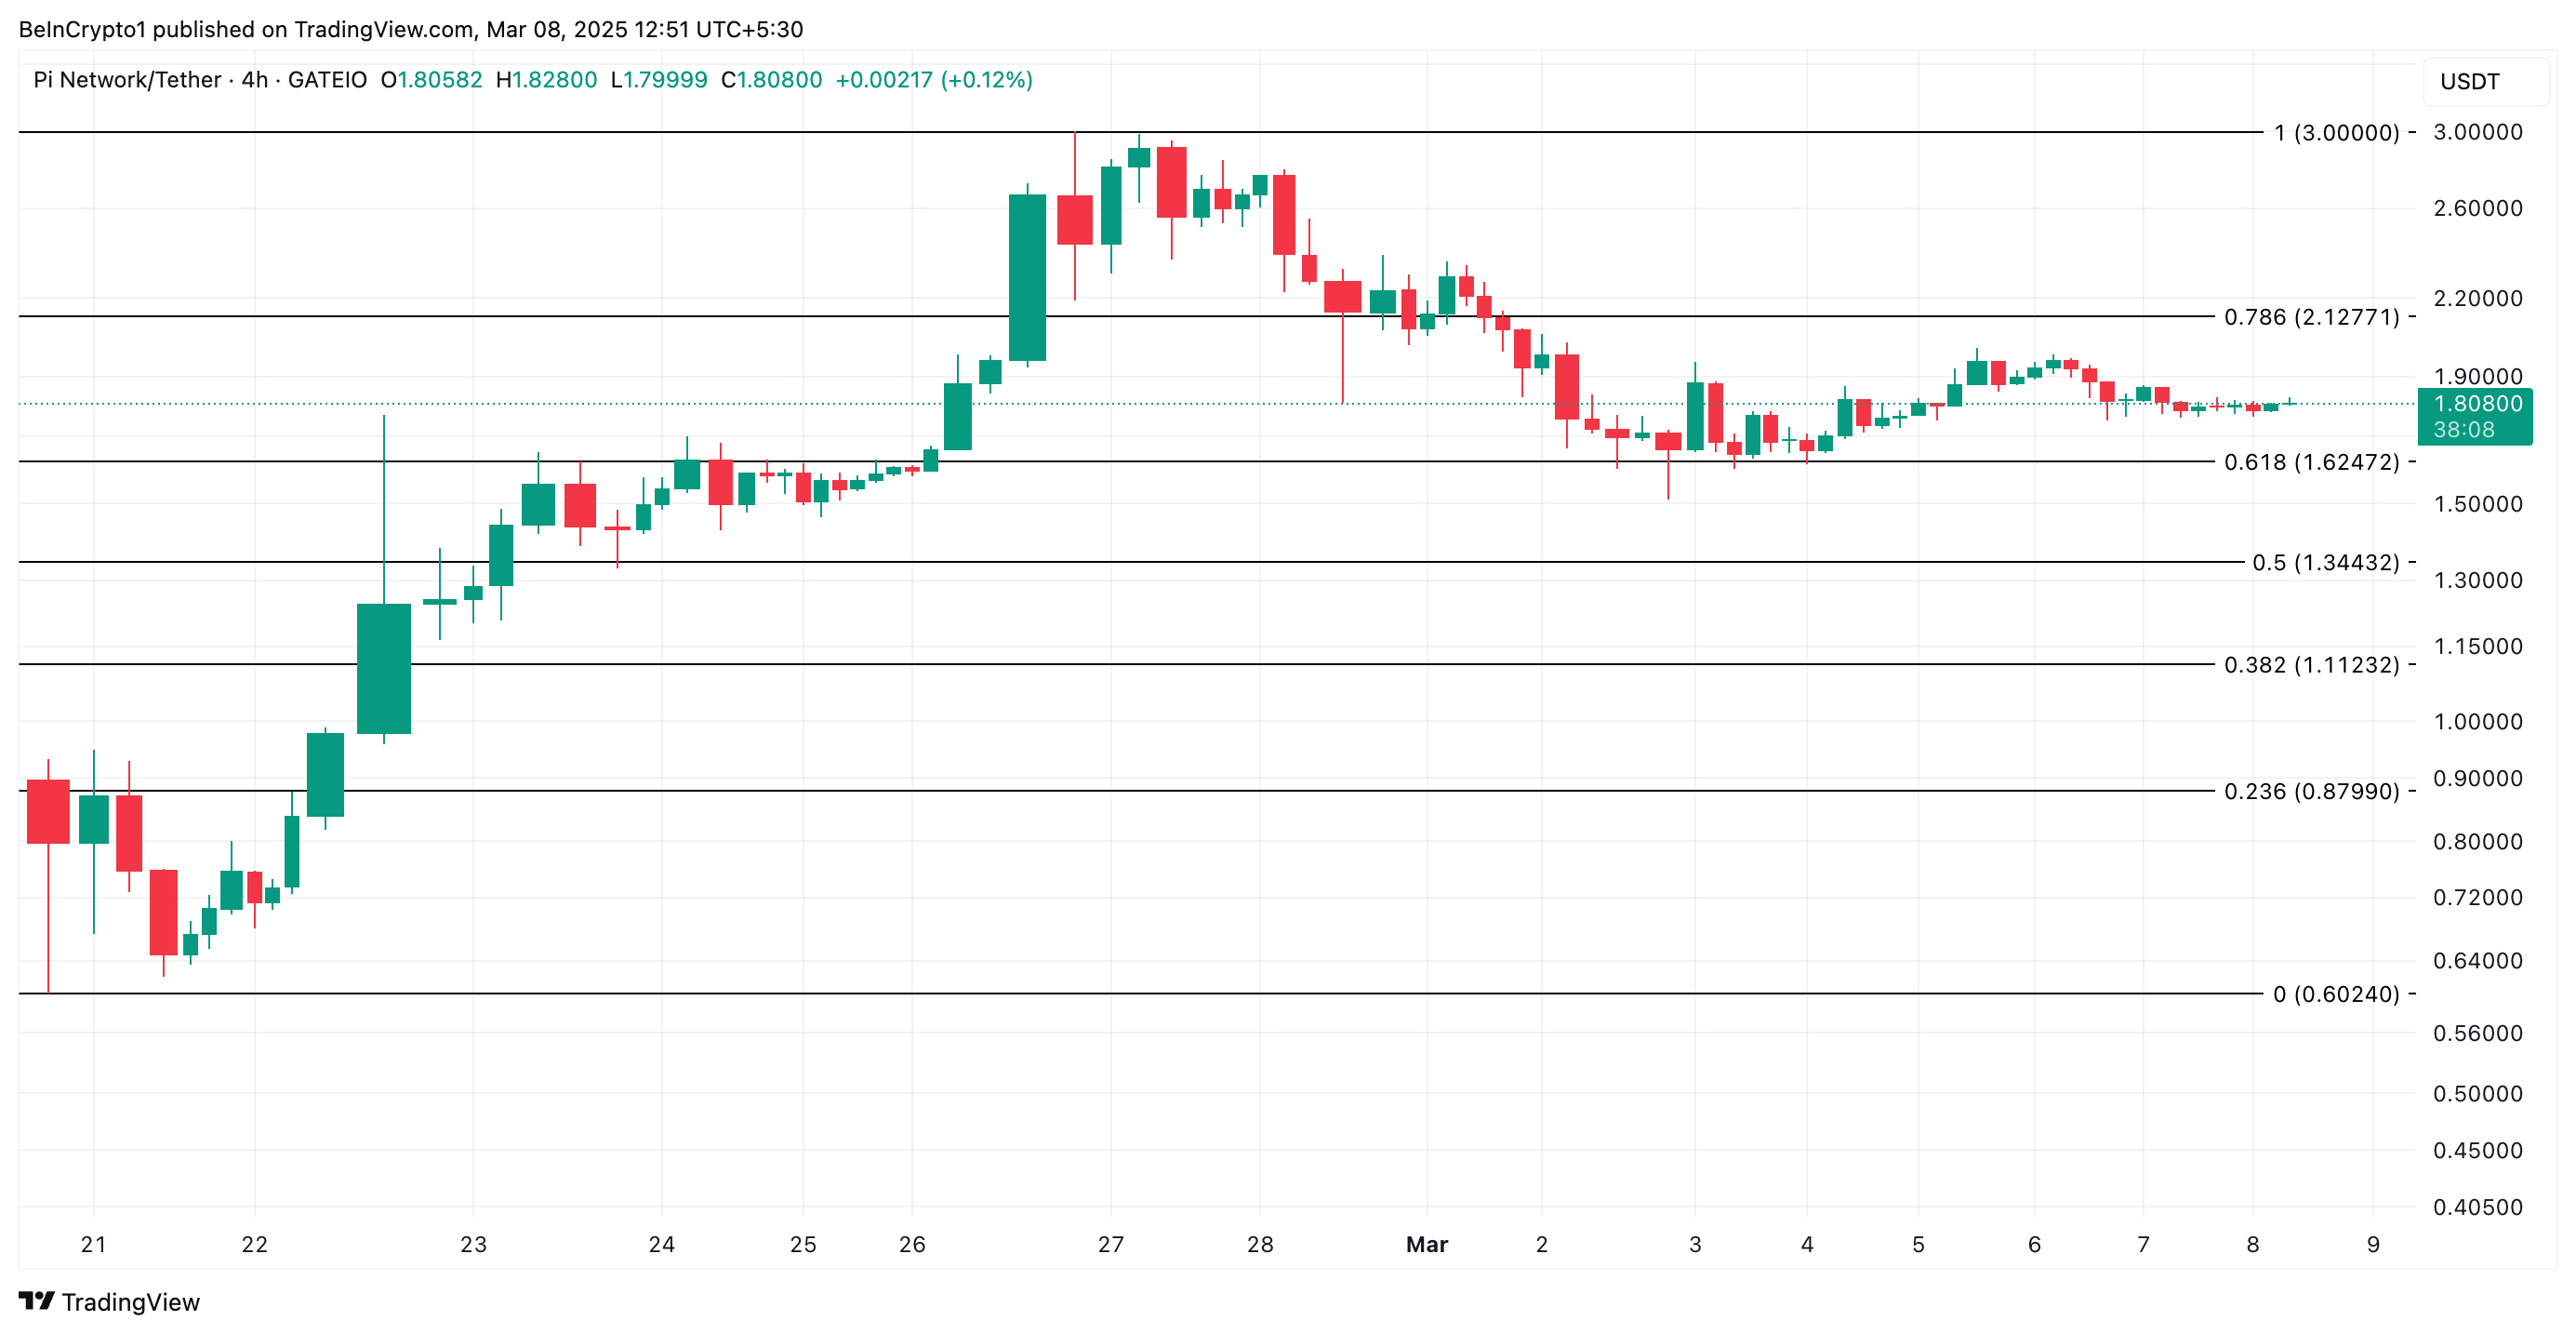
On the other hand, a resurgence in PI demand could invalidate this bearish projection. If the altcoin sees a rise in new demand, its price could rocket above $2 to trade at $2.12. A successful breach of this resistance could propel PI price to revisit its all-time high of $3.
Disclaimer
In line with the Trust Project guidelines, this price analysis article is for informational purposes only and should not be considered financial or investment advice. BeInCrypto is committed to accurate, unbiased reporting, but market conditions are subject to change without notice. Always conduct your own research and consult with a professional before making any financial decisions. Please note that our Terms and Conditions, Privacy Policy, and Disclaimers have been updated.


Arkham Intelligence has unveiled a new feature allowing users to track the wallets of Key Opinion Leaders (KOLs) on X (formerly Twitter).
This development comes amid a flurry of new meme coins, capitalizing on token launchpads for easy launches.
New Arkham Feature Lets Users Track Influencers’ Token Holdings
The update, announced in a recent post, introduces the “Key Opinion Leader (KOL) Label.” It tracks the wallets of influencers with over 100,000 followers on X.
“Influencers with more than 100K+ followers on Twitter/X are now tagged on Arkham with a new label: Key Opinion Leader,” read the announcement.
This means investors can monitor whether influencers genuinely back the tokens they promote or if their endorsements are merely paid advertising. The move has sparked widespread debate within the crypto community, particularly concerning its impact on influencer-endorsed meme coins.
“Biggest scammer on top! Now everyone can watch your wallets. But they should know y’all have multiple ones,” one user wrote.
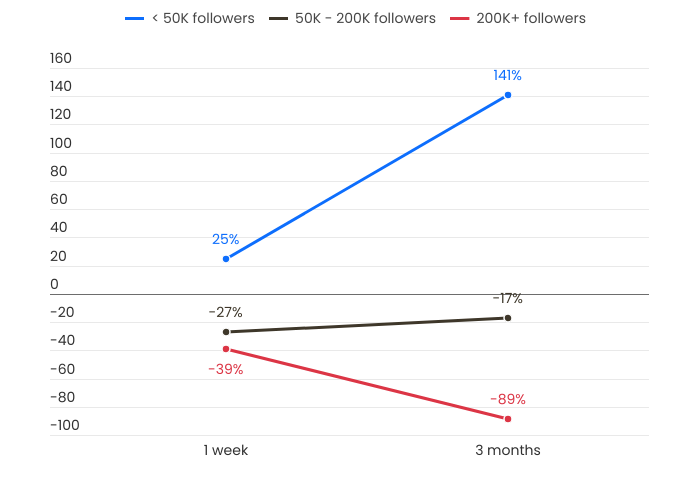
The introduction of Arkham’s KOL Label comes amid increasing concerns over the reliability of influencer-backed tokens. A recent report revealed that 76% of influencer-endorsed tokens fail to deliver.
Specifically, their value plummeted by more than 90% within just three months.
As BeInCrypto reported, the research suggested earning up to $399 per promotional tweet, incentivizing certain influencers to prioritize financial gain over credibility.
It also showed that many promoted tokens lack fundamental utility and community engagement, leading to inevitable crashes.
“Influencers with over 200,000 followers tend to have the worst performance. The larger the influencer’s following, the lower the performance of the meme coins they promote,” the report claims.
Similarly, blockchain investigator ZachXBT recently exposed 16 influencer accounts on X that coordinated pump-and-dump schemes, leaving their followers to absorb the losses. This fueled debates about the ethical responsibilities of influencers in crypto markets.
With Arkham’s new tracking feature, investors can now scrutinize whether influencers hold the tokens they endorse. This could provide greater transparency in an industry plagued by misinformation and deceptive marketing tactics.
“Interesting move—transparency meets influence,” a user on X remarked.
The pattern mirrors previous crypto fads, where early investors profit while latecomers bear the brunt of financial losses. Arkham’s new tool could expose questionable practices, distinguishing genuine endorsements from misleading promotions.
By tracking influencers’ wallet activities, users can identify whether influencers hold the tokens they promote, indicating a true conviction. They could also spot red flags, such as influencers dumping tokens shortly after promoting them.
Experts, including Tron founder Justin Sun, emphasize the importance of fundamentals, tokenomics, and risk management for investors within the volatile meme coin market.
“I will check on the real social engagement. Are those likes real, or it’s just general bullshit? Do they have lots of influence, and the people really believe them? Also, I will see the founders, see their material, and see the memes they made and the videos they made. I will see if this is the right video and the right social engagement,” Sun elaborated.
These approaches reflect the importance of caution and due diligence instead of relying solely on influencer endorsement.
Disclaimer
In adherence to the Trust Project guidelines, BeInCrypto is committed to unbiased, transparent reporting. This news article aims to provide accurate, timely information. However, readers are advised to verify facts independently and consult with a professional before making any decisions based on this content. Please note that our Terms and Conditions, Privacy Policy, and Disclaimers have been updated.

Leading meme coin Shiba Inu has shed almost 10% of its value over the past week. As of this writing, SHIB trades at $0.0000125.
This price decline coincides with a significant drop in whale holdings during the same period. This signals waning confidence among large investors amid broader market weakness.
SHIB’s Market Confidence Wanes as Whale Sell-Off Accelerates
According to IntoTheBlock, SHIB’s large holders ’netflow has fallen 123% in the past week. This comes amid the meme coin’s 8% price dip.
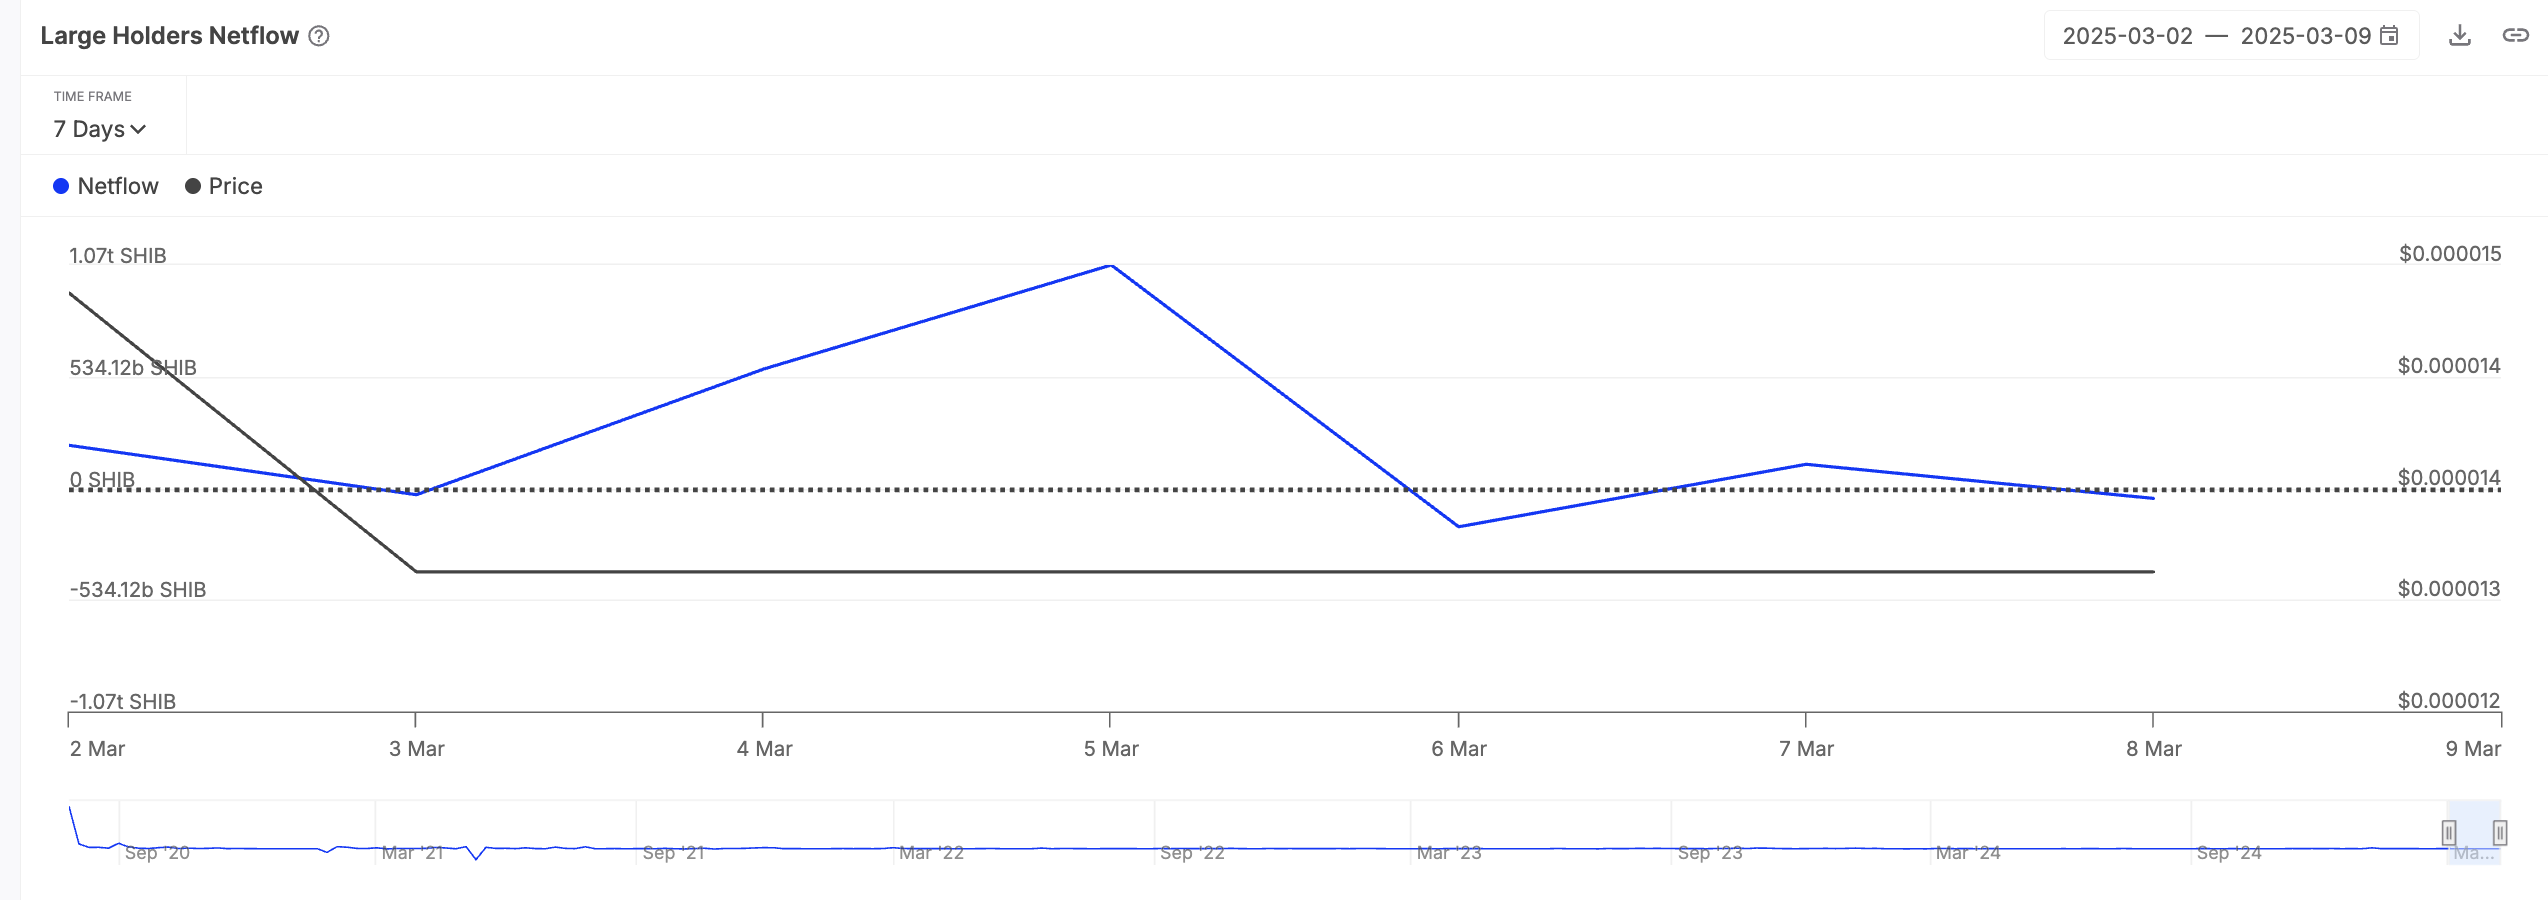
Large holders refer to whale addresses that hold more than 0.1% of an asset’s circulating supply. Their netflow measures the inflow and outflow of tokens in their wallets to track whether they are accumulating (positive netflow) or offloading (negative netflow) their holdings.
When this metric falls, it indicates that whales are selling large portions of their assets, leading to increased supply and putting more downward pressure on price.
Moreover, this decline in SHIB whale netflow could worsen the weakening confidence among SHIB retail traders, prompting them to sell their coins in anticipation of further losses. This can accelerate SHIB’s price dip in the short term.
On the daily chart, SHIB’s falling Relative Strength Index supports this bearish outlook. At press time, this momentum indicator is a downward trend at 35.34.
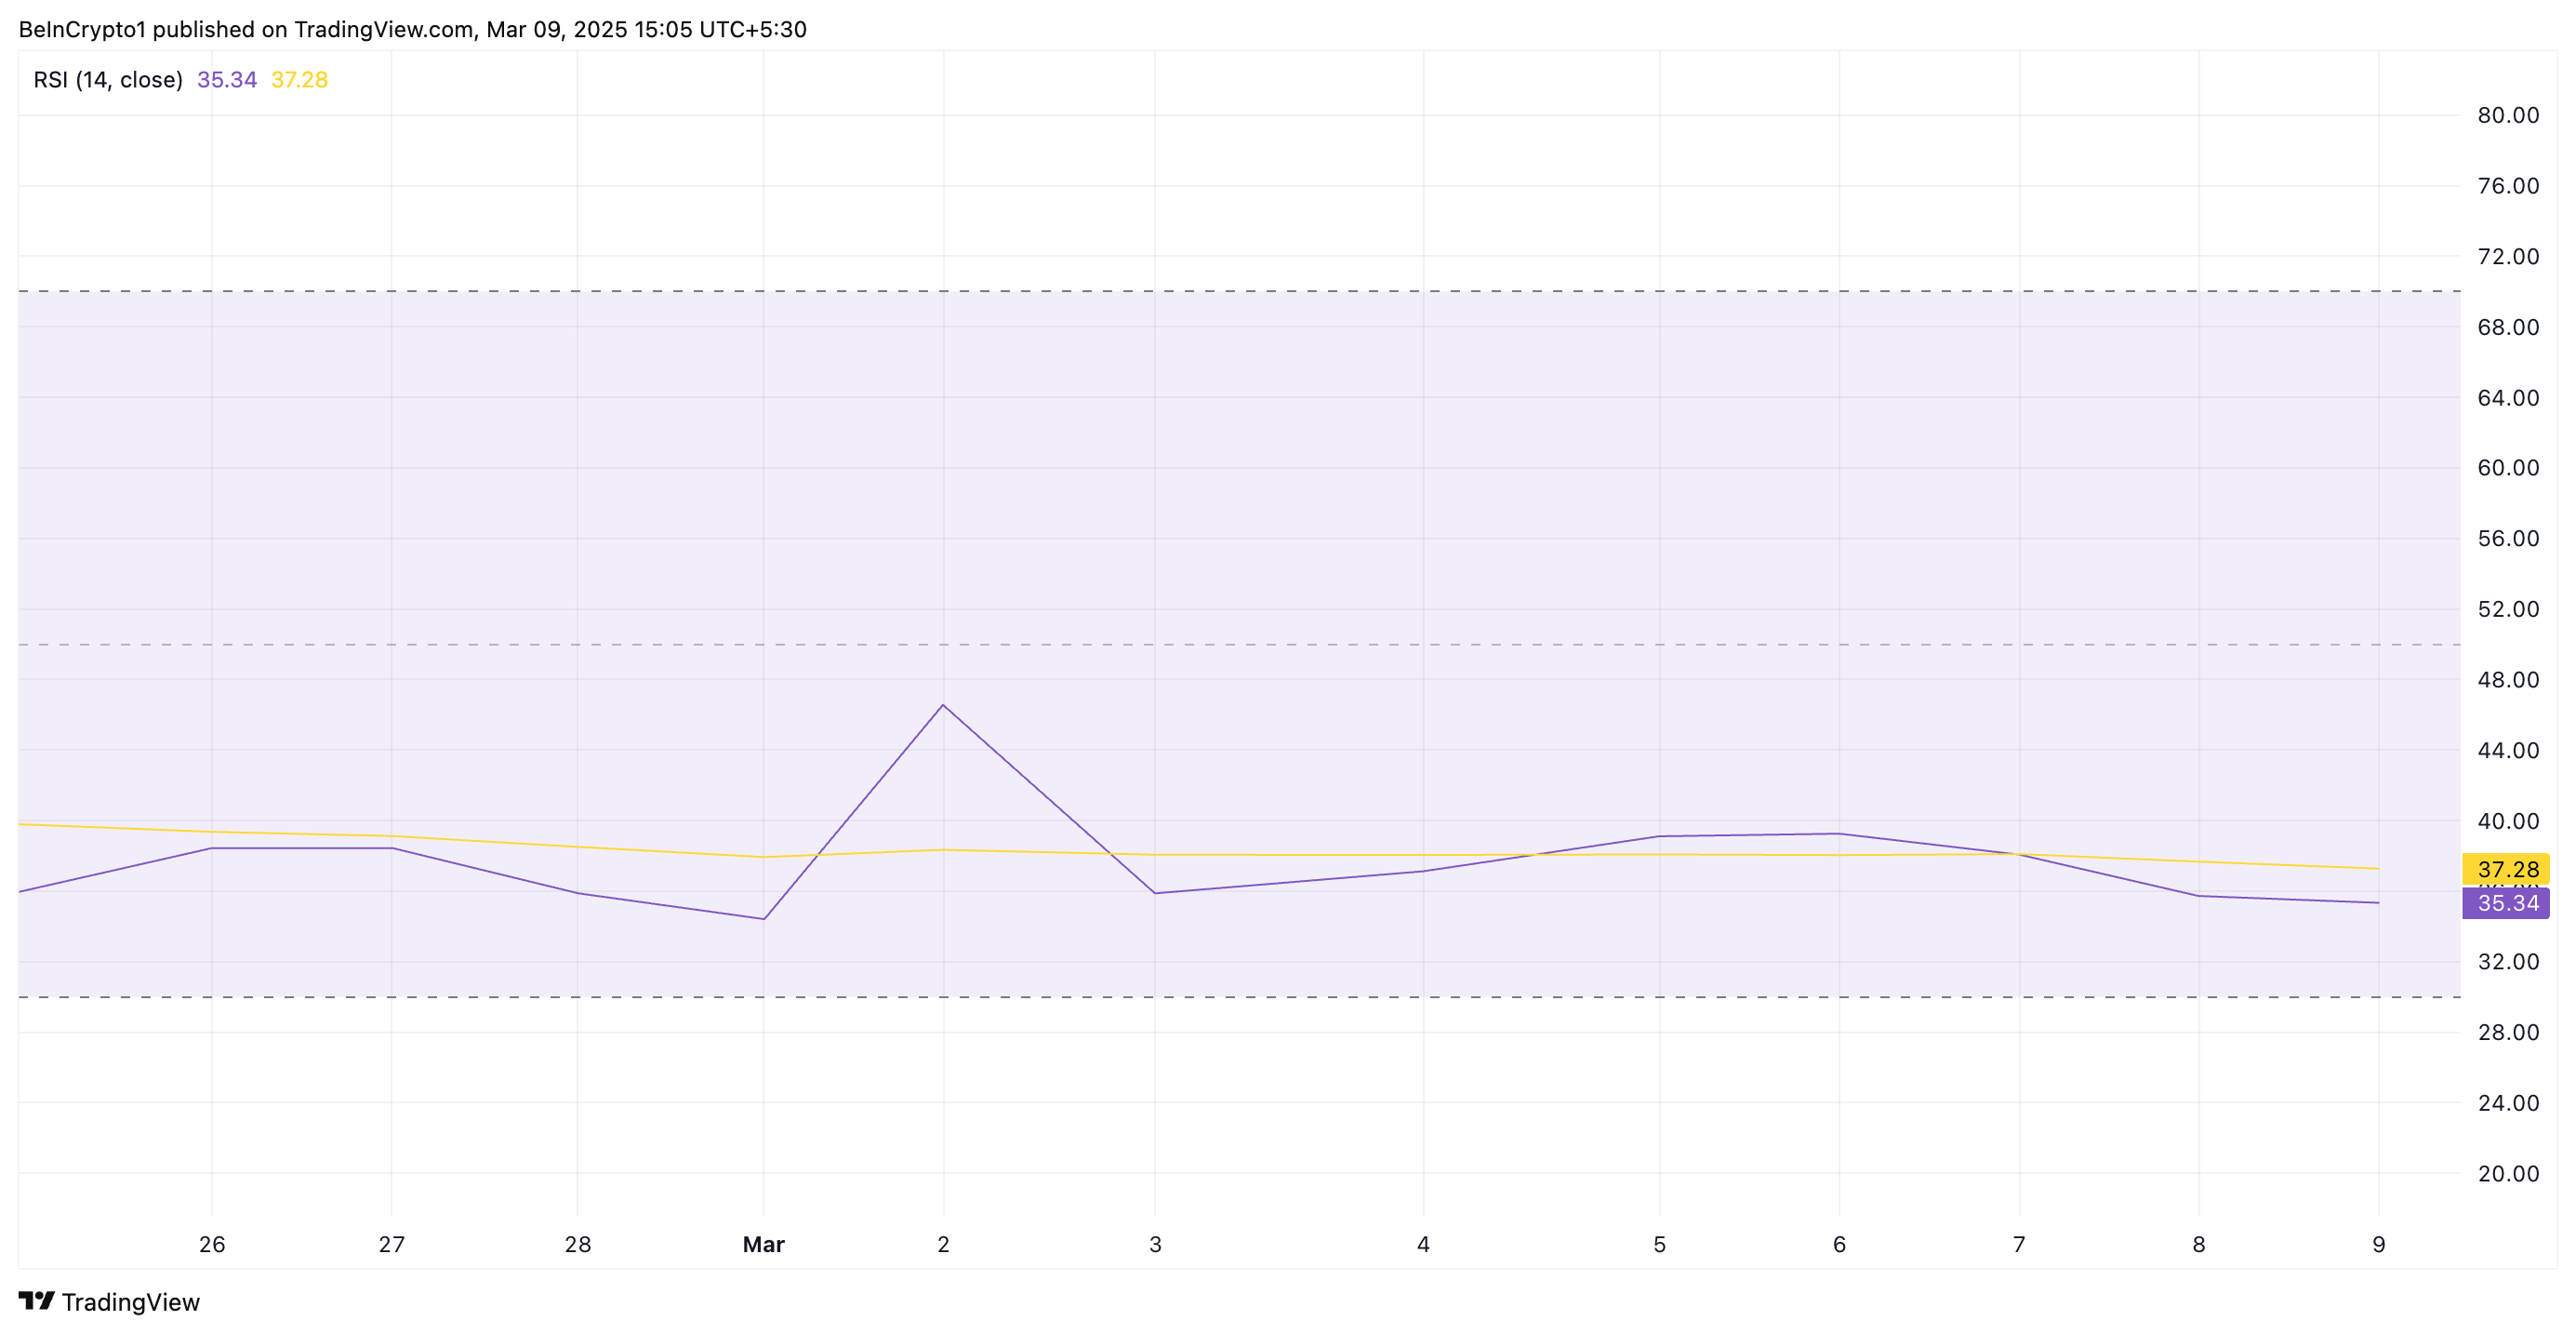
An asset’s RSI measures an asset’s oversold and overbought conditions. It ranges between 0 and 100, with values above 70 indicating that the asset is overbought and due for a decline. Conversely, values under 30 suggest that the asset is oversold and could witness a rebound.
At 35.05, SHIB’s RSI indicates that the asset is approaching oversold territory but has not fully entered it yet. This suggests weakening buying pressure and hints at the potential for further downside unless the meme coin demand picks up.
SHIB Holds Below Descending Trend Line
SHIB has remained below a descending trend line since December 8, keeping its price in decline. This pattern is formed when an asset’s price consistently makes lower highs over a period, connecting these peaks with a downward-sloping line. It is a bearish trend, indicating sustained selling pressure among SHIB market participants.
If this decline continues, SHIB risks falling to a seven-month low of $0.0000107.
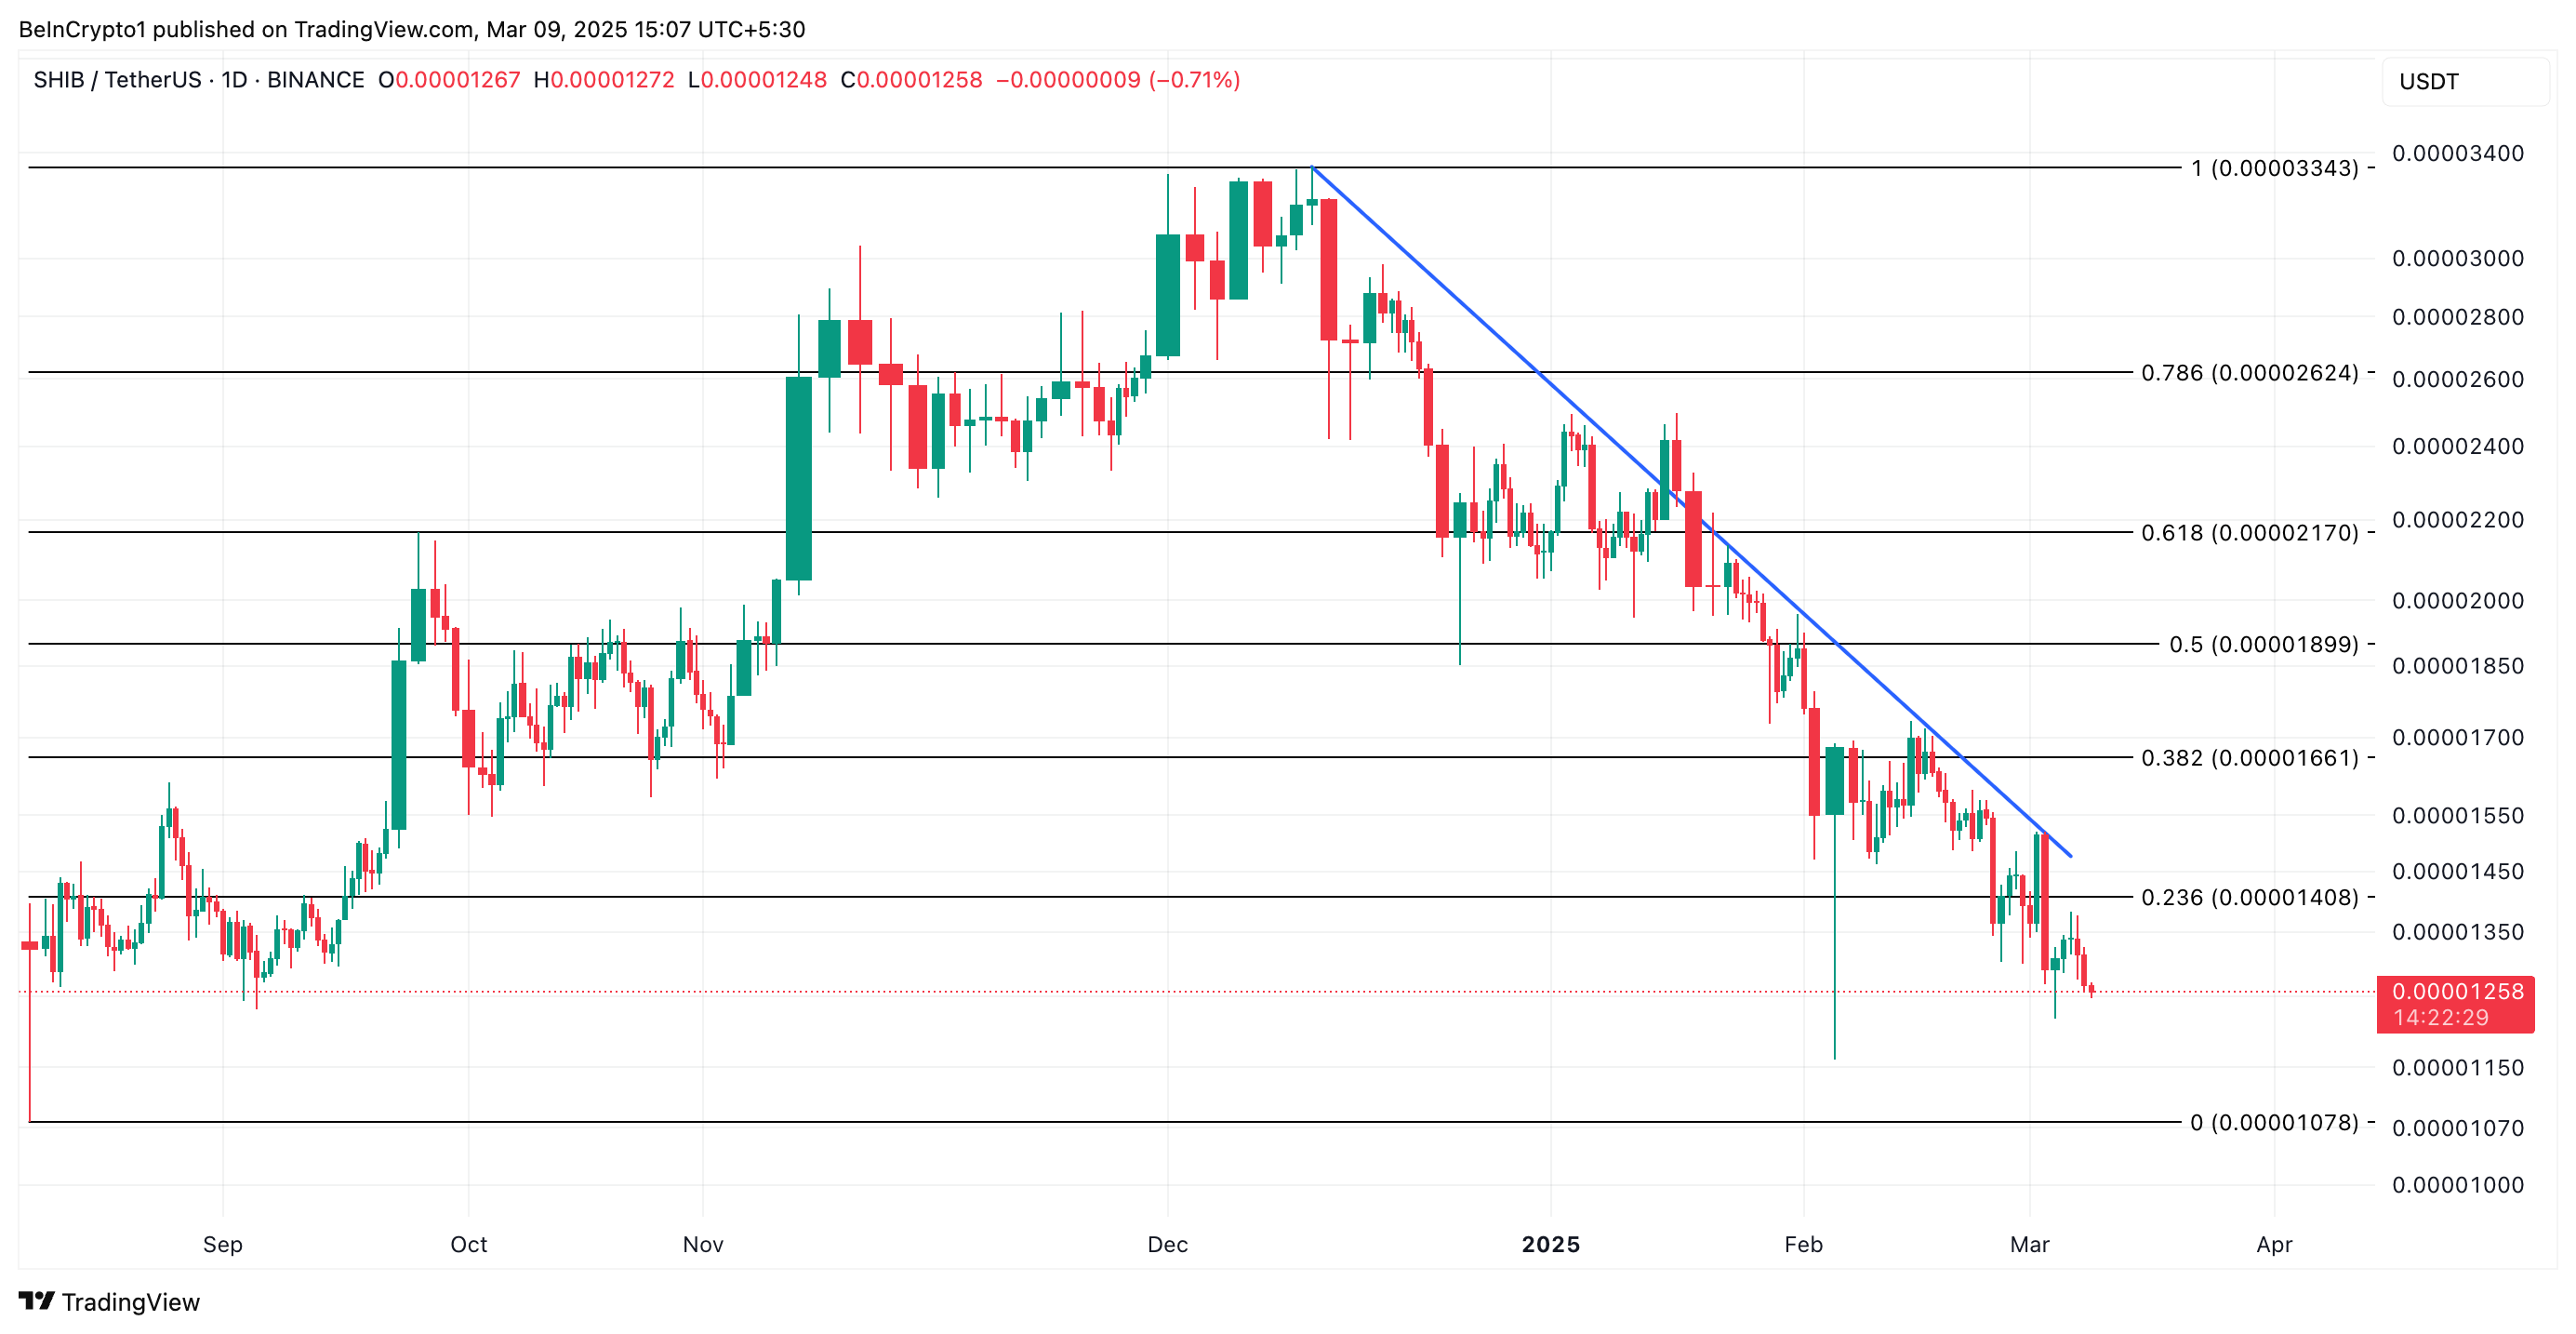
However, if buying pressure regains momentum, it could drive SHIB’s value to $0.0000166.
Disclaimer
In line with the Trust Project guidelines, this price analysis article is for informational purposes only and should not be considered financial or investment advice. BeInCrypto is committed to accurate, unbiased reporting, but market conditions are subject to change without notice. Always conduct your own research and consult with a professional before making any financial decisions. Please note that our Terms and Conditions, Privacy Policy, and Disclaimers have been updated.

SafeMoon’s price has climbed over 25% in the past week amid the broader market volatility. This double-digit price gain has been fueled by the uptick in the token’s demand following the project’s migration from BNB Chain to Solana.
However, profit-taking and increased selling pressure are now threatening to erase some of SFM’s recent gains. This analysis provides the details.
SafeMoon Battles Growing Sell-Offs
An assessment of the SFM/USD one-day chart highlights the growing selling pressure within SFM’s spot markets. A notable indicator of this trend is the token’s negative Balance of Power (BoP), which is at -0.96 at press time.
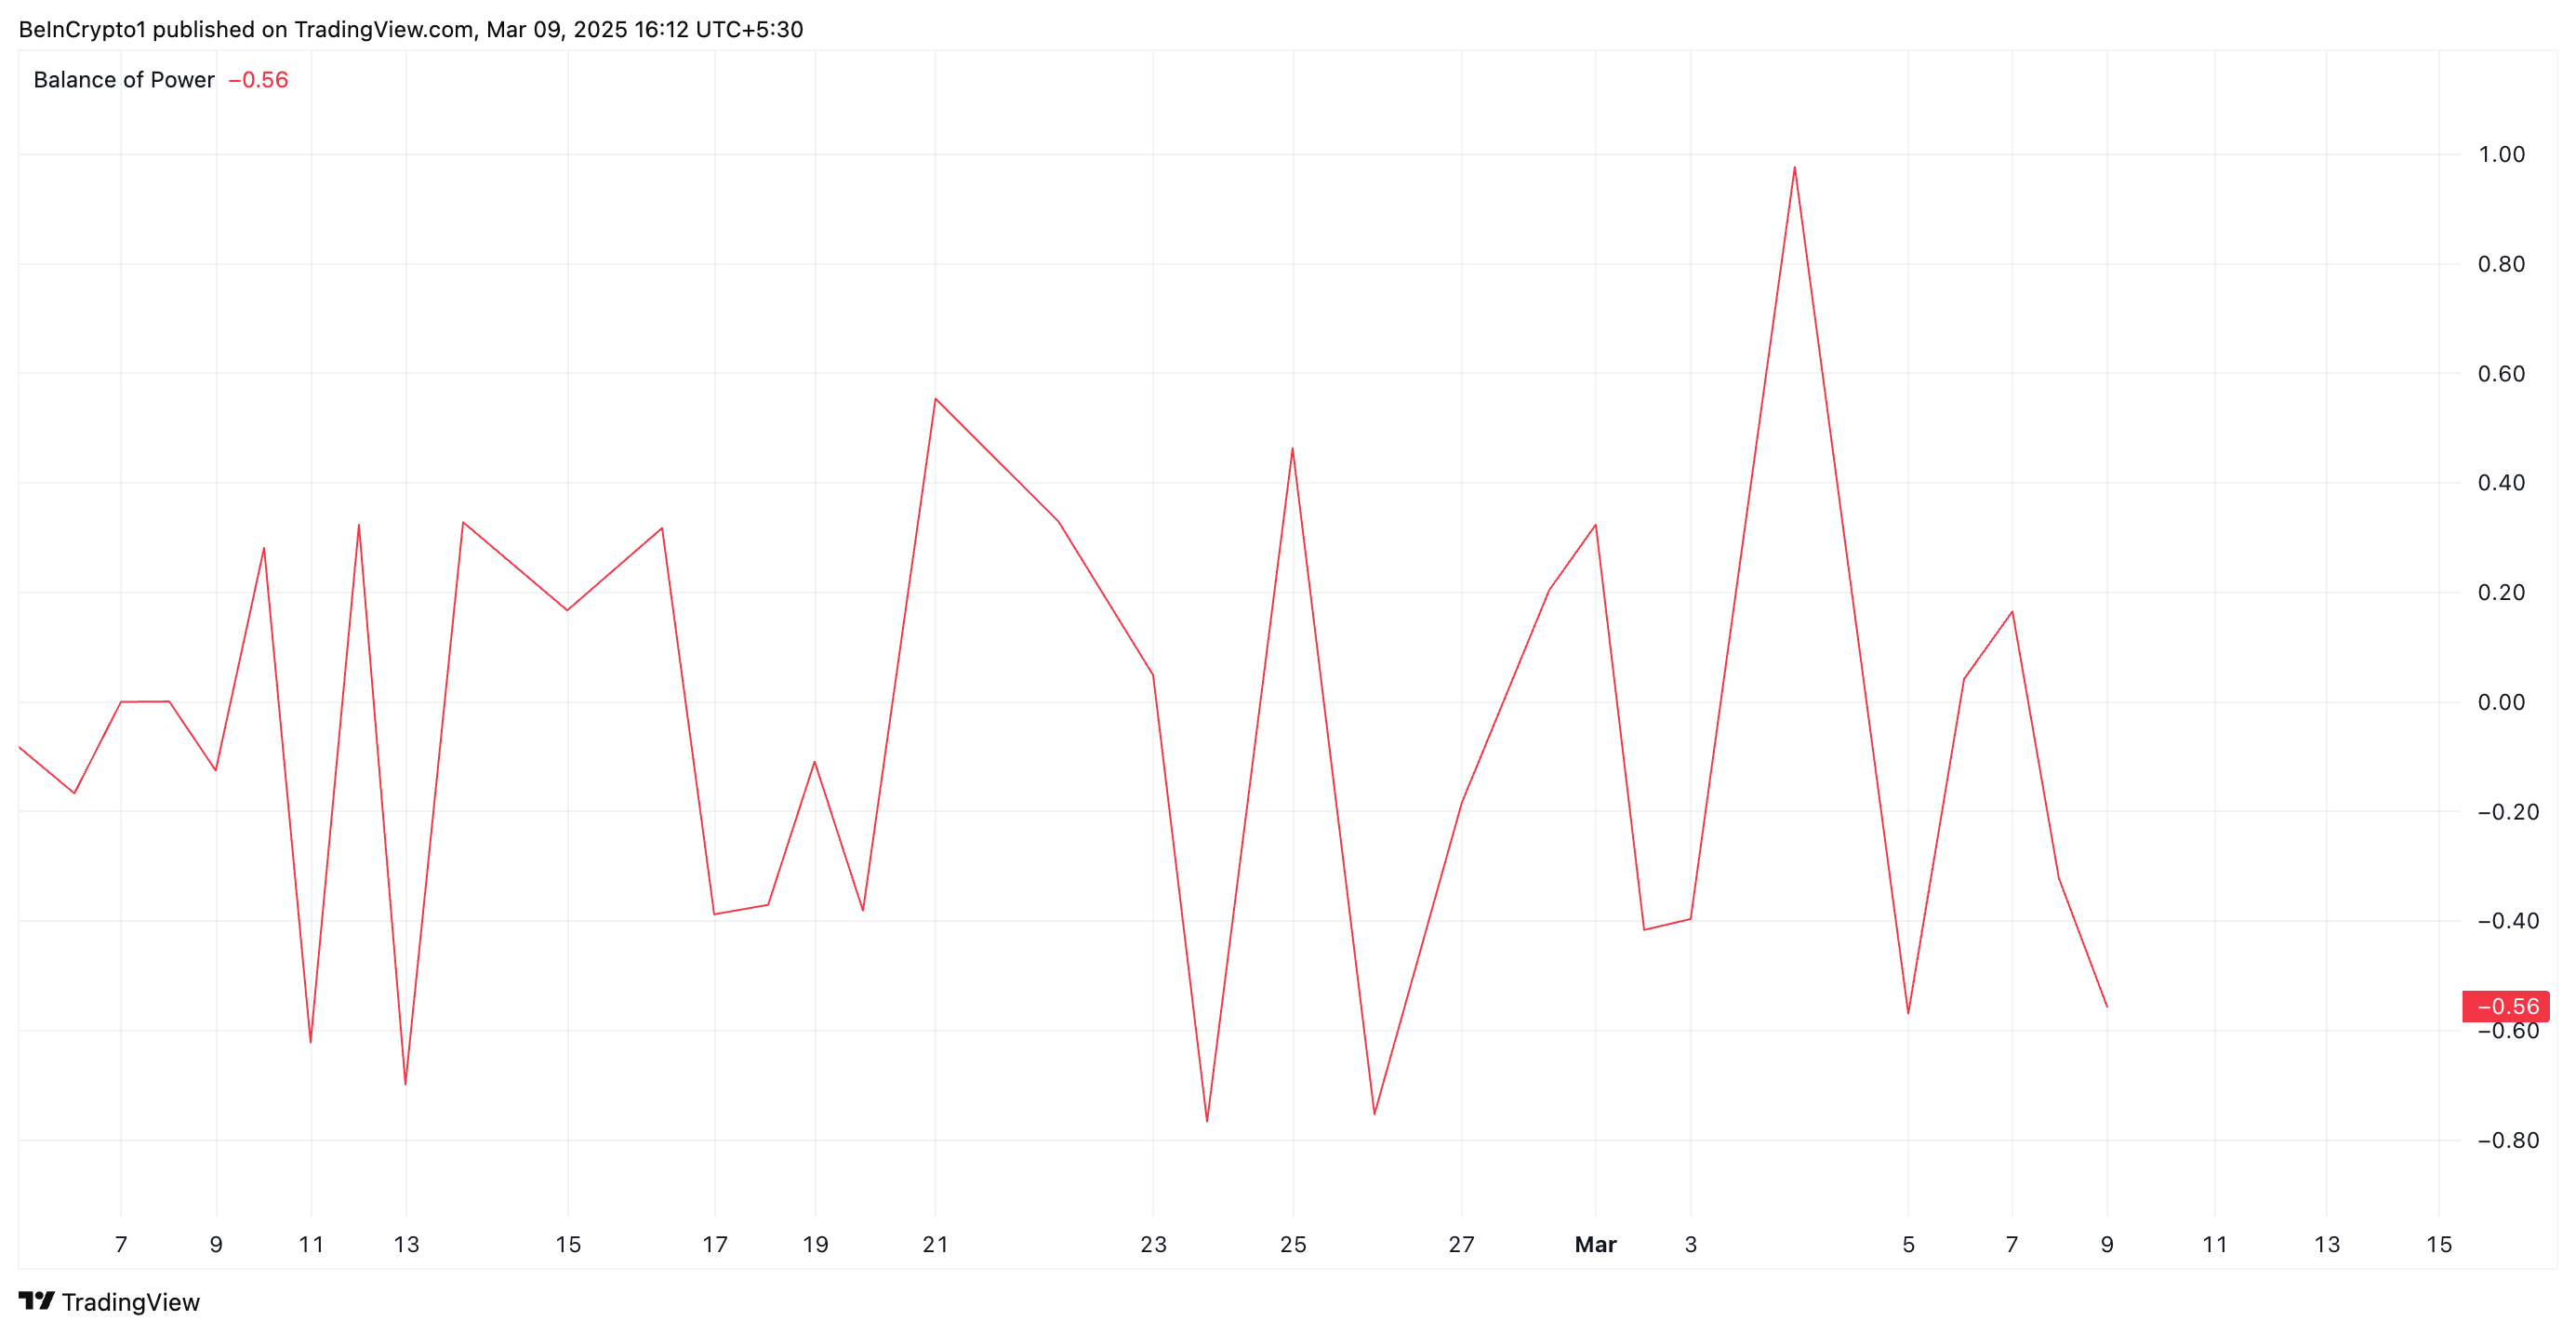
An asset’s BoP indicator compares buyers’ and sellers’ strengths by analyzing price movements within a given period. When its value is negative like this, it indicates that sellers have more control, meaning downward pressure is stronger, and the asset is likely experiencing a bearish trend.
This suggests weakening bullish momentum among SFM holders and hints at declines if selling pressure continues.
Furthermore, SFM’s price has dropped 8% over the past 24 hours, causing the altcoin to trade near its 20-day exponential moving average (EMA).
This moving average measures an asset’s average price over the past 20 trading days, giving more weight to recent prices to identify short-term trends.
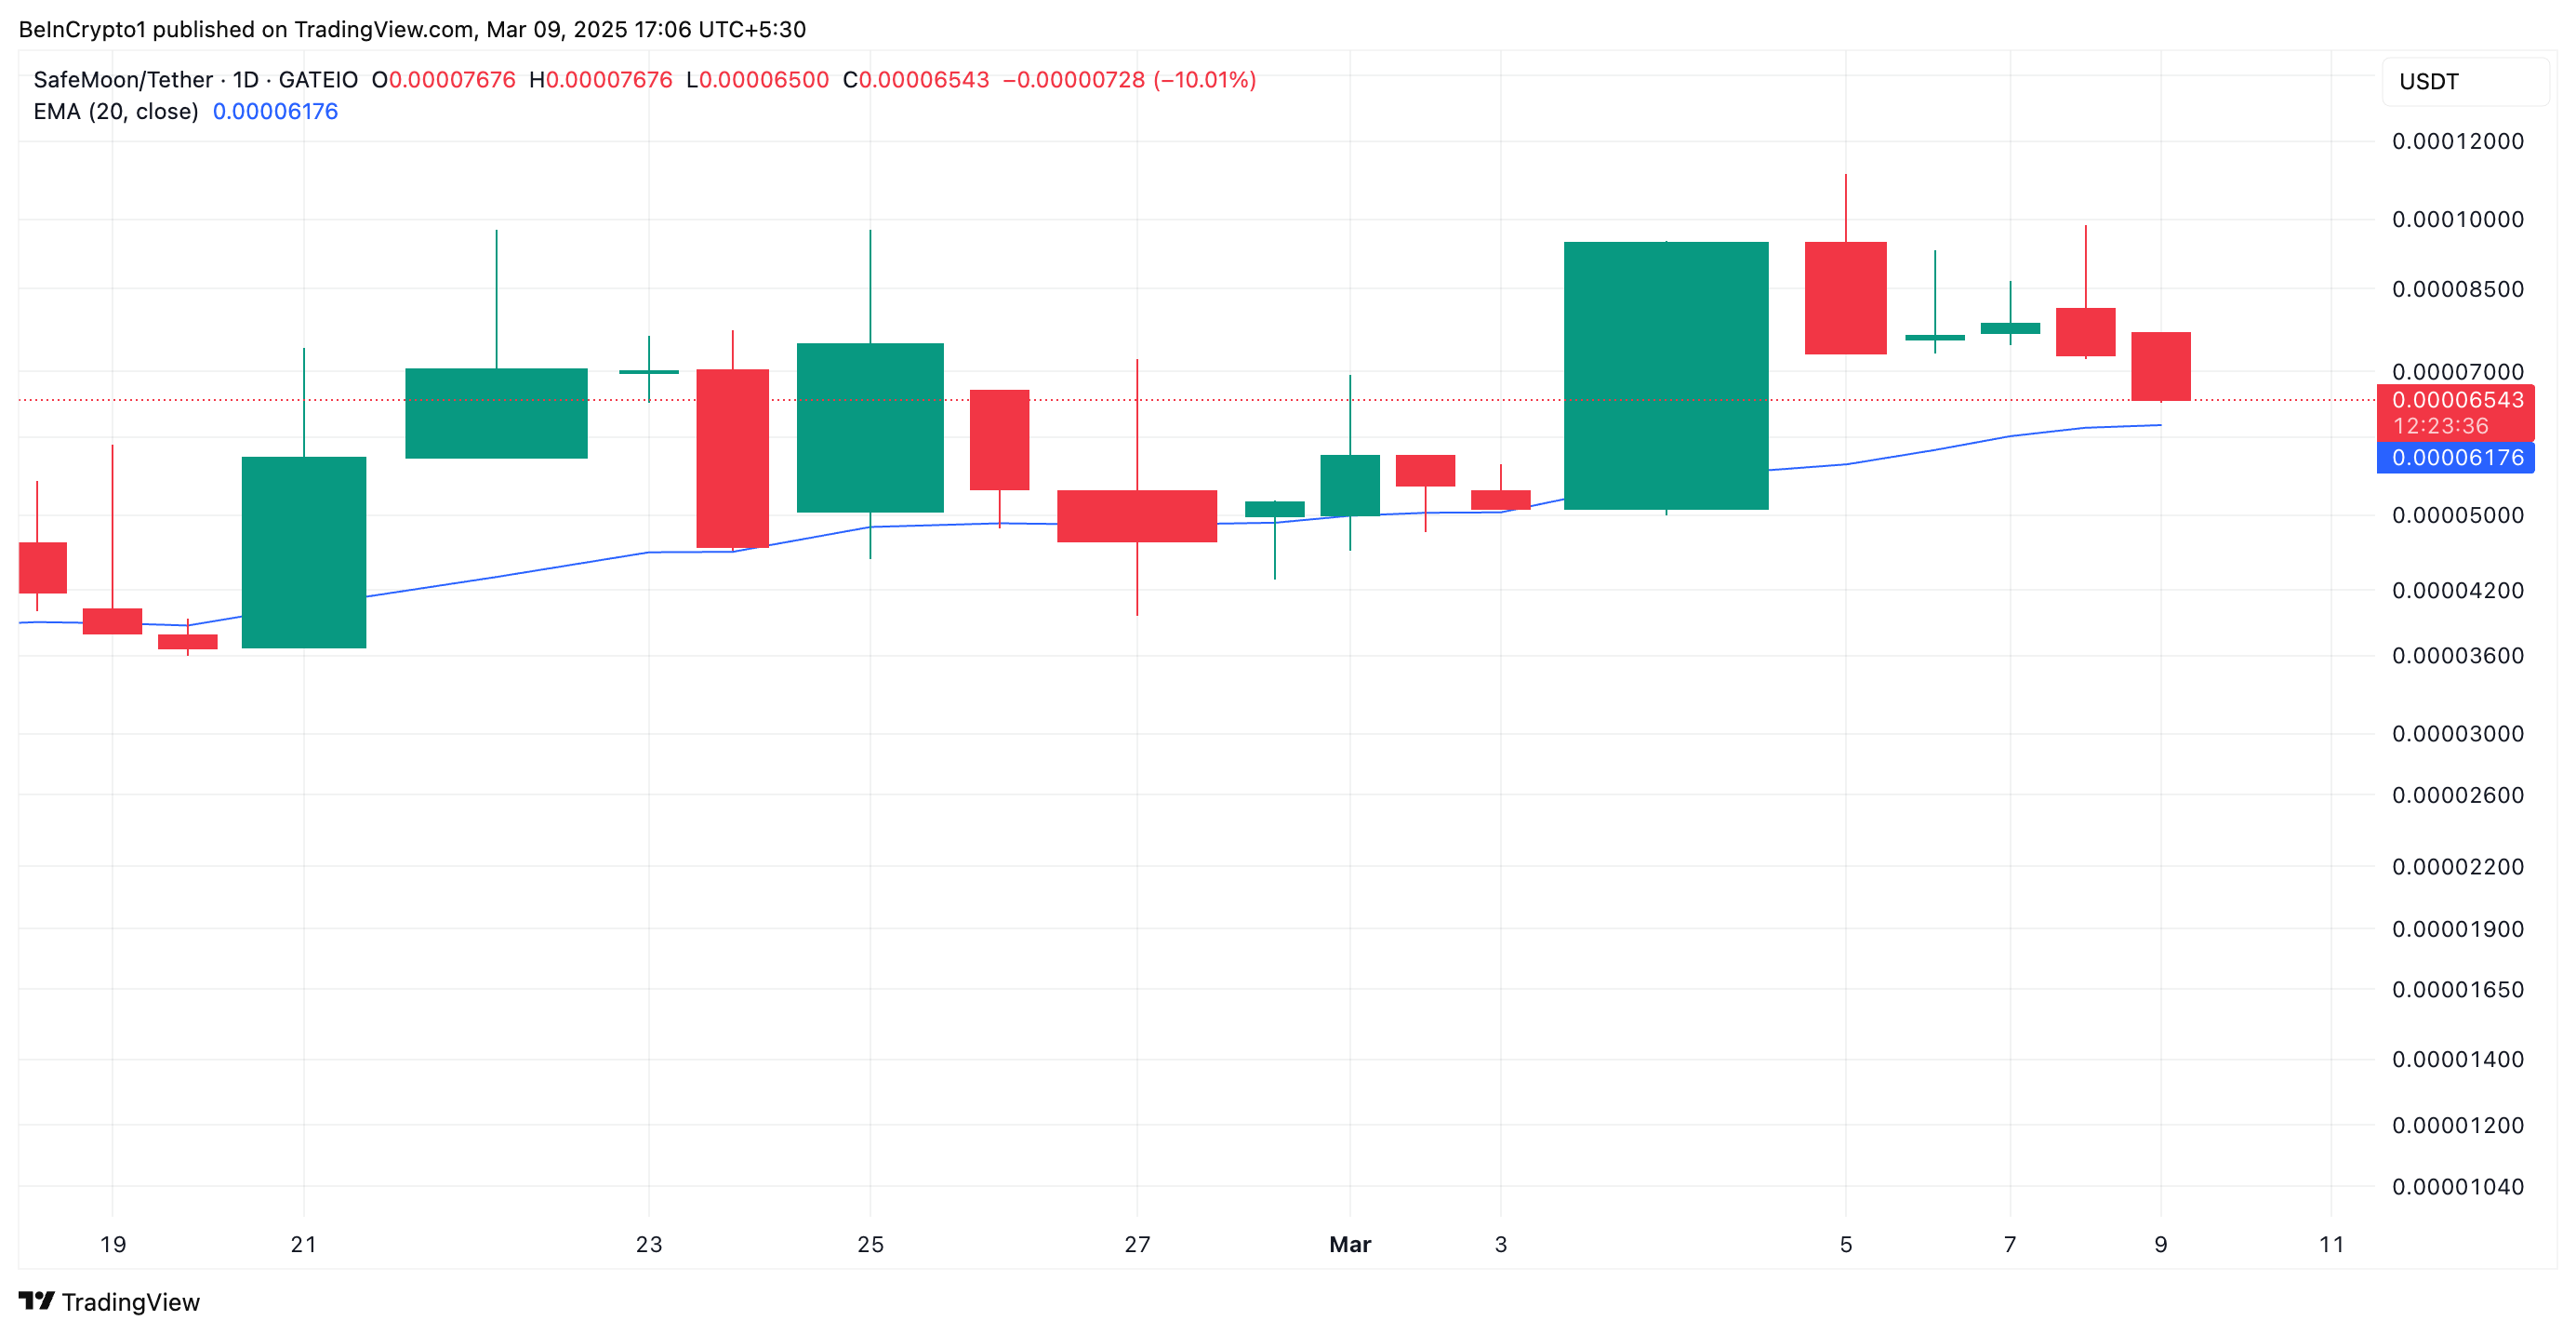
As with SFM, when an asset’s price is poised to break below the 20-day EMA, it signals increased selling pressure. It is a sign of weakening bullish momentum and a shift toward a bearish trend.
SFM Finds Key Support at $0.000061
A successful breach of the dynamic support offered by SafeMoon’s 20-day EMA at $0.000061 would strengthen the bearish trend. In this scenario, the altcoin’s price could plummet further to $0.000047.
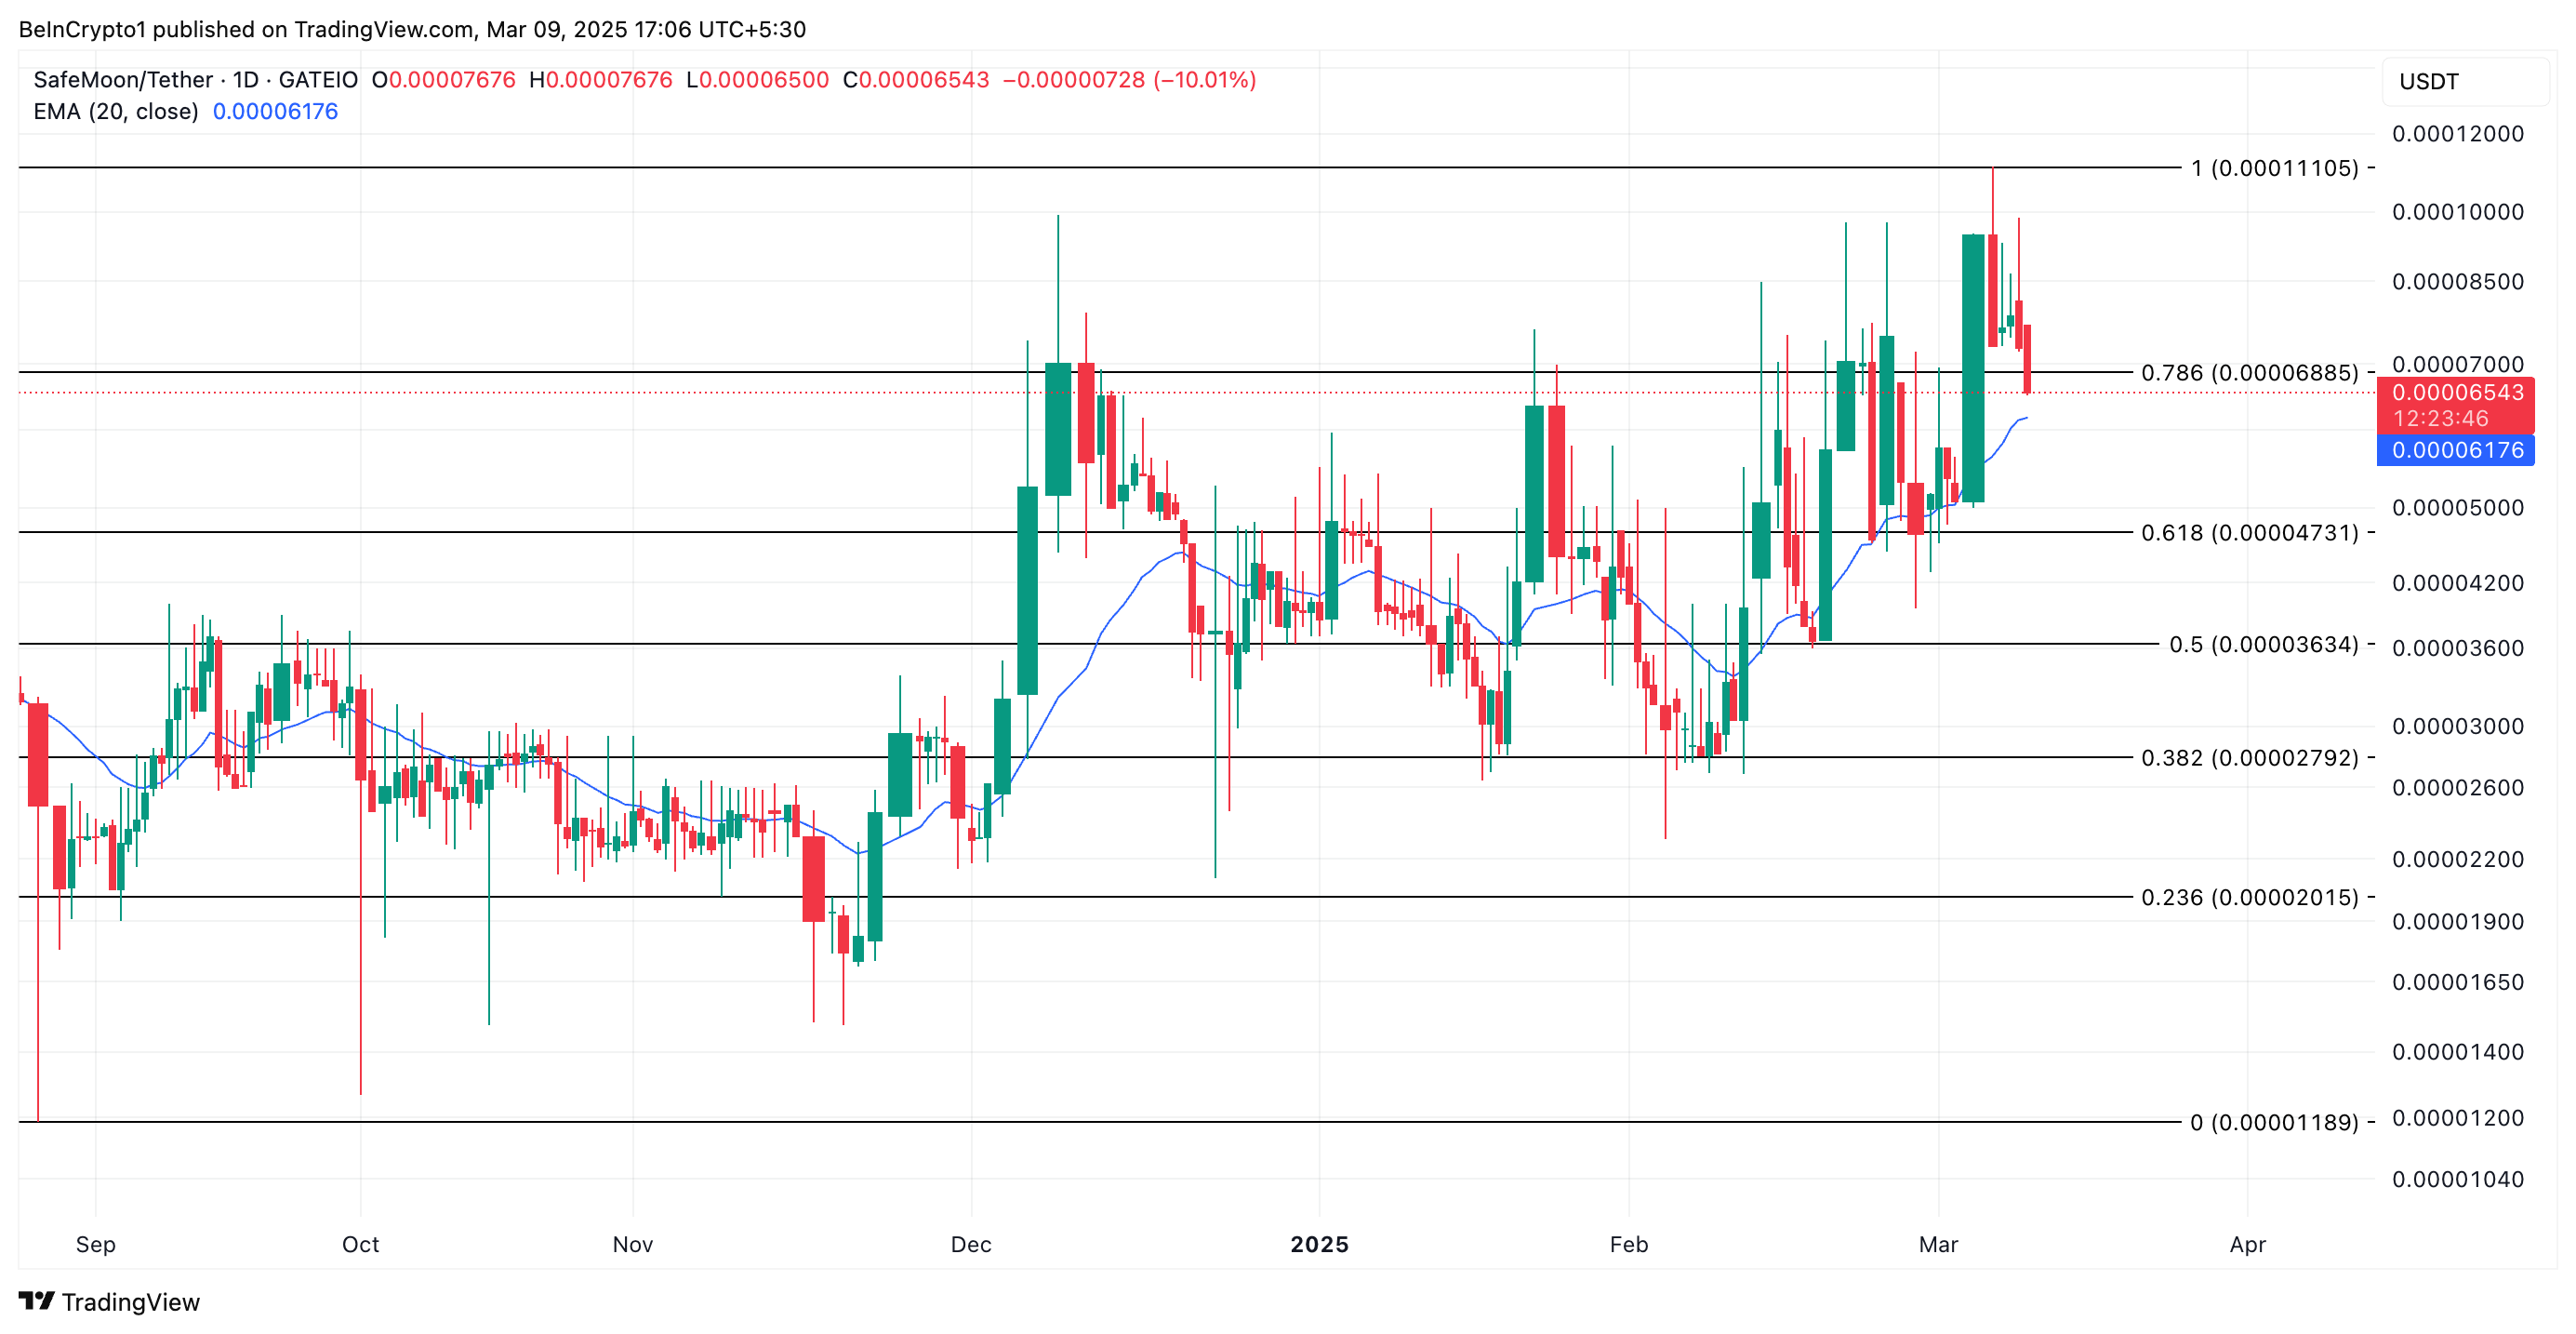
However, a spike in new demand would invalidate this bearish outlook. If spot inflows rally, it could drive SFM’s price above the resistance at $0.000068 toward its multi-year high at $0.000011.
Disclaimer
In line with the Trust Project guidelines, this price analysis article is for informational purposes only and should not be considered financial or investment advice. BeInCrypto is committed to accurate, unbiased reporting, but market conditions are subject to change without notice. Always conduct your own research and consult with a professional before making any financial decisions. Please note that our Terms and Conditions, Privacy Policy, and Disclaimers have been updated.

Pro XRP Lawyer Outlines Reasons To Accumulate Despite Crypto Market Crash

Arkham Can Now Track Crypto Influencer Wallets

Shiba Inu Whales Cut Holdings—Is a Bigger Price Drop Ahead?

SafeMoon (SFM) Selling Pressure Threatens Previous Gains

Bitcoin Liquidation Heatmap Signals Potential Bitcoin Price Swings – What’s Next

Berachain Price Drops 30%—More Losses Ahead?

2.52 Million Altcoins Are Ruining Crypto’s Future

Animoca Brands Valuation Tanks 75% In Two Years, Here’s Why

Crypto exchange BingX hacked for $43 million

Are The Big Players Losing Interest?

Hong Kong’s Securities Association Tips Authorities On Crypto Self-Regulation

Coinbase cbBTC Set to go Live on Solana
2.52 Million Altcoins Are Ruining Crypto’s Future
Animoca Brands Valuation Tanks 75% In Two Years, Here’s Why
Crypto exchange BingX hacked for $43 million
Are The Big Players Losing Interest?
Hong Kong’s Securities Association Tips Authorities On Crypto Self-Regulation
Coinbase cbBTC Set to go Live on Solana
-

 Ethereum21 hours ago
330,000 Ethereum Withdrawn From Exchanges In 72 Hours – Supply Squeeze Incoming?
-

 Market21 hours ago
Bitcoin Pepe maintains its shine as Bitcoin price bleeds further
-
 Altcoin24 hours ago
Tron Founder Justin Sun Asserts TRX Price Will Hit New ATH
-
 Altcoin22 hours ago
Analyst Confirms Dogecoin Price Can Reach $90, Here’s When
-

 Altcoin21 hours ago
Andre Cronje Outlines Reasons For Ethereum’s Underperformance This Cycle
-

 Altcoin18 hours ago
Cardano Price Could Be On Its Way To $2 — Here’s How
-
 Regulation18 hours ago
Gemini Cofounder Reveals How Much David Sacks Will Lose In Crypto Gains In Four Years
-

 Ethereum14 hours ago
Ethereum Breaks Out Of Descending Triangle Pattern – Fakeout Or Recovery Rally?