
Market
BRETT Stabilizes, TRUMP and GOAT Suffers

The crypto market had a volatile week that ended on a not-so-positive note, led by Bitcoin. Altcoins experienced a similar week, with many noting losses, especially the meme coins, some of which are inching closer to a new all-time low.
BeInCrypto has analyzed three such meme coins, which showcase the different intensities of the market’s drawdown: some noted weekly lows, and others saw massive losses.
Brett (BRETT)
BRETT price had gained 9% over the last week but lost all the gain on Friday after seeing major corrections. The meme coin is trading at $0.0379, below the local resistance of $0.0429.
The meme coin continues to struggle against broader bearish market conditions, making it difficult to break higher. However, with sustained interest, a rise above resistance remains possible.
The primary target for BRETT is to breach $0.0478 and flip it into support after noting a 17% rise. This has been an ongoing challenge for the altcoin, with previous attempts failing over the past month.
Successfully flipping $0.0478 into support would open the path for further growth, potentially pushing BRETT above $0.0500.
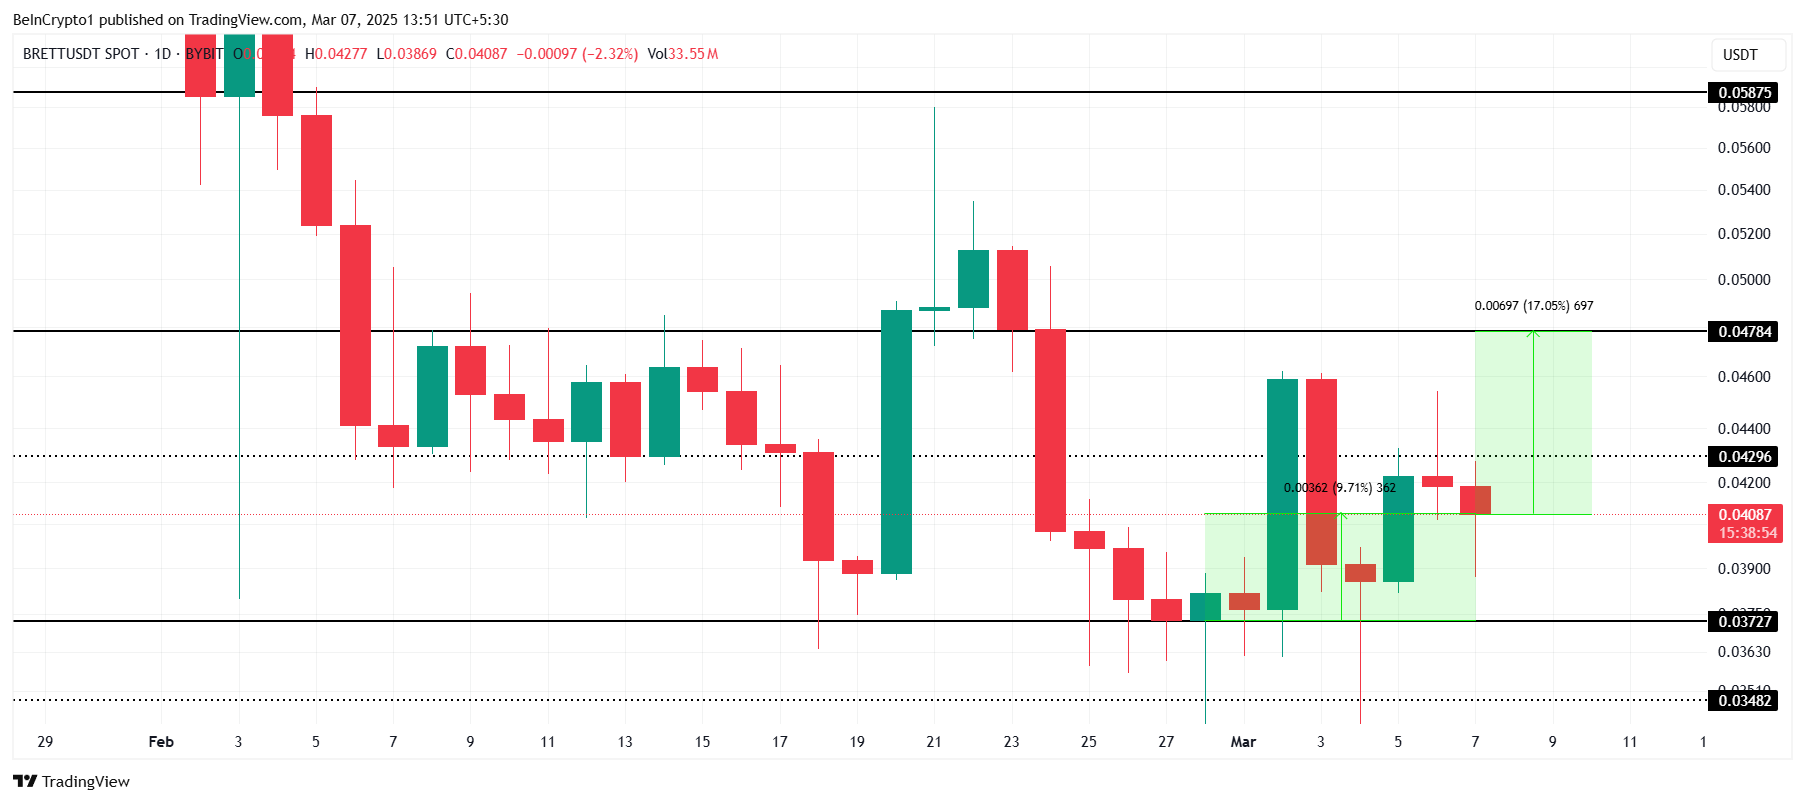
However, if BRETT fails to break through $0.0429, it could retrace to $0.0372. Falling below this level would invalidate the current bullish outlook, potentially sending the altcoin down to $0.0348.
Goatseus Maximus (GOAT)
GOAT has faced a persistent downtrend since the start of the year, currently trading at $0.0634. This prolonged decline has erased nearly all of its previous gains. The market’s overall bearish conditions have kept the altcoin struggling, making it difficult for GOAT to secure upward momentum.
Currently, GOAT is trading just above its all-time low (ATL) of $0.0601, having experienced a significant 37% decline over the past week. If the market conditions remain unfavorable, the altcoin could see a drop below $0.0600, potentially marking a new ATL and deepening its losses.
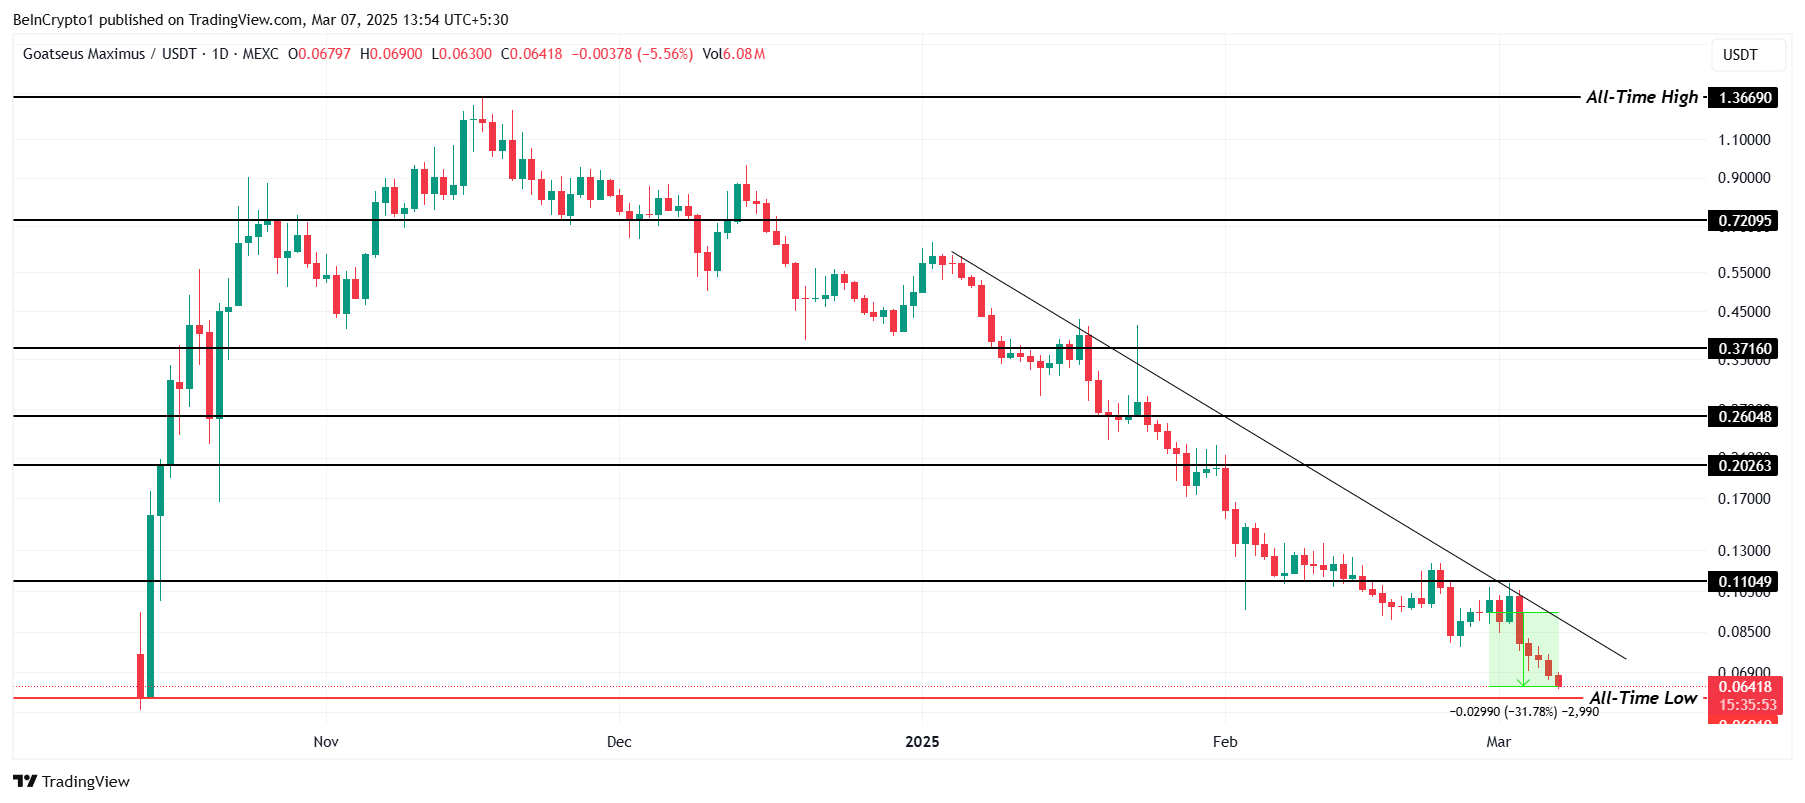
However, if GOAT receives support from bullish investors or market sentiment shifts positively, it could stage a recovery.
The meme coin’s target would be $0.1104, and if it successfully breaches this resistance, the bearish outlook could be invalidated, helping GOAT recover from its recent losses.
OFFICIAL TRUMP (TRUMP)
TRUMP initially jumped to $13.11 this week before seeing a drop to $12.28 on Friday. The meme coin has managed to hold above the key support level of $12.10, indicating a stabilizing trend amid the broader market’s volatility.
This support level continues to be critical for price movements.
While TRUMP reached an intra-week high of $17.14, the altcoin has struggled to maintain upward momentum. The ongoing downtrend and prevailing bearish market conditions pulled the price back down.
Moving forward, TRUMP is likely to consolidate between $17.14 and $12.41, with these levels marking significant resistance and support.
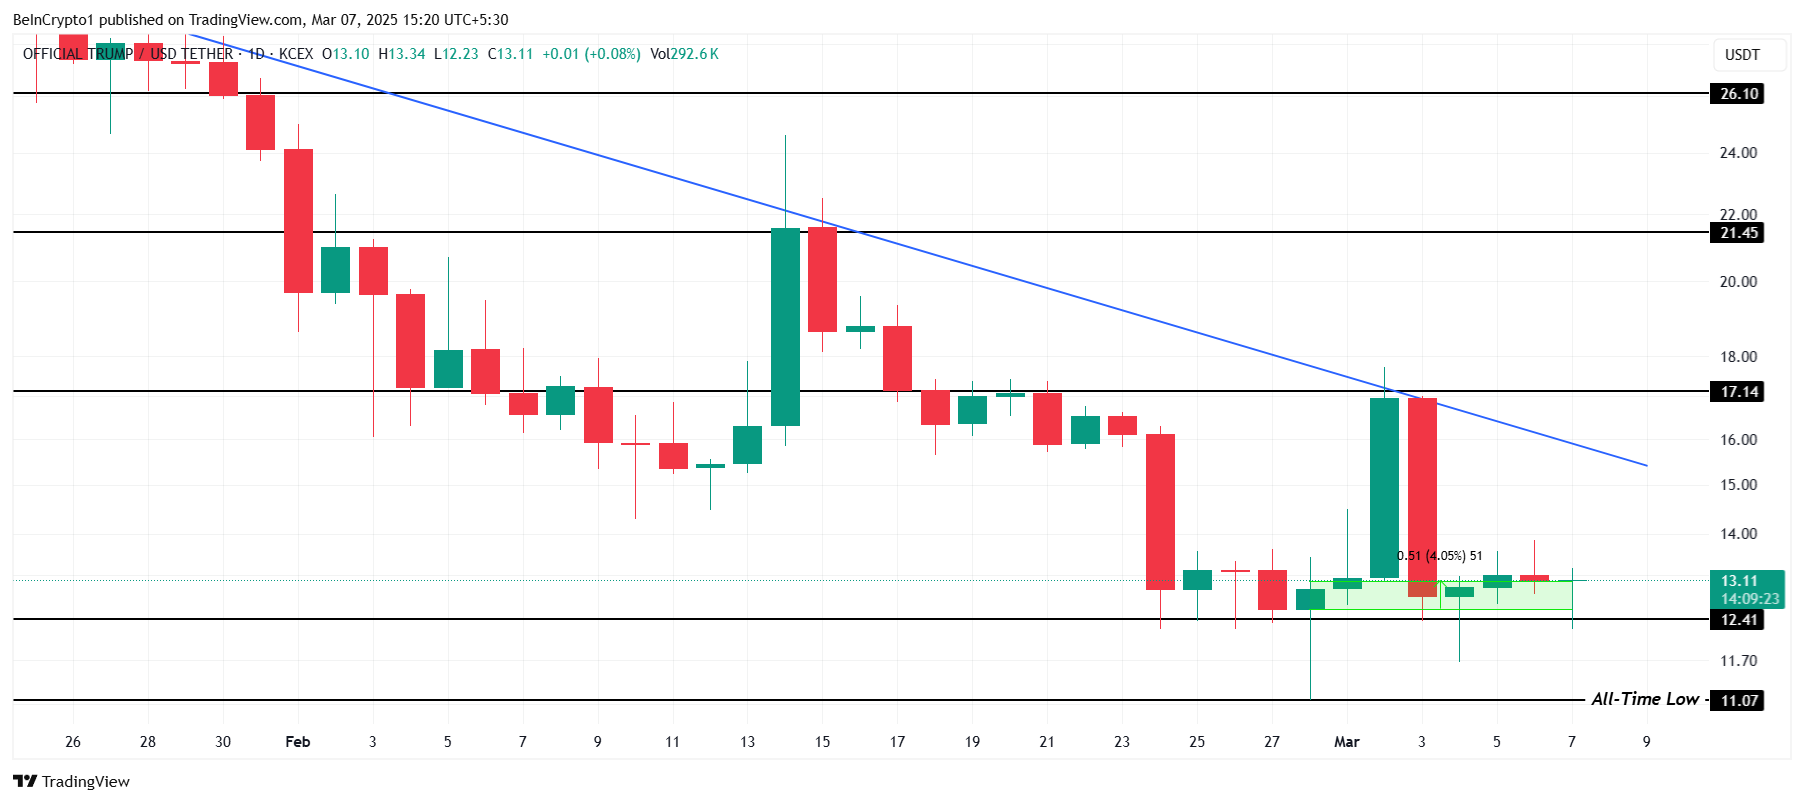
The only way this neutral outlook is invalidated is if TRUMP falls below $12.41. A breakdown below this support could lead the altcoin to slide toward its all-time low (ATL) of $11.07, signaling a more bearish trend.
This would also extend the losses seen in the current downtrend.
Disclaimer
In line with the Trust Project guidelines, this price analysis article is for informational purposes only and should not be considered financial or investment advice. BeInCrypto is committed to accurate, unbiased reporting, but market conditions are subject to change without notice. Always conduct your own research and consult with a professional before making any financial decisions. Please note that our Terms and Conditions, Privacy Policy, and Disclaimers have been updated.


Reason to trust
![]()
Strict editorial policy that focuses on accuracy, relevance, and impartiality
Created by industry experts and meticulously reviewed
The highest standards in reporting and publishing
Strict editorial policy that focuses on accuracy, relevance, and impartiality
Morbi pretium leo et nisl aliquam mollis. Quisque arcu lorem, ultricies quis pellentesque nec, ullamcorper eu odio.
Ethereum price started a fresh decline below the $1,650 zone. ETH is now consolidating and might decline further below the $1,550 support zone.
- Ethereum started a fresh decline below the $1,650 and $1,620 levels.
- The price is trading below $1,600 and the 100-hourly Simple Moving Average.
- There is a new connecting bearish trend line forming with resistance at $1,600 on the hourly chart of ETH/USD (data feed via Kraken).
- The pair could start a fresh increase if it clears the $1,655 resistance zone.
Ethereum Price Faces Resistance
Ethereum price struggled to continue higher above $1,700 and started a fresh decline, like Bitcoin. ETH declined below the $1,620 and $1,600 support levels. It even spiked below $1,550.
A low was formed at $1,538 and the price is now correcting some losses. There was a move above the $1,565 level. The price climbed above the 23.6% Fib retracement level of the downward move from the $1,690 swing high to the $1,538 low.
Ethereum price is now trading below $1,600 and the 100-hourly Simple Moving Average. On the upside, the price seems to be facing hurdles near the $1,600 level. There is also a new connecting bearish trend line forming with resistance at $1,600 on the hourly chart of ETH/USD.
The next key resistance is near the $1,615 level or the 50% Fib retracement level of the downward move from the $1,690 swing high to the $1,538 low. The first major resistance is near the $1,650 level. A clear move above the $1,650 resistance might send the price toward the $1,690 resistance.

An upside break above the $1,690 resistance might call for more gains in the coming sessions. In the stated case, Ether could rise toward the $1,750 resistance zone or even $1,800 in the near term.
Another Decline In ETH?
If Ethereum fails to clear the $1,600 resistance, it could start another decline. Initial support on the downside is near the $1,560 level. The first major support sits near the $1,535 zone.
A clear move below the $1,535 support might push the price toward the $1,500 support. Any more losses might send the price toward the $1,420 support level in the near term. The next key support sits at $1,400.
Technical Indicators
Hourly MACD – The MACD for ETH/USD is losing momentum in the bearish zone.
Hourly RSI – The RSI for ETH/USD is now above the 50 zone.
Major Support Level – $1,535
Major Resistance Level – $1,650
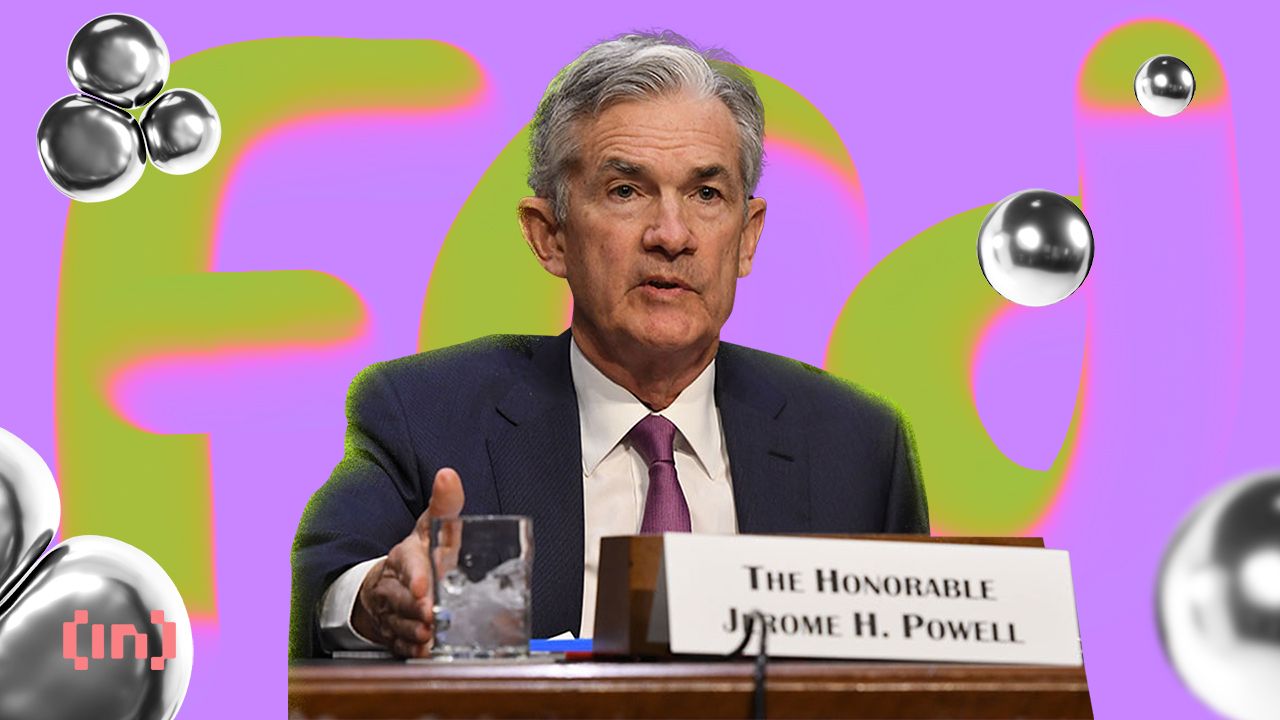
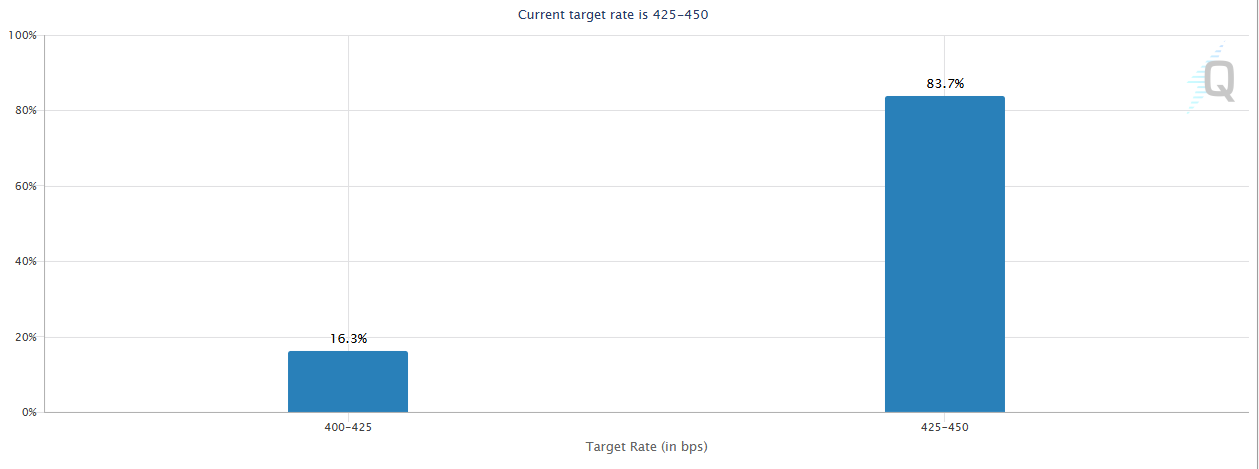
Federal Reserve Chair Jerome Powell signaled on Tuesday that crypto banking regulations will be partially relaxed. He also made it seemingly clear that a near-term interest rate cut remains unlikely.
Speaking at the Economic Club of Chicago, Powell addressed mounting uncertainty stemming from trade policy and reinforced the central bank’s cautious stance.
Fed’s Powell Maitains a Hawkish Outlook
Powell’s remarks come as market expectations for a May rate cut have collapsed, with CME FedWatch data pricing in just a 16% chance. US equities dipped modestly following the speech. The equity market currently reflects investor disappointment over the lack of dovish signals.
“We should not rush to lower interest rates,” Powell said. “We have every reason to wait for more clarity before considering any changes to Fed policy.”
The crypto market, however, remained relatively steady. Rate cut optimism had already been priced out after last week’s hawkish FOMC minutes and cooler-than-expected CPI print.
Powell also offered direct comments on digital assets.
“Cryptocurrency is becoming more popular. A legal framework for stablecoins is a good idea.”
He added that the Federal Reserve supports relaxing certain banking regulations on crypto. The Feds agree that the sector is maturing and requires more defined oversight rather than constraint.
The dual message—no imminent policy easing but a positive outlook for crypto regulation—was met with a muted response across digital asset markets.
Bitcoin hovered near $84,500, showing resilience despite risk-off sentiment in equities. Powell acknowledged that economic growth had likely slowed at the start of 2025 and warned that Trump’s tariffs are a “key source of uncertainty.”
He also noted the Fed is not close to ending quantitative tightening and may need to make difficult policy choices if inflation resurges.
While the Fed reaffirmed its readiness to provide dollar liquidity to global central banks if needed, Powell dismissed the idea of a Fed “put.” He said the central bank’s independence is “a matter of law.”
For crypto markets, the regulatory tone was a silver lining in an otherwise hawkish macro environment.
Disclaimer
In adherence to the Trust Project guidelines, BeInCrypto is committed to unbiased, transparent reporting. This news article aims to provide accurate, timely information. However, readers are advised to verify facts independently and consult with a professional before making any decisions based on this content. Please note that our Terms and Conditions, Privacy Policy, and Disclaimers have been updated.

XRP recent surge appears to be entering a cooling phase as the price edges lower to the $1.97 level, an area acting as a pivotal support. After a strong upward move fueled by improved market sentiment, the current pullback signals a potential pause rather than a full reversal.
The $1.97 zone now stands as a critical support level, previously acting as resistance during XRP’s recent climb. If buyers step in with strength and volume begins to rise, this dip could prove to be a strategic entry point for those eyeing the next breakout.
Key Support Holds At $1.97 – Is XRP Building A Base?
XRP’s pullback to the $1.97 level has brought attention to the critical support zone that may serve as a foundation for the next leg up. Despite broader market fluctuations, price action has shown resilience around this area, with buyers stepping in to defend the level. Historically, $1.97 has acted as a pivotal point during previous rallies and corrections, increasing its significance as a potential accumulation zone.
The Moving Average Convergence Divergence (MACD) indicator is beginning to flash early signs of a potential bullish reversal for XRP. After the recent dip to $1.97, the MACD line is showing signs of converging toward the signal line, hinting that bearish momentum may be losing steam. This subtle shift often precedes a reversal and suggests that buyers are gradually regaining control.
Should the MACD complete a bullish crossover, where the MACD line crosses above the signal line, it will reinforce the argument for a rebound. When paired with XRP’s position above key support, such a signal could confirm that market sentiment is tilting in favor of the bulls. A strengthening MACD histogram, reflecting diminishing downside pressure, would further validate this shift and add weight to the case for an upward move in the coming sessions.
Bulls On Standby: What Needs To Happen For A Breakout
Several key conditions must be met before momentum shifts decisively in the bulls’ favor as XRP’s price action nears the $1.97 support zone. First, XRP needs to firmly establish $1.97 as a solid base, with multiple successful defenses of this level reinforcing buyer confidence. A rebound from this zone would signal underlying strength and provide the first step toward an upside breakout.
Secondly, volume needs to step in. A breakout without a noticeable increase in trading volume risks being a false move. Sustained buying pressure would confirm that market participants are positioned for a trend reversal. Additionally, a decisive break above nearby resistance levels such as $2.25 or higher would invalidate the current consolidation phase and open the door for further gains.
Lastly, indicators like the RSI and MACD must align with the bullish narrative. A rising RSI, without entering overbought territory, and a bullish MACD crossover would solidify the technical foundation for an upward move.

Ethereum Price Struggles to Rebound—Key Hurdles In The Way

No Rate Cut Soon, Crypto Banking Rules to Ease

XRP Dips To $1.97 – A Golden Opportunity Before The Next Rally?

Expert Reveals Hurdles For Ripple And The SEC Ahead Of Final Resolution
XRP Slides Into Bearish Zone Amid Weak Trading Signals

PEPE Price To Bounce 796% To New All-Time Highs In 2025? Here’s What The Chart Says

2.52 Million Altcoins Are Ruining Crypto’s Future

Animoca Brands Valuation Tanks 75% In Two Years, Here’s Why

Crypto exchange BingX hacked for $43 million

Are The Big Players Losing Interest?

Hong Kong’s Securities Association Tips Authorities On Crypto Self-Regulation

Coinbase cbBTC Set to go Live on Solana
2.52 Million Altcoins Are Ruining Crypto’s Future
Animoca Brands Valuation Tanks 75% In Two Years, Here’s Why
Crypto exchange BingX hacked for $43 million
Are The Big Players Losing Interest?
Hong Kong’s Securities Association Tips Authorities On Crypto Self-Regulation
Coinbase cbBTC Set to go Live on Solana
-
 Altcoin22 hours ago
Expert Reveals Current Status Of 9 Ripple ETFs
-
 Market24 hours ago
XRP Price Pulls Back: Healthy Correction or Start of a Fresh Downtrend?
-
 Altcoin24 hours ago
Ripple Whale Moves $273M As Analyst Predicts XRP Price Crash To $1.90
-

 Market23 hours ago
Arbitrum RWA Market Soars – But ARB Still Struggles
-

 Bitcoin22 hours ago
Is Bitcoin the Solution to Managing US Debt? VanEck Explains
-
 Altcoin16 hours ago
Mantra (OM) Price Pumps As Founder Reveals Massive Token Burn Plan
-

 Bitcoin21 hours ago
China Liquidates Seized Crypto to Boost Struggling Treasury
-

 Market20 hours ago
Ethereum Price Dips Again—Time to Panic or Opportunity to Buy?
