
Ethereum
Ethereum Flashing Bullish Signals, But Rising Exchange Reserves Raise Concerns

Ethereum (ETH), the second-largest cryptocurrency by market cap, is flashing multiple bullish signals that suggest a potential upside move. However, rising exchange reserves are tempering this optimism.
Has Ethereum Formed A Local Bottom?
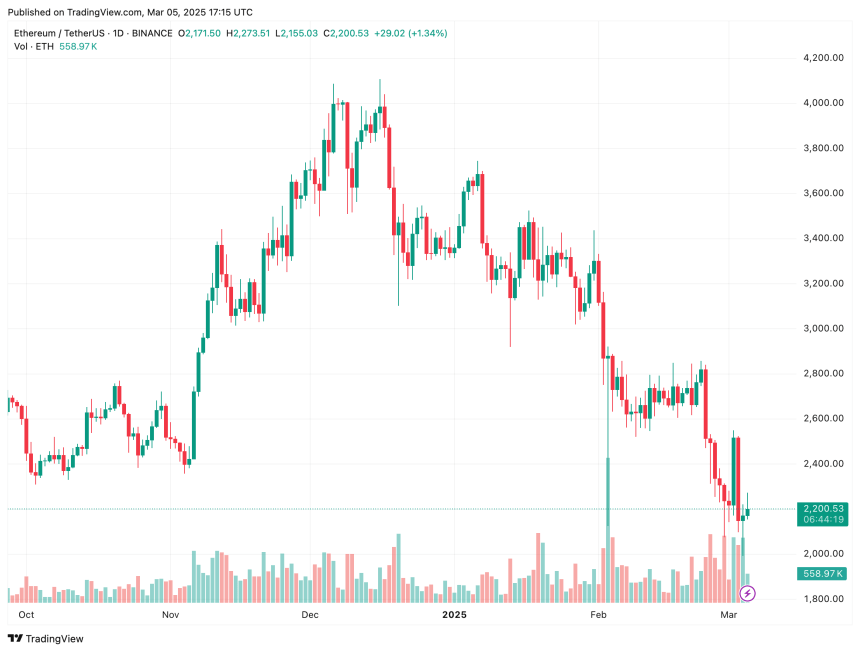
Ethereum has dropped nearly 20% over the past two weeks, falling from approximately $2,805 on February 23 to just above $2,200 at the time of writing. This decline has wiped out $80 billion from ETH’s market cap.
Related Reading
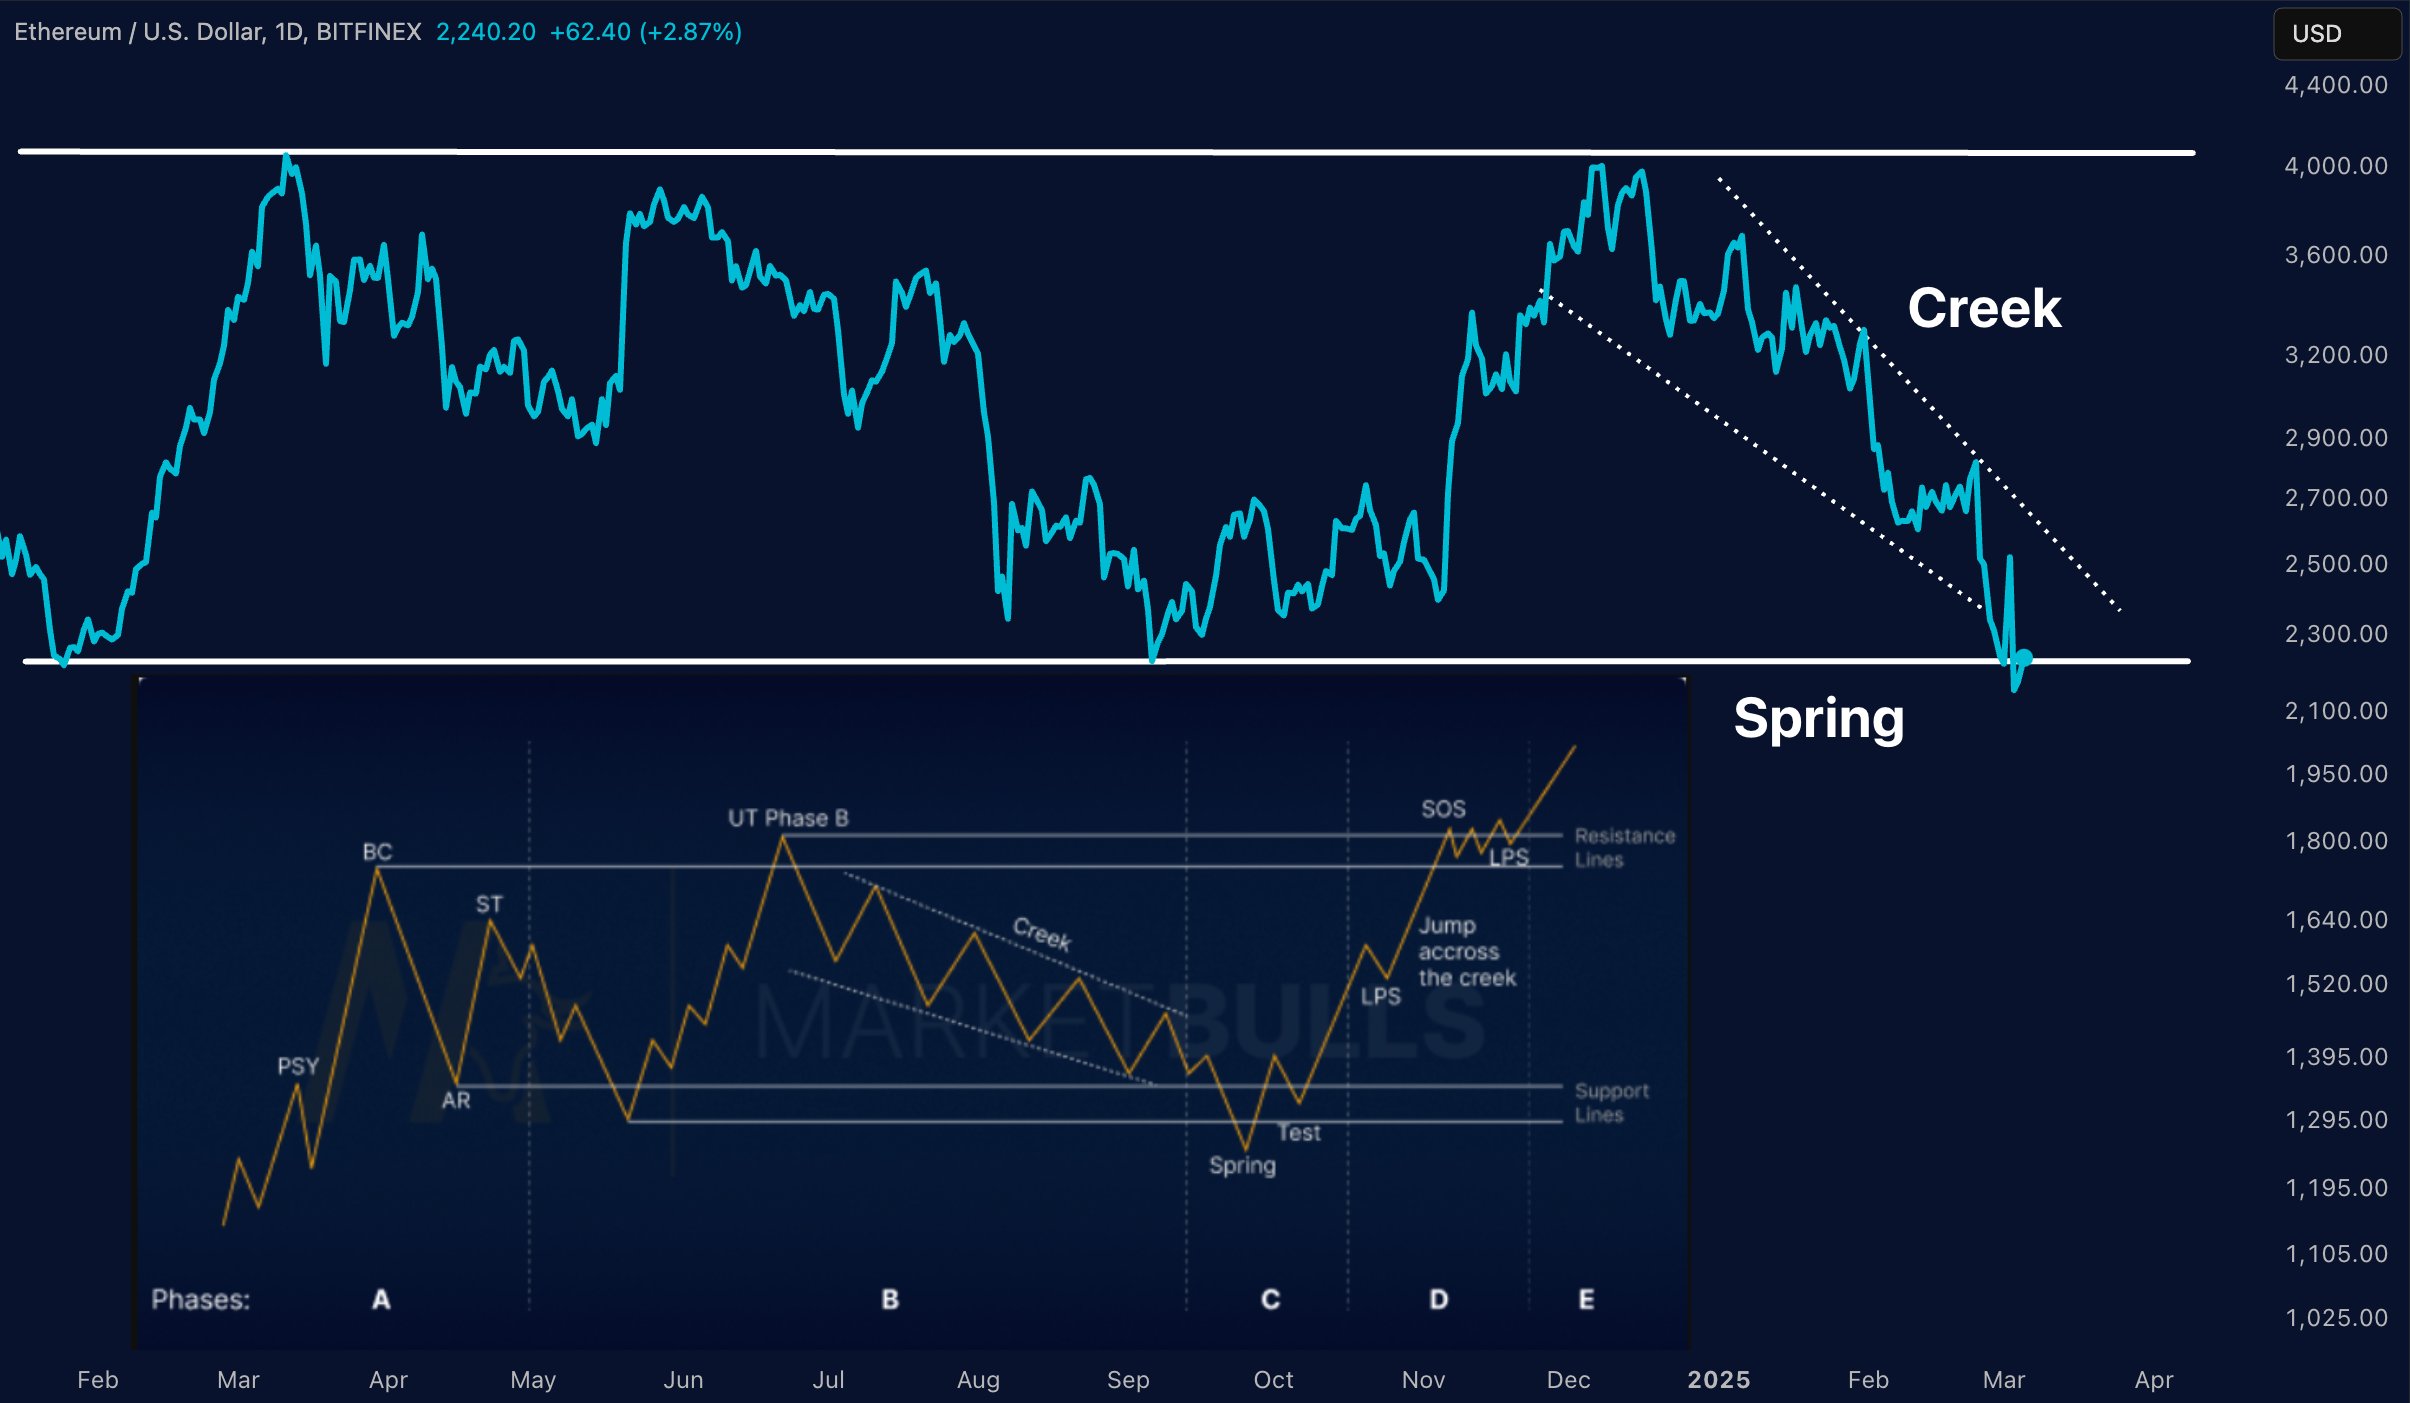
Despite this sharp pullback, crypto analysts are pointing to several bullish indicators that could signal an impending price reversal. Crypto analyst Merlijn The Trader, for instance, has highlighted that ETH is following the Wyckoff Reaccumulation Pattern.
For those unfamiliar, the Wyckoff Reaccumulation Pattern is a technical analysis method developed by Richard Wyckoff. In the context of ETH’s current price action, this pattern suggests that the asset may be entering an accumulation phase before a potential upward movement.
The analyst further noted that the “spring phase” has just been triggered – indicating a possible bear trap where a brief dip below support levels misleads sellers, potentially setting the stage for a rally. A bounce from this level could see ETH climb to $4,000.
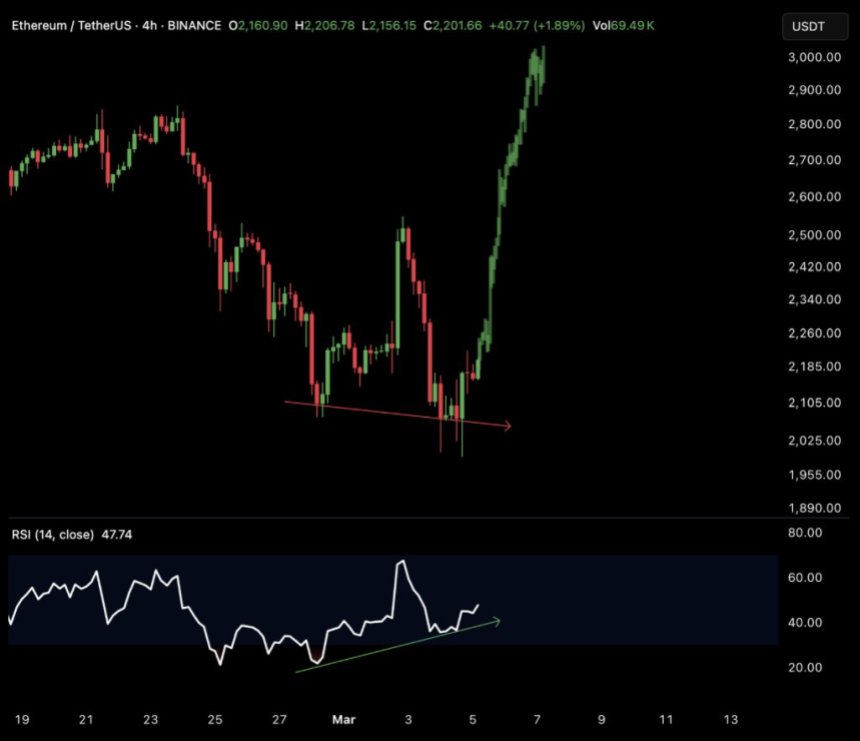
In a separate X post, Merlijn The Trader also pointed to a bullish divergence in Ethereum’s 4-hour chart. According to the analyst, ETH’s next immediate target is $2,700 before moving higher. Fellow crypto analyst CryptoGoos echoed these sentiments.
Beyond technical indicators, whale activity has added to the bullish sentiment surrounding ETH. In an X post, crypto analyst Ted noted:
Ethereum whale bought 17,855 ETH worth $36,000,000 at an average price of $2,054. Total holding $2,530,000,000 Ethereum. You think this is going down? Think again.
Rising Exchange Reserves May Spoil The Party
On the bearish side, crypto analyst Ali Martinez pointed out that ETH reserves on exchanges have been steadily rising. Over the past two weeks, more than 610,000 ETH has been transferred to exchanges, which could increase selling pressure.
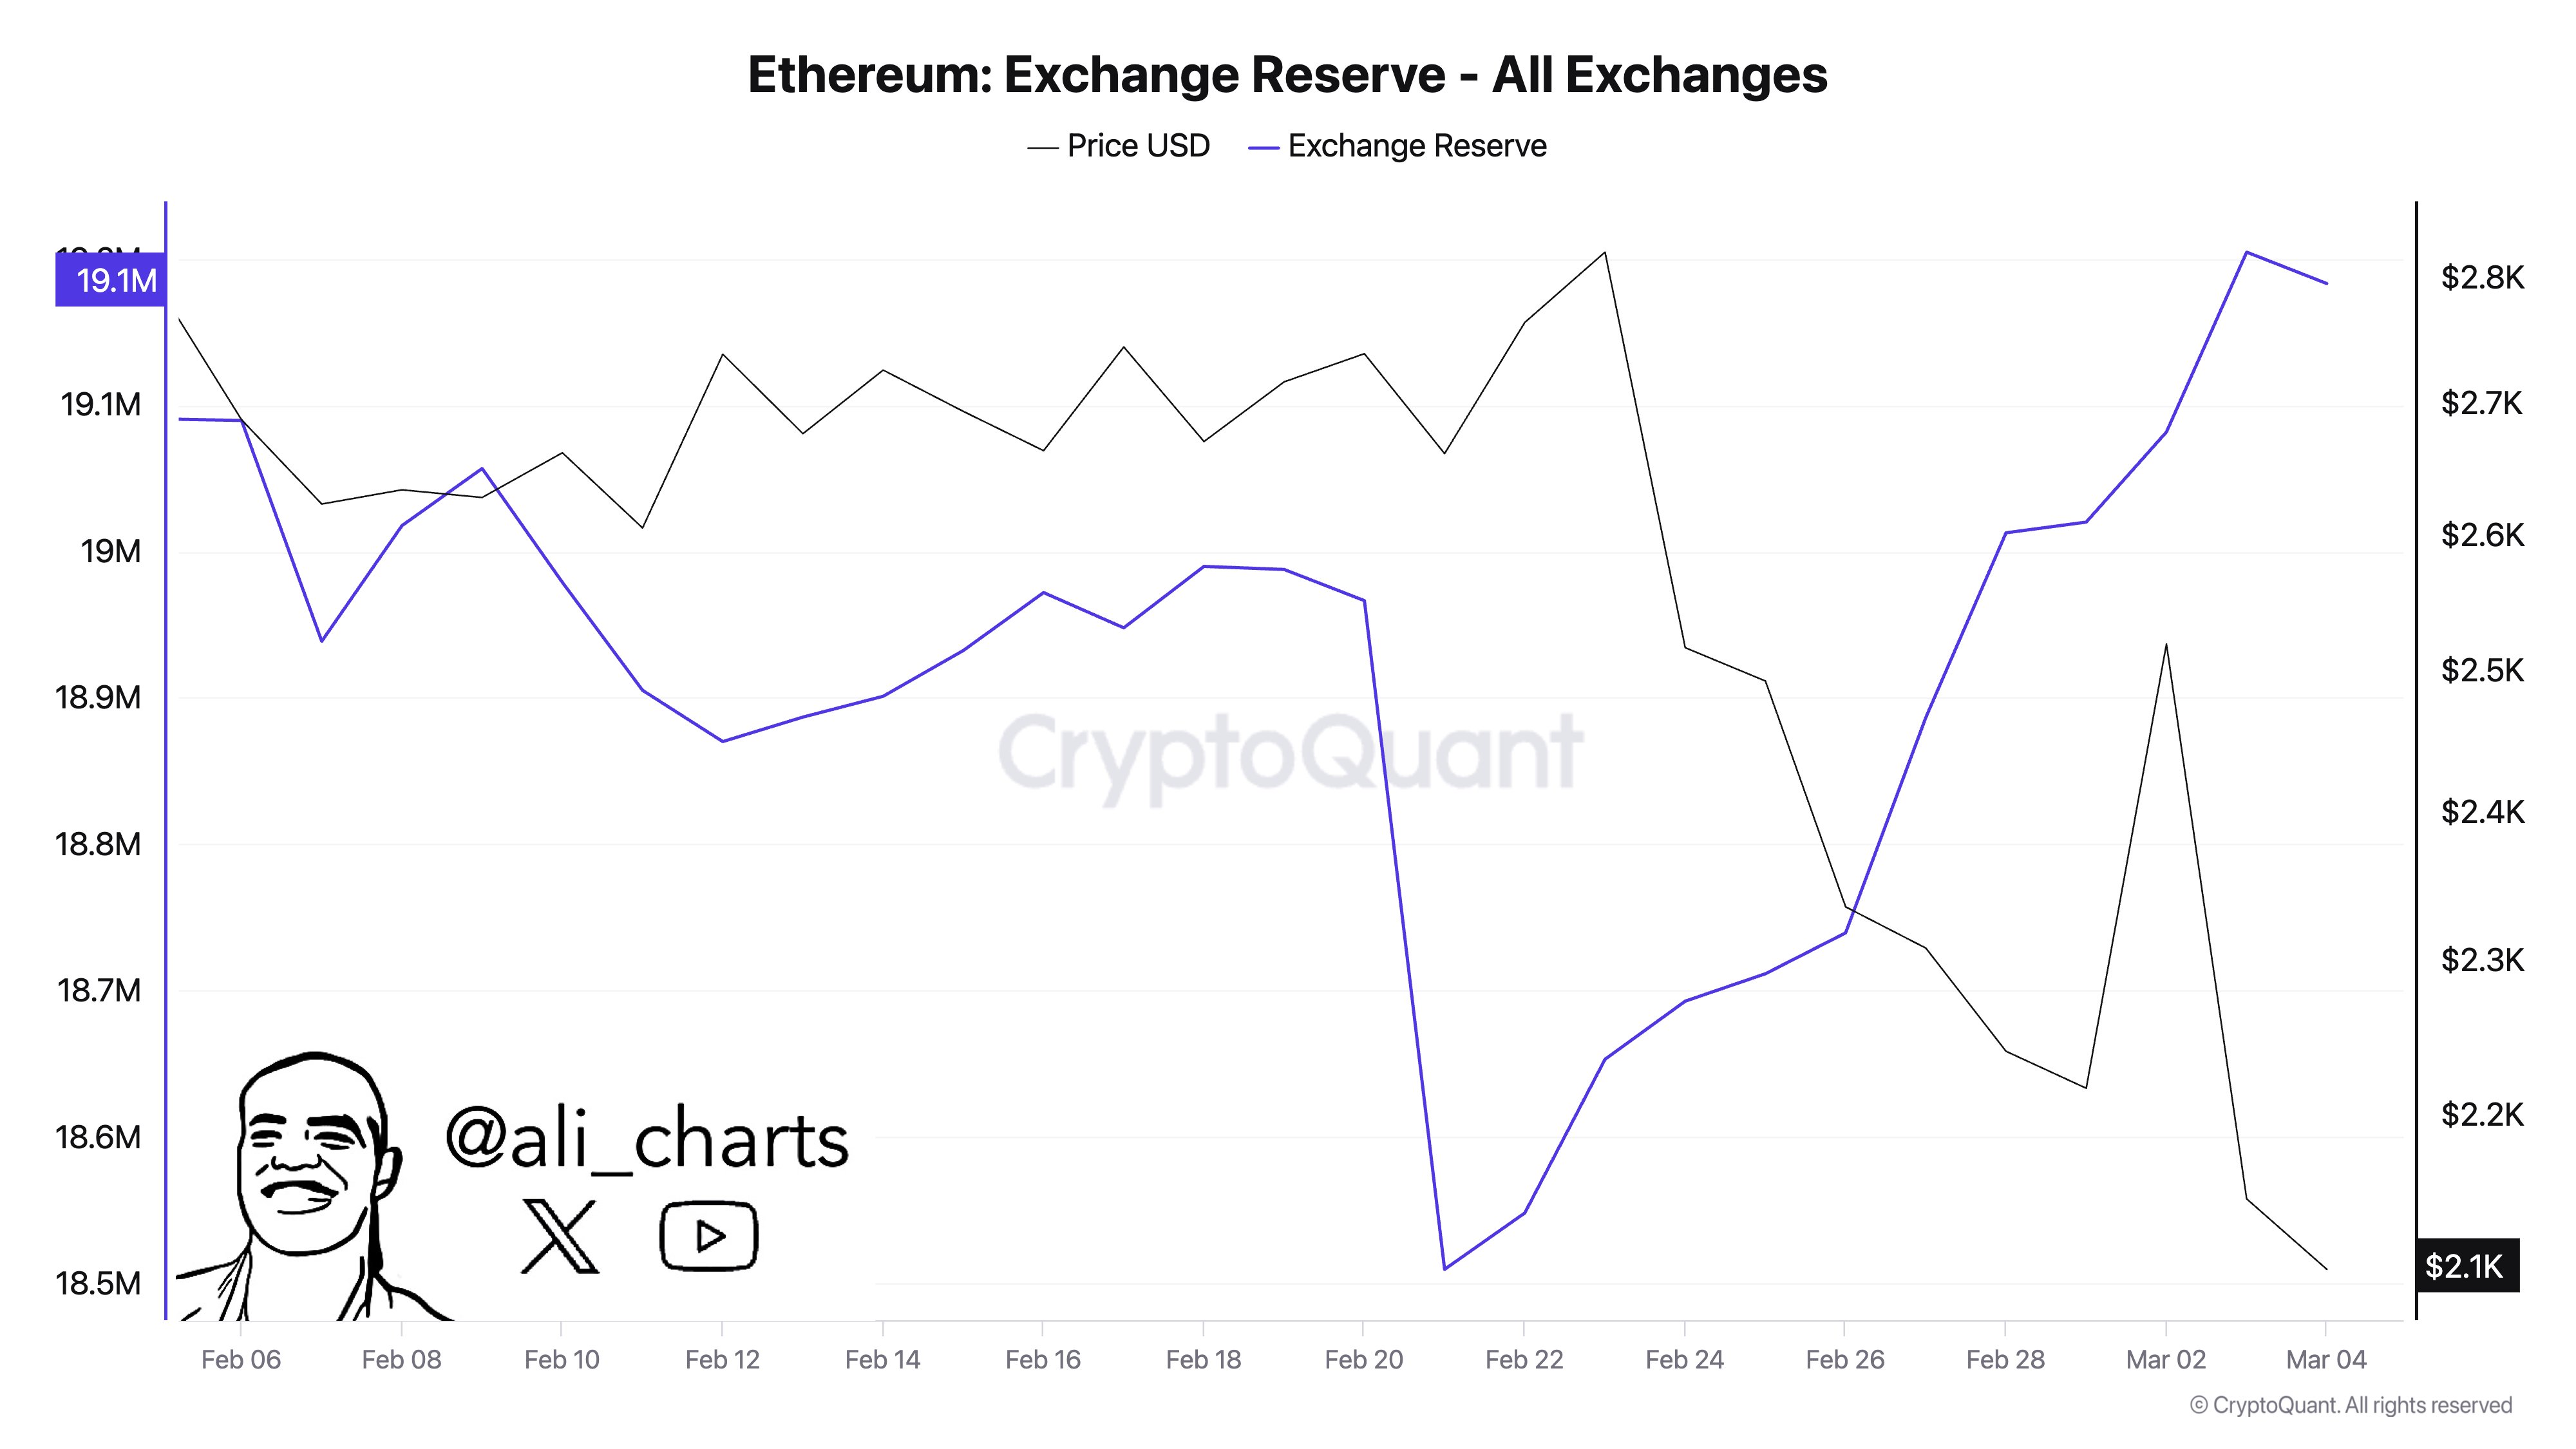
Martinez’s analysis aligns with a recent report that found that despite ETH’s Relative Strength Index (RSI) being at a multi-year low, there could still be further downside in store for the digital currency.
Related Reading
Indeed, ETH has been marred by significant bearish sentiment due to its relatively weak price performance over the past two years compared to cryptocurrencies like Bitcoin (BTC), Solana (SOL), and XRP.
However, extreme bearish sentiment could act as a contrarian signal, setting the stage for a surprise rally. At press time, ETH trades at $2,200, up 6% in the past 24 hours.
Featured image from Unsplash, charts from X and Tradingview.com


Ethereum is trading at low levels after failing to reclaim the $2,500 mark, leaving the market uncertain about its next move. Analysts remain divided, with some calling for a continued drop as ETH’s price action remains unstable, while others see signs of a potential recovery forming at key support levels.
Top analyst Ali Martinez shared on-chain data from Glassnode, revealing that the number of Ethereum addresses holding more than 10,000 ETH has dropped to 919, down from 999 in late February. This suggests that whales have been selling heavily during the latest correction, likely driven by fear and liquidity issues. The capitulation of big players is often a bearish sign, signaling uncertainty among institutional investors and raising concerns about further downside risk.

Despite this wave of selling, Ethereum has held a key demand level around $2,200, suggesting that a potential reversal could be forming. If ETH manages to stabilize at this level, it could build momentum for a rebound in the coming weeks.
The next few weeks will be crucial for ETH’s price action. If bulls regain control, Ethereum could attempt another push toward $2,500 and beyond. However, failure to hold current levels could result in another leg down, extending its bearish phase and keeping traders on edge.
Price Action Details: Key Levels To Watch
Ethereum (ETH) is currently trading at $2,300, stuck in a range after failing to hold above $2,500 or break below $2,000. The market remains uncertain, with volatility swinging ETH’s price up and down, preventing a clear trend from forming.
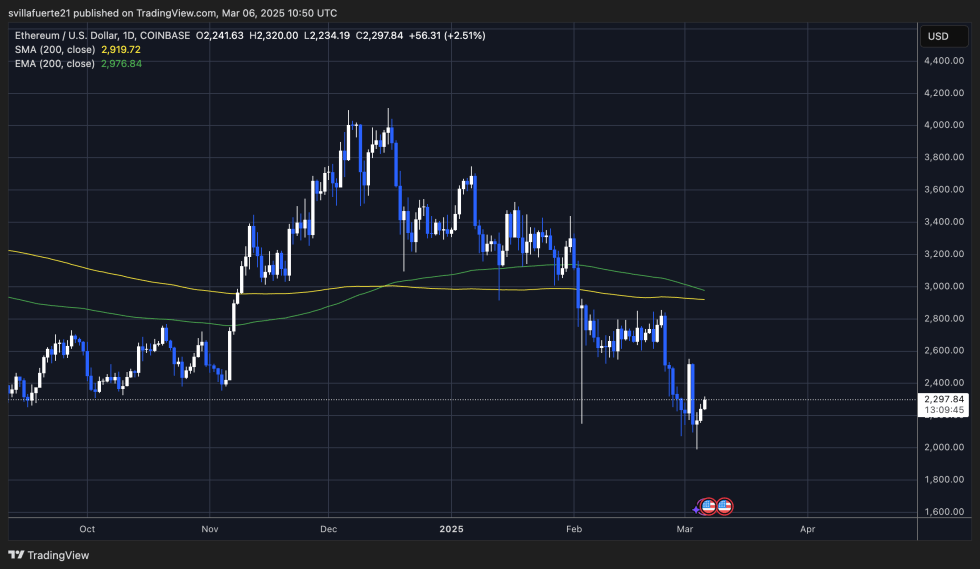
For bulls to confirm a recovery rally, a push above the $2,500-$2,600 range is essential. Reclaiming this zone would signal strong buying momentum, potentially shifting sentiment back in favor of bulls. Without this move, Ethereum remains at risk of continued consolidation or another leg down.
However, for now, the main focus is on holding the $2,200 demand level. This key support zone has kept ETH from breaking lower, but if it fails, selling pressure could intensify, pushing Ethereum toward sub-$2,000 levels.
With market uncertainty still high, traders are watching whether ETH can stabilize above $2,200 or gain momentum toward higher resistance levels. Until Ethereum breaks out of its current range, volatility is expected to continue, keeping both bulls and bears cautious about the next major price move.
Featured image from Dall-E, chart from TradingView
Ethereum’s price has mirrored Bitcoin’s recent market movements. ETH experienced a rollercoaster performance earlier this week before rebounding with a 10% increase in the past 24 hours. This recovery follows a broader market correction that initially led to fear among investors.
While Ethereum’s performance remains closely linked to Bitcoin’s price action, recent on-chain data suggests that ETH may enter a renewed accumulation phase.
MVRV Ratio and Institutional Accumulation Trends
A post uploaded on the CryptoQuant QuickTake platform by a contributor known as Mac has particularly pointed out Ethereum’s Market Value to Realized Value (MVRV) ratio, which suggests the asset is currently undervalued.
The latest data indicates that large-scale investors are increasing their ETH holdings, signaling potential support at key price levels. According to Mac, these accumulation patterns could influence Ethereum’s trajectory in the coming weeks.

Mac revealed that the MVRV ratio, a key on-chain metric used to assess whether an asset is overvalued or undervalued, has fallen below 1 for Ethereum. Historically, such levels indicate an undervalued zone, meaning that Ethereum is trading close to the average purchase price of all holders, including institutional investors.
ETH MVRV: Reaching a Highly Undervalued Zone
“When MVRV falls below 1, it signals entry into an undervalued zone in the cycle, indicating an opportunity to buy at a level close to the average purchase price of all holders (including whale investors).” – By @MAC_D46035 pic.twitter.com/urj348TZng
— CryptoQuant.com (@cryptoquant_com) March 5, 2025
The analyst also mentioned that in past market cycles, when Ethereum’s MVRV dropped below 1, it was followed by notable price recoveries. Additionally, there has been a surge in the number of ETH accumulation addresses—wallets that receive ETH but have never withdrawn.
This suggests that large investors and institutions are strategically increasing their holdings, particularly at the current price range of $2,200–$2,300, where the realized price for whale investors is concentrated. This level is expected to act as a strong support zone, reinforcing the possibility of sustained accumulation.
Market Conditions and Long-Term Ethereum Outlook
Beyond accumulation trends, macroeconomic factors continue to play a role in shaping Ethereum’s price movements. Mac noted that liquidity policies in the US, particularly the Trump administration’s trade and monetary policies, have so far influenced risk asset performance, including cryptocurrencies.
Stricter monetary policies and inflation concerns could contribute to “sharp price drops.” Despite this possibility, Mac concluded, noting:
However, Ethereum still maintains its position as the second-largest cryptocurrency by market cap and is a proven network with thousands of mature DeFi projects. As such, institutional investors are likely to accumulate more in this undervalued zone. Therefore, from a long-term perspective, the outlook for Ethereum remains positive.
Featured image created with DALL-E, Chart from TradingView

Crypto analyst Tony Severino has drawn similarities between Ethereum’s price action in 2024 and this year. Specifically, the analyst highlighted important technical indicators and what they are saying about ETH’s future trajectory.
Ethereum’s Price Action In 2024 Vs. 2025 Based On Important Technical Indicators
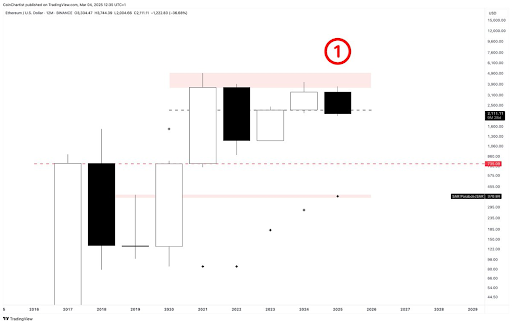
In an X post, Tony Severino provided a Japanese candlestick, TD Sequential and Parabolic SAR analysis of the 2024 and 2025 Ethereum price action. He noted that ETH’s 2024 candle made a lower high both on a candle close and wick high basis. On the other hand, he revealed that 2025’s candlestick is currently a bearish engulfing with the candle body fully engulfing 2024’s candlestick and is entering 2023’s candle body.
Related Reading
Meanwhile, Severino stated that the yearly support is drawn at $735, while the Parabolic SAR is at $370. He also remarked that the TD Sequential count is now on a red 1, potentially denoting the start of Ethereum’s first ever yearly downtrend. The analyst assured that it is still very early to worry about a yearly candlestick that has ten more months to close.
Ethereum is currently in a downtrend, having dropped below $2,000 yesterday for the first time since December 2023. Although ETH has recovered above this psychological level, concerns remain about its current price action. As Severino noted, the Ethereum price could be facing its first-ever yearly downtrend.
Ethereum began the year in an unusual manner, recording a negative monthly close in both January and February, the first time this has happened. Crypto analyst Ali Martinez warned that the Ethereum price could still drop to as low as $1,600 or even $1.200, having broken below the lower boundary of a parallel channel.
ETH’s Bottom Might Be In
In an X post, crypto analyst Titan of Crypto asserted that Ethereum’s bottom is in. He revealed that the 2024 low has been swept on ETH’s perpetual daily chart, tapping into what the analyst believes is the most significant point of interest for a potential reversal. The analyst’s accompanying chart suggested that the Ethereum price could still come close to or even reach its current all-time high (ATH).
Related Reading
In the short term, the Ethereum price is still expected to rebound. The analyst revealed that two ETH CME futures gaps remain unfilled above $2,500. The first is between $2,540 and $2,620, while the second is between $2,900 and $3,300. He noted that these ETH CME futures gaps traditionally tend to get filled, indicating that the crypto could soon rebound to these price levels.
At the time of writing, the Ethereum price is trading at around $2,176, up over 3% in the last 24 hours, according to data from CoinMarketCap.
Featured image from Unsplash, chart from Tradingview.com

Ethereum Addresses Holding Over 10,000 ETH Droped To 919 In Two Weeks – Insights

265Dots to Offer Investment Products for Polkadot-Based Assets

Solana Price Faces First Death Cross After 17 Months; What’s Next

Mt. Gox Transfers 1200 Bitcoins: Is a Sell-Off Coming?

Ethena Price Rises 17%, But Here’s Why ENA May Fail Breakout

US DXY Decline Below 200 MA Sparks Speculation of Crypto Rally

2.52 Million Altcoins Are Ruining Crypto’s Future

Animoca Brands Valuation Tanks 75% In Two Years, Here’s Why

Crypto exchange BingX hacked for $43 million

Are The Big Players Losing Interest?

Hong Kong’s Securities Association Tips Authorities On Crypto Self-Regulation

Coinbase cbBTC Set to go Live on Solana
2.52 Million Altcoins Are Ruining Crypto’s Future
Animoca Brands Valuation Tanks 75% In Two Years, Here’s Why
Crypto exchange BingX hacked for $43 million
Are The Big Players Losing Interest?
Hong Kong’s Securities Association Tips Authorities On Crypto Self-Regulation
Coinbase cbBTC Set to go Live on Solana
-
 Market22 hours ago
3 Key Things to Expect From the White House Crypto Summit
-

 Market18 hours ago
Bitwise Files for Aptos ETF, Sparking a 18% Rally for APT
-

 Ethereum22 hours ago
Ethereum’s Price Next Move: ETH Eyes Bullish Breakout From Key Chart Pattern
-
 Altcoin17 hours ago
Dogecoin Price Eyes Rally As Wallet Addresses Reach All Time High
-
 Altcoin21 hours ago
Ripple Whales Move Over $5 Bln Coins, What’s Happening?
-

 Ethereum21 hours ago
What Important Technical Indicators Are Saying
-

 Market20 hours ago
Solana Whale Action Hints at Big Move—$138 or $160 Next?
-
 Altcoin20 hours ago
Can The XRP Price Reach $10,000 Following XRP’s Inclusion In Strategic Reserve?