
Market
Hedera (HBAR) Surges 30%, Faces Key Resistance Level

Hedera (HBAR) has surged more than 6% in the last 24 hours, bringing its market cap to $10.6 billion. With its price up nearly 30% over the past week, HBAR stands out as one of the top-performing altcoins among the largest in the market.
This strong rally has pushed key technical indicators into bullish territory, with BBTrend reaching its highest level in over a month and the Ichimoku Cloud structure showing sustained upward momentum. If HBAR maintains this strength, it could soon test critical resistance levels, with the potential to surpass $0.35 in March.
Hedera BBTrend Is On Its Highest Levels In More Than a Month
Hedera BBTrend is currently at 18.15, maintaining a positive stance for over a day. Earlier today, it reached a peak of 21.3, marking its highest level since late January.
While it has pulled back slightly from that peak, the indicator remains elevated, suggesting that the recent uptrend is still intact.
This sustained positivity in BBTrend indicates strong directional momentum in HBAR’s price action, aligning with broader market trends.
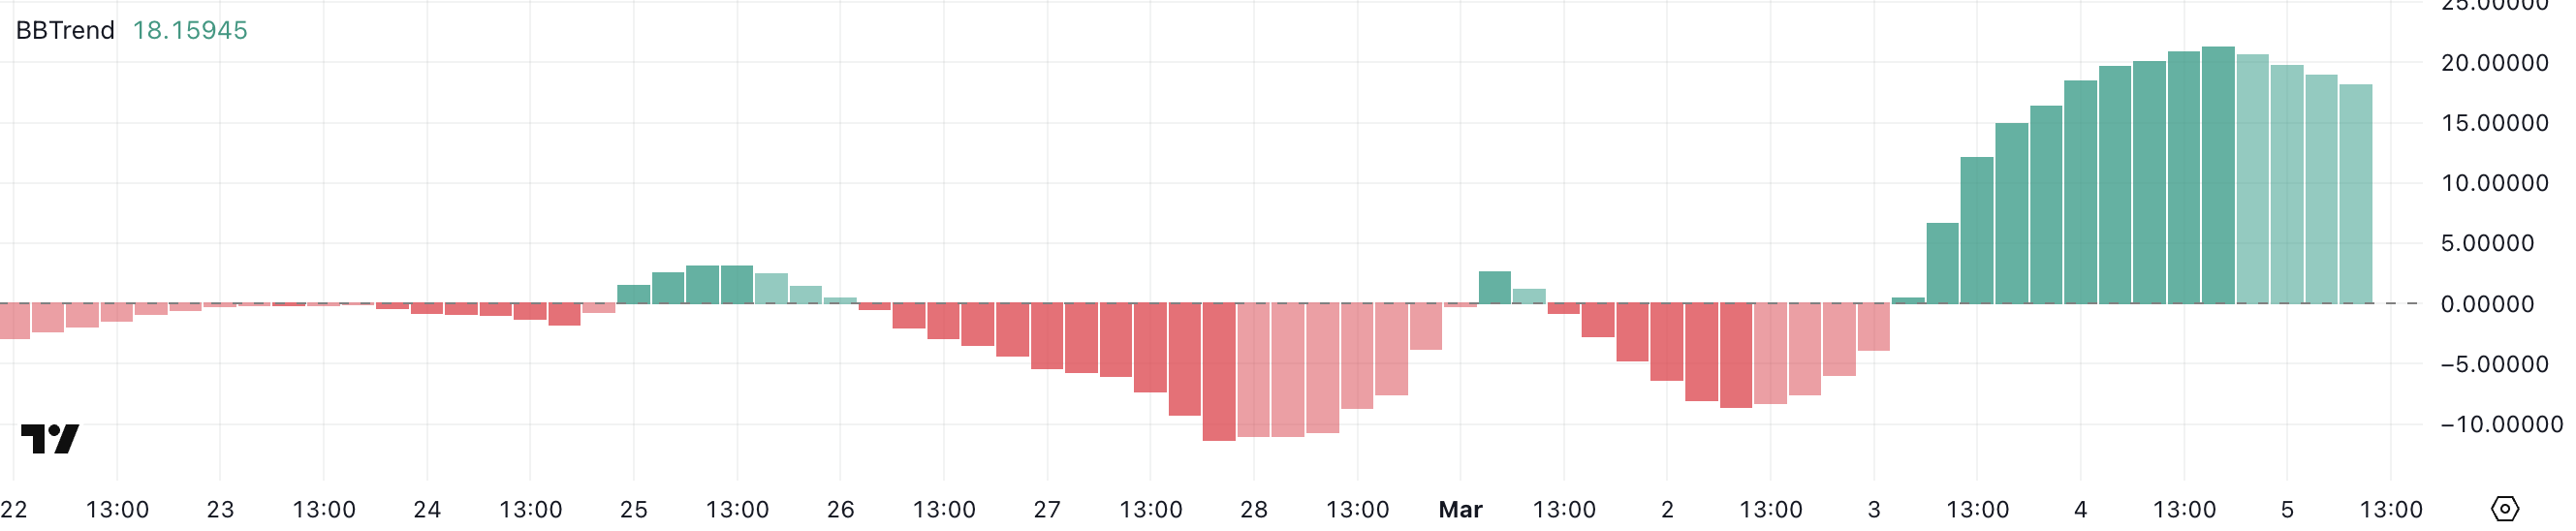
BBTrend, or Bollinger Band Trend, is a technical indicator that measures trend strength based on the relationship between price and Bollinger Bands. When BBTrend is positive, it suggests that the price is trading in the upper portion of the Bollinger Bands, often signaling an ongoing bullish trend.
In HBAR’s case, the current level of 18.15 – while lower than its earlier peak of 21.3 – still reflects a strong upward bias. If this trend remains elevated, it could indicate continued bullish momentum for HBAR, but the slight pullback from 21.3 suggests some moderation in buying pressure.
Whether this leads to consolidation or further upside will depend on market follow-through and broader sentiment shifts.
HBAR Ichimoku Cloud Shows a Bullish Setup
According to the Ichimoku Cloud, Hedera is currently positioned in a bullish structure. The price is trending above the blue conversion line and the red baseline, indicating short-term bullish momentum.
The green leading span A is sloping upward, while the orange leading span B remains relatively steady, forming an ascending cloud that suggests growing support. Additionally, the lagging span (green line) is above the price from 26 periods ago, reinforcing the strength of the ongoing trend.
However, the price is consolidating just above the red baseline, signaling a potential decision point between continuation or a short-term pullback.
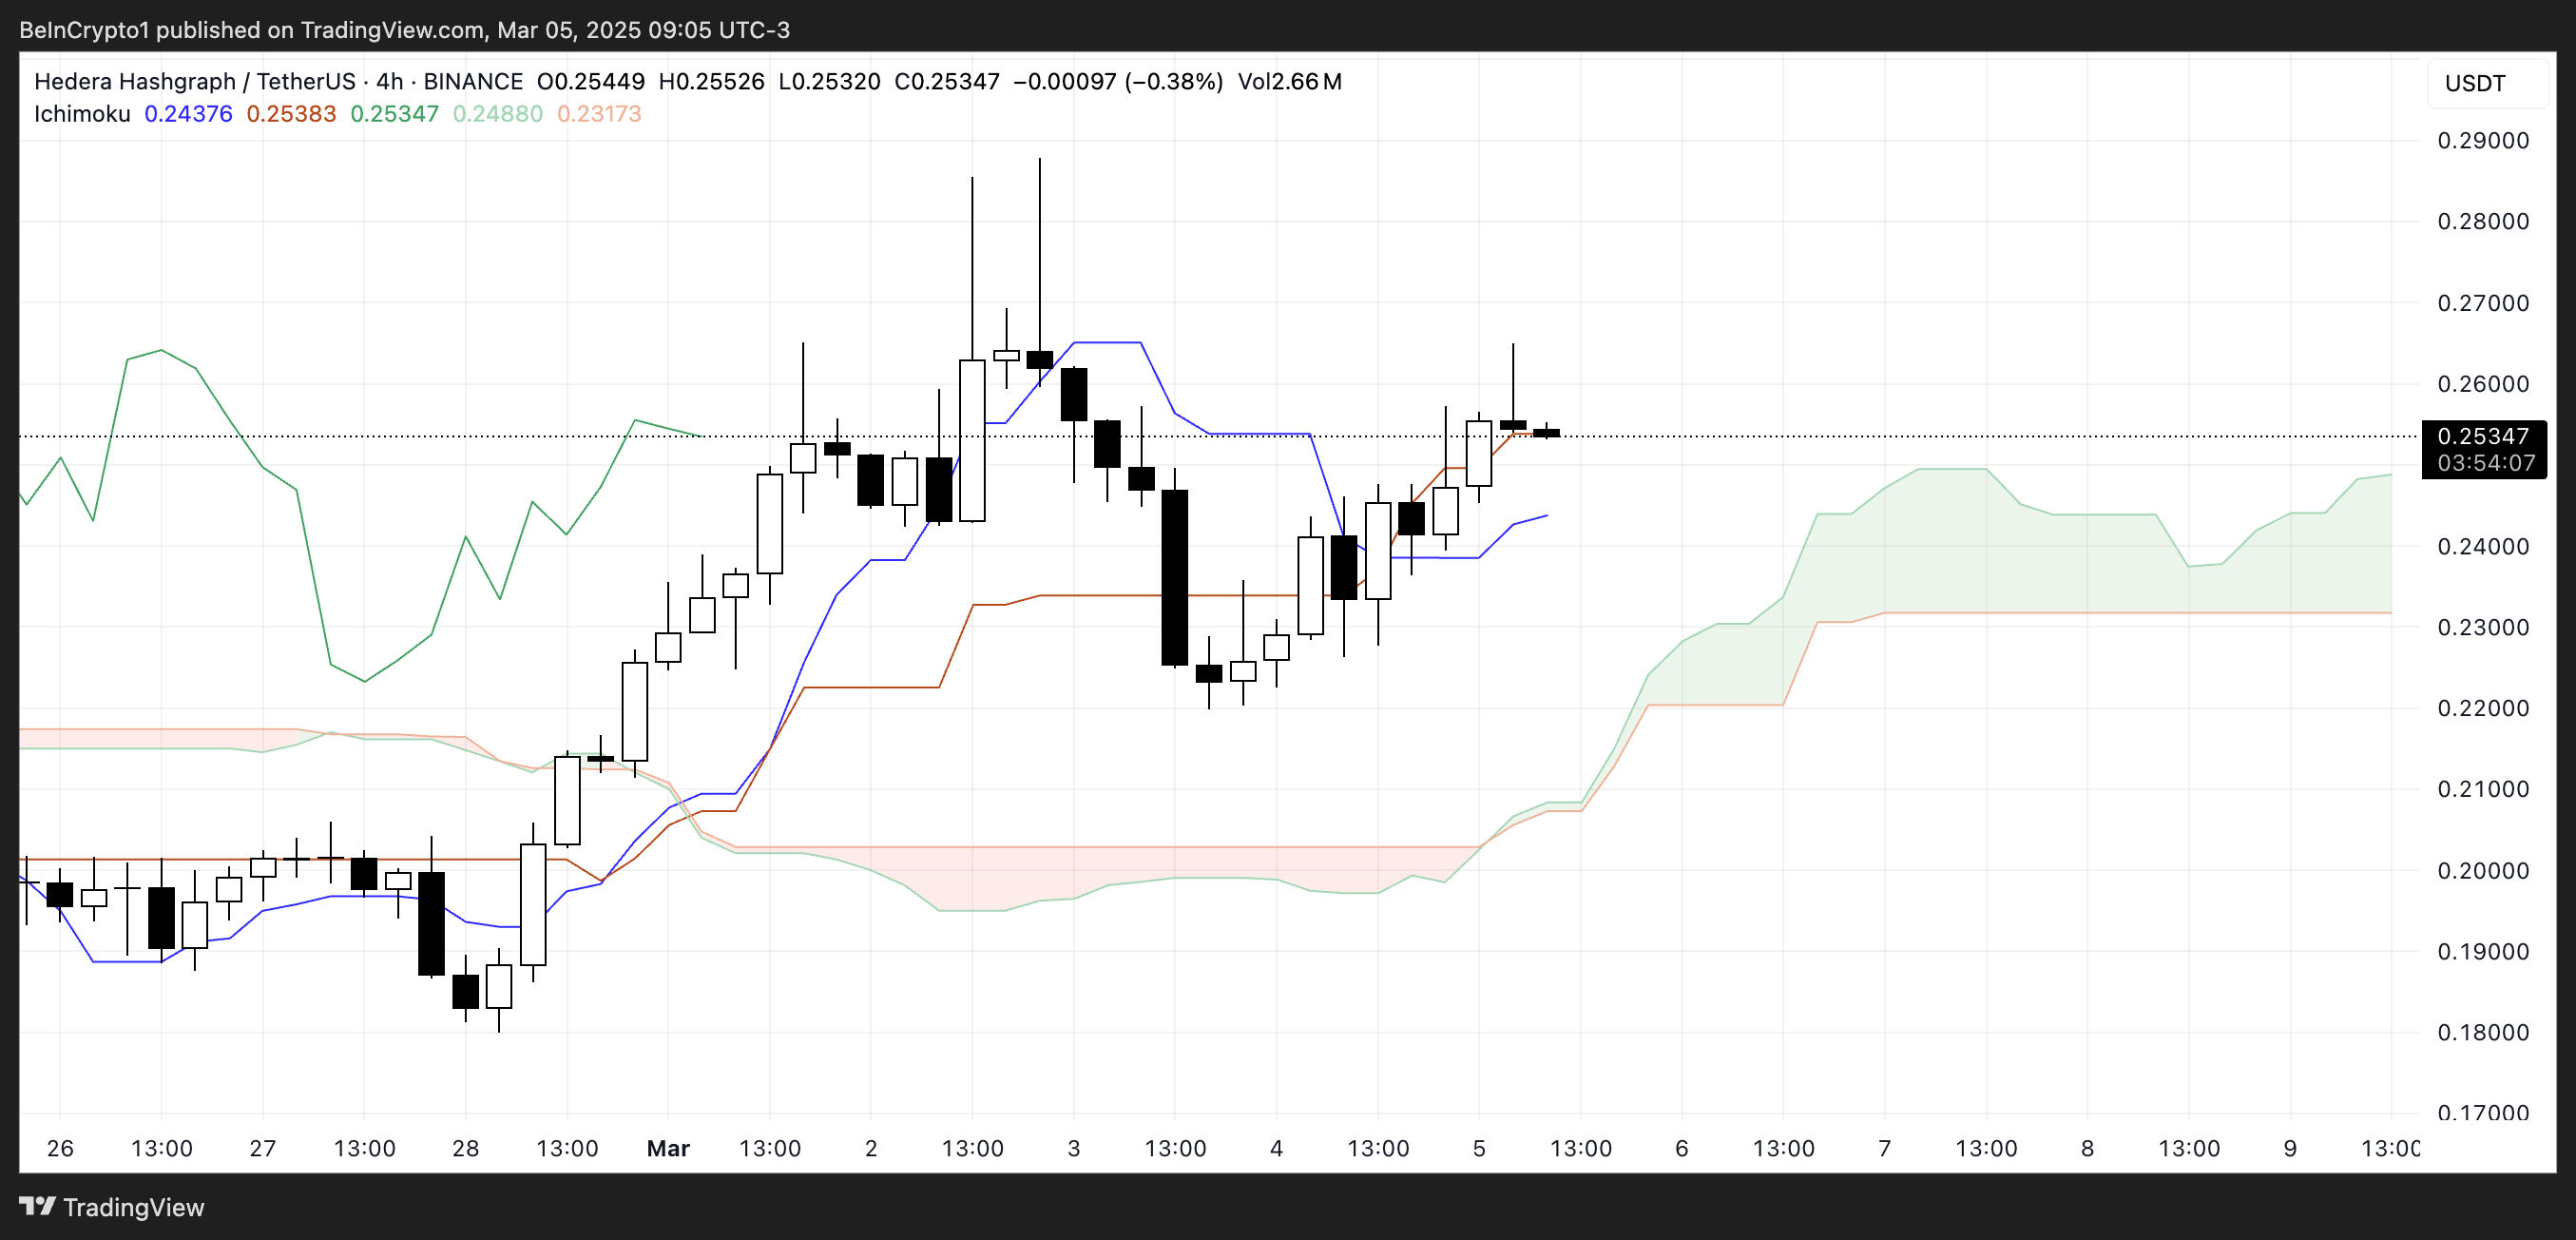
The Ichimoku Cloud provides a multi-faceted view of trend direction and key support-resistance zones. When the price is above the cloud, it signals a dominant bullish trend, while movement below would indicate a shift in sentiment.
The current positioning above both the blue conversion line and red baseline suggests that bullish momentum is intact. If the price maintains this structure, further upside could be expected, especially as the green leading span A continues to rise.
However, a drop below the red baseline would indicate weakening momentum, potentially leading to a test of the cloud’s support region. The thickness of the cloud ahead suggests a moderate support zone, meaning any pullback would face resistance before shifting the overall trend.
Hedera (HBAR) Could Surpass $0.35 In March
Hedera EMA lines indicate a bullish trend, with a golden cross forming yesterday and the possibility of another one soon. A golden cross occurs when a shorter-term EMA crosses above a longer-term EMA, signaling strong upward momentum.
If this setup continues, HBAR could test the next resistance at $0.28. A breakout above this level could open the path for a move toward $0.322.
If buying pressure intensifies and Hedera price regains the strong uptrend seen in previous months, it could push further to test $0.35 and $0.37. In an extended rally, HBAR might even rise above $0.40 for the first time since November 2021, marking a significant recovery.
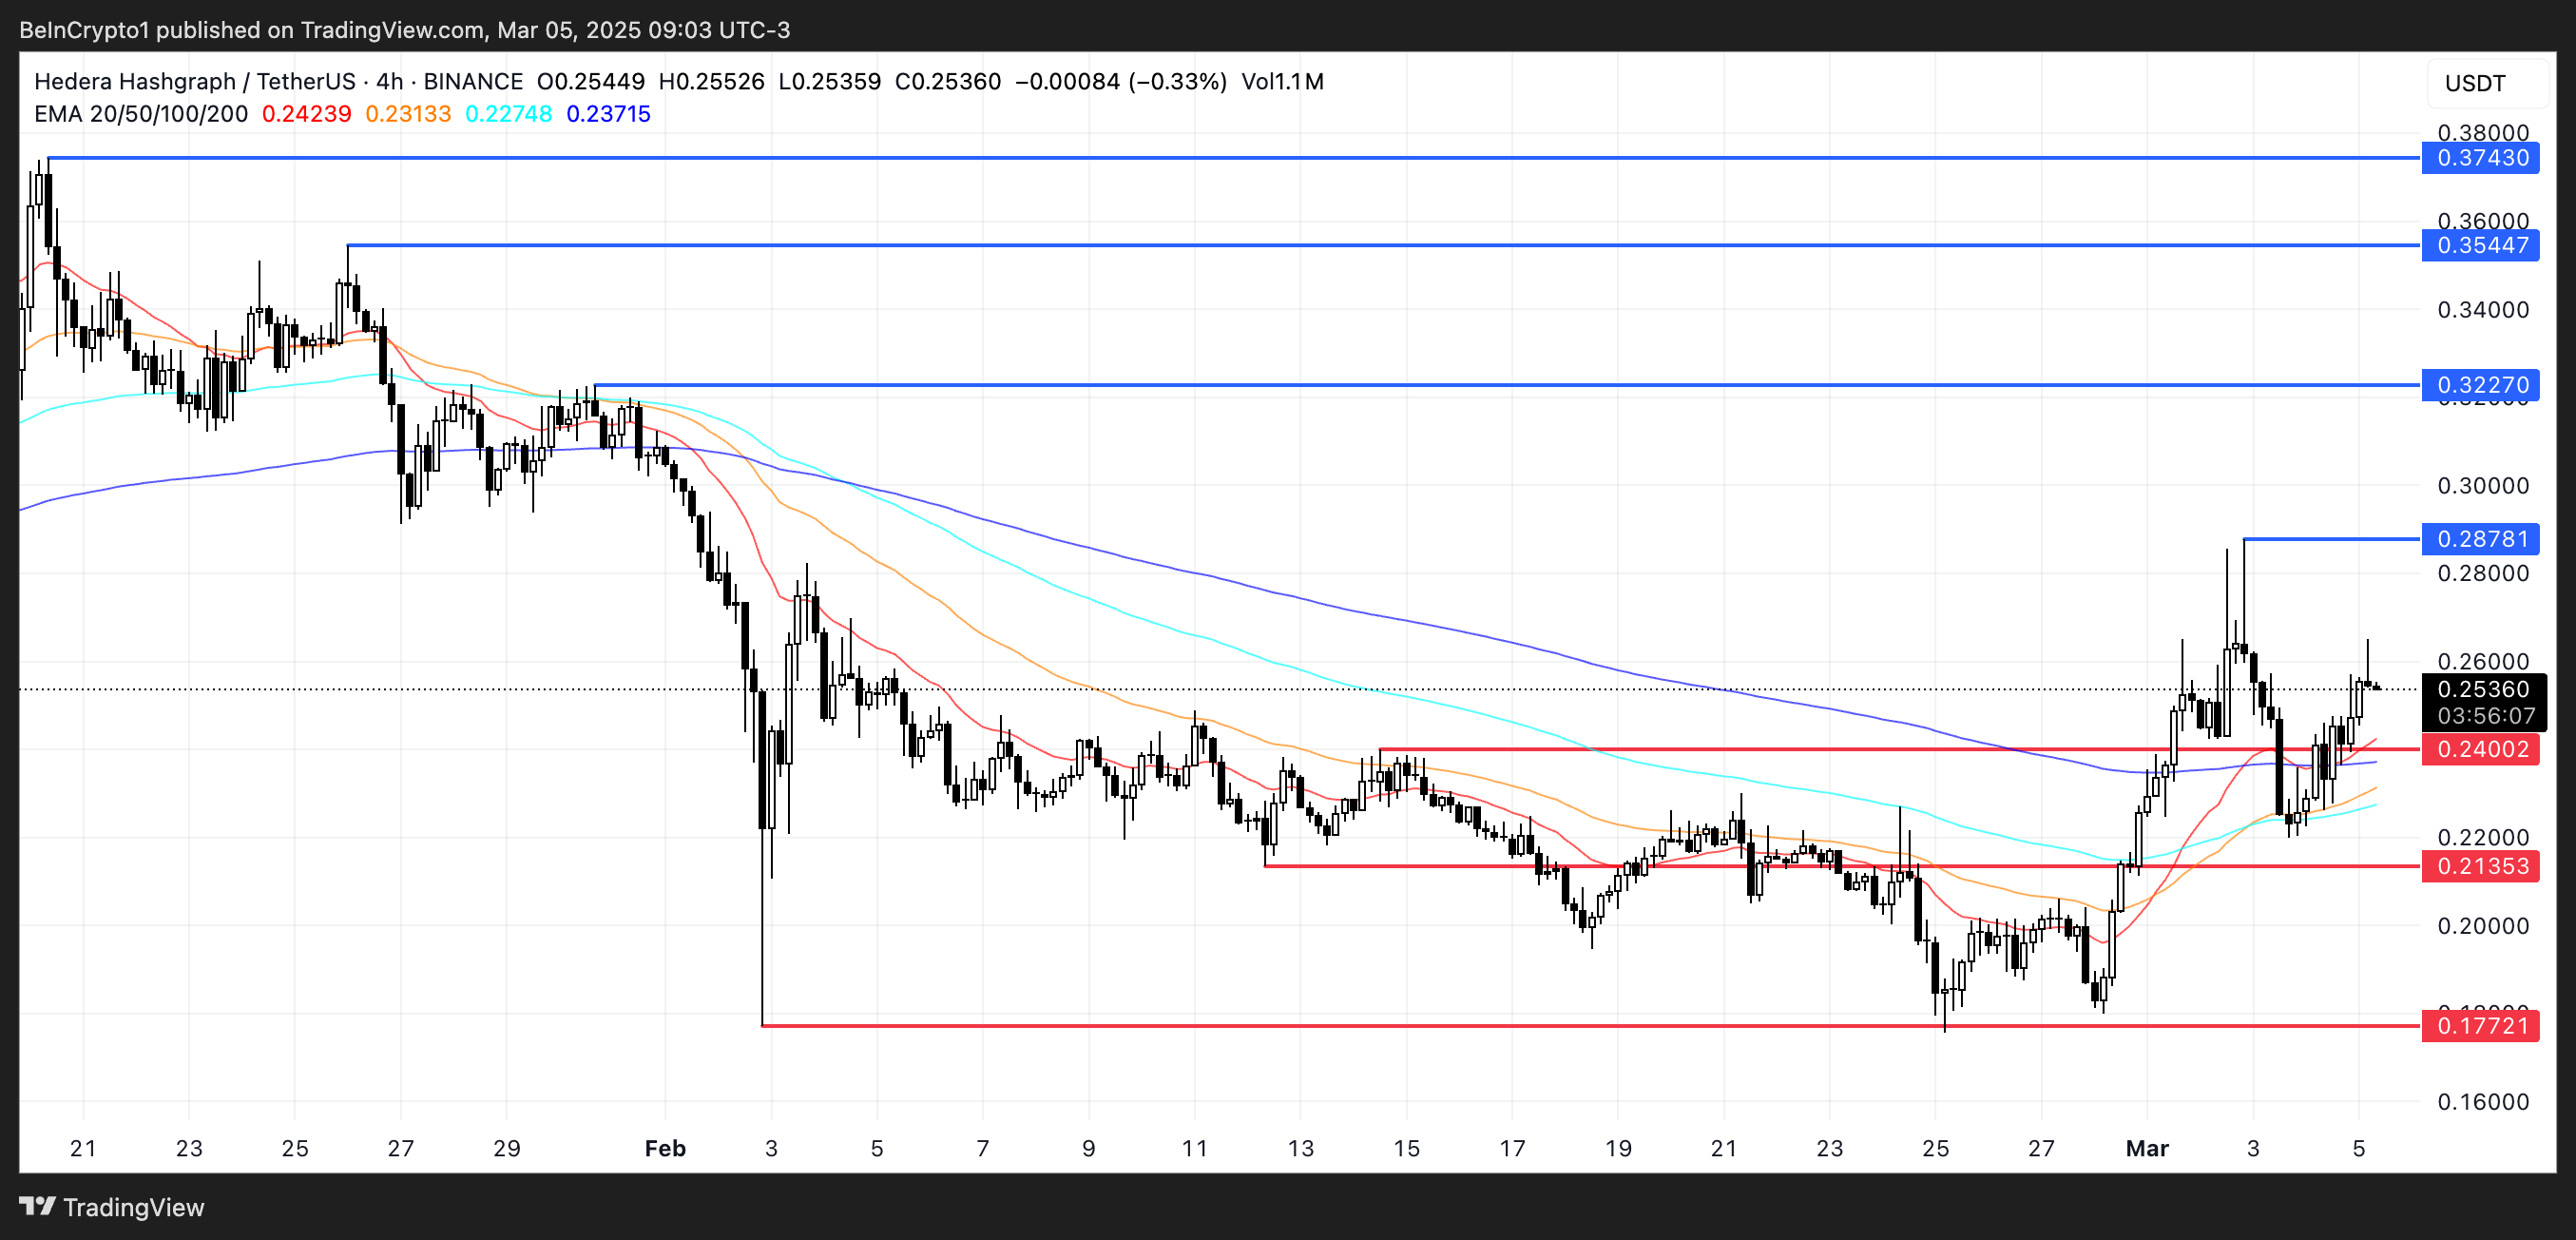
On the other hand, if the uptrend fails to materialize, HBAR could face a retest of the $0.24 support level.
Losing this support would indicate a weakening structure, potentially leading to a decline toward $0.213.
If bearish momentum intensifies and buying interest does not return, Hedera could drop further to $0.177, testing deeper support zones.
Disclaimer
In line with the Trust Project guidelines, this price analysis article is for informational purposes only and should not be considered financial or investment advice. BeInCrypto is committed to accurate, unbiased reporting, but market conditions are subject to change without notice. Always conduct your own research and consult with a professional before making any financial decisions. Please note that our Terms and Conditions, Privacy Policy, and Disclaimers have been updated.


Ethena (ENA) has recently experienced a price uptick of 17%, following a challenging start to the year. This rise, however, comes after significant losses that started early in 2025, exacerbated by a massive token unlock event in the last 48 hours.
Despite some positive movement, ENA still faces major hurdles in securing a sustained breakout.
Ethena Faces A Bearish Event
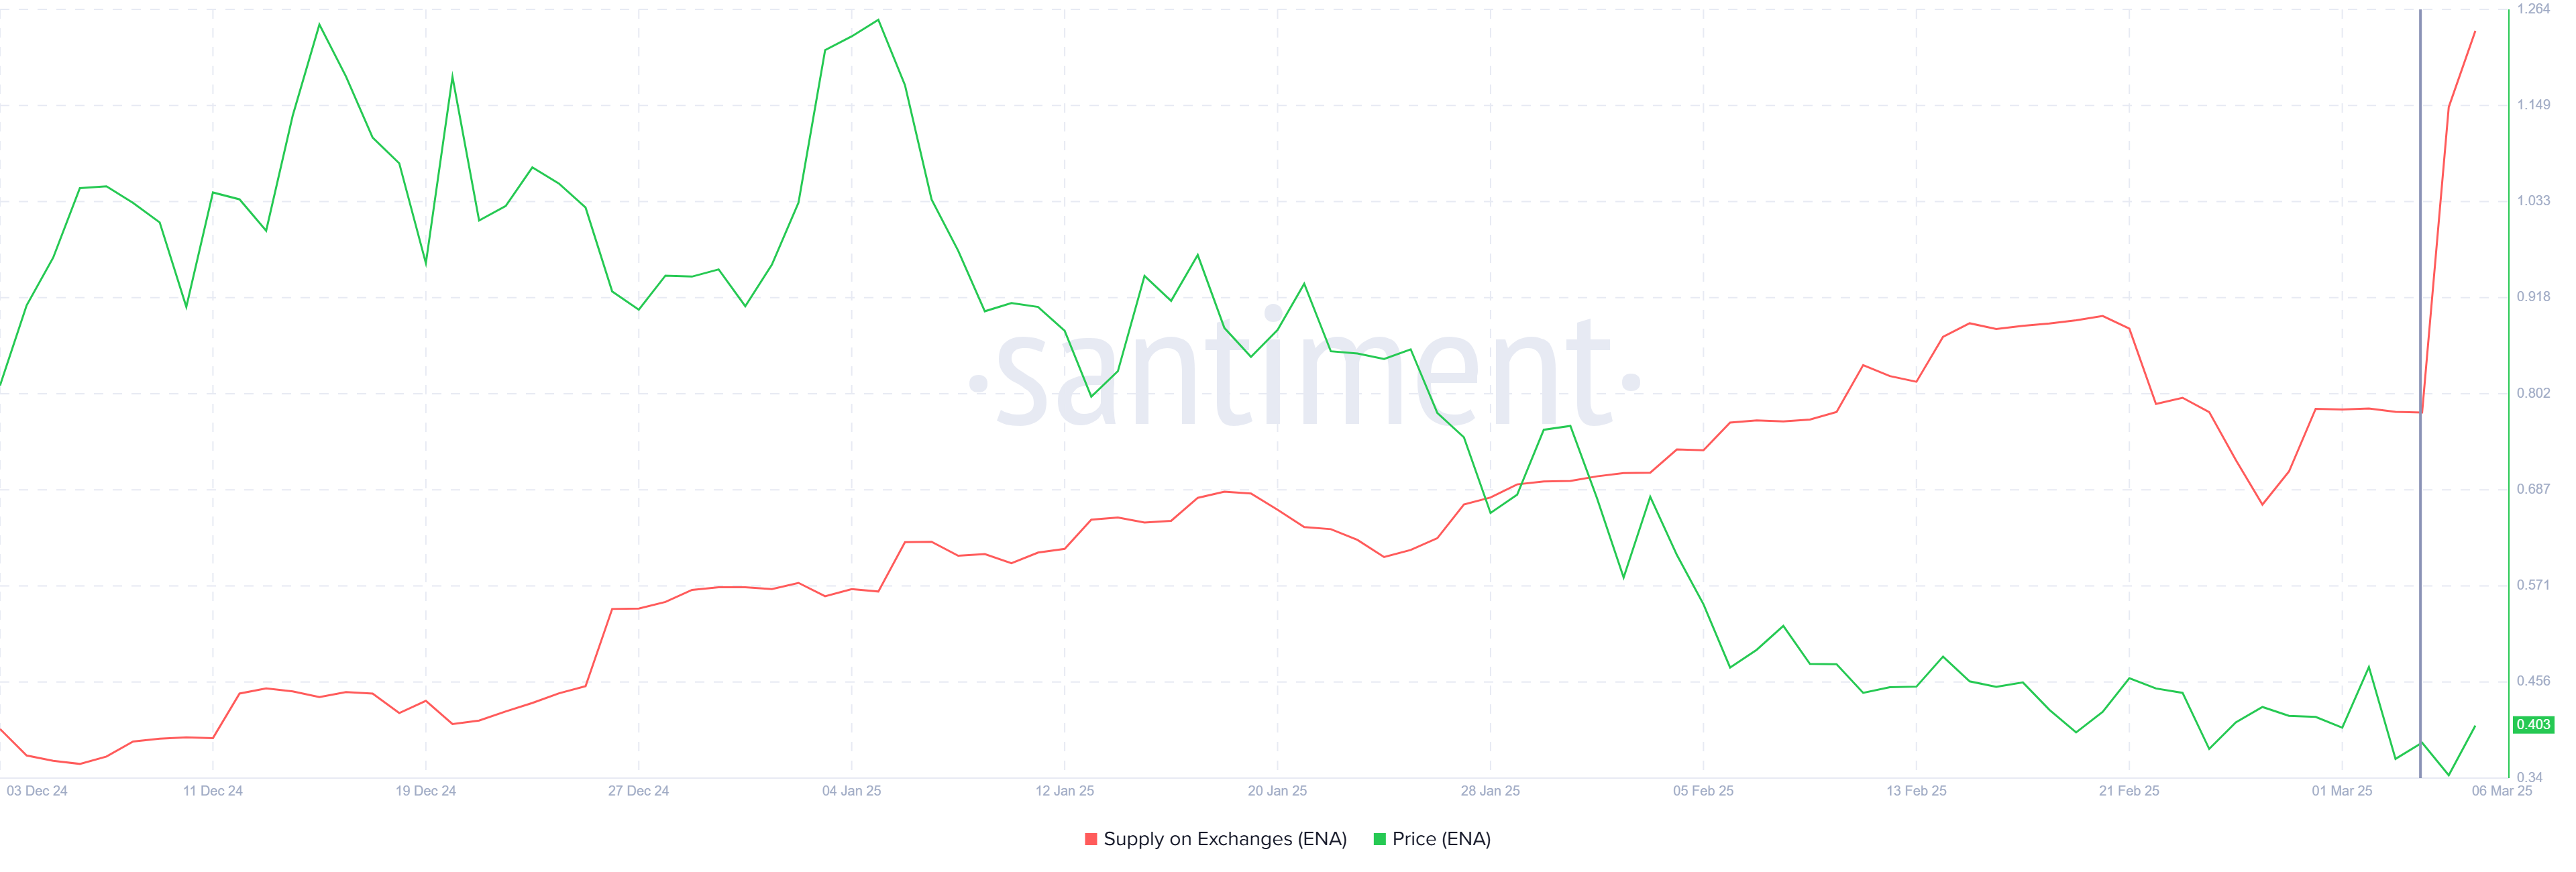
The market sentiment surrounding Ethena has been marked by increased selling activity, especially in the days leading up to the March 5 token unlock. Within a 24-hour period before the event, approximately 149 million ENA tokens, worth around $60 million, were sold.
This was in response to the expectation that the unlock, which involved $833 million worth of tokens, would flood the market, affecting the supply-demand balance and driving down prices.
Token unlock events often result in price declines, as the influx of new tokens dilutes the value of existing ones. This dynamic has spooked many investors, especially those who held large amounts of ENA, leading to a sharp rise in balances held on exchanges. Many opted to sell in an attempt to prevent further losses, further contributing to the downward pressure on the price.
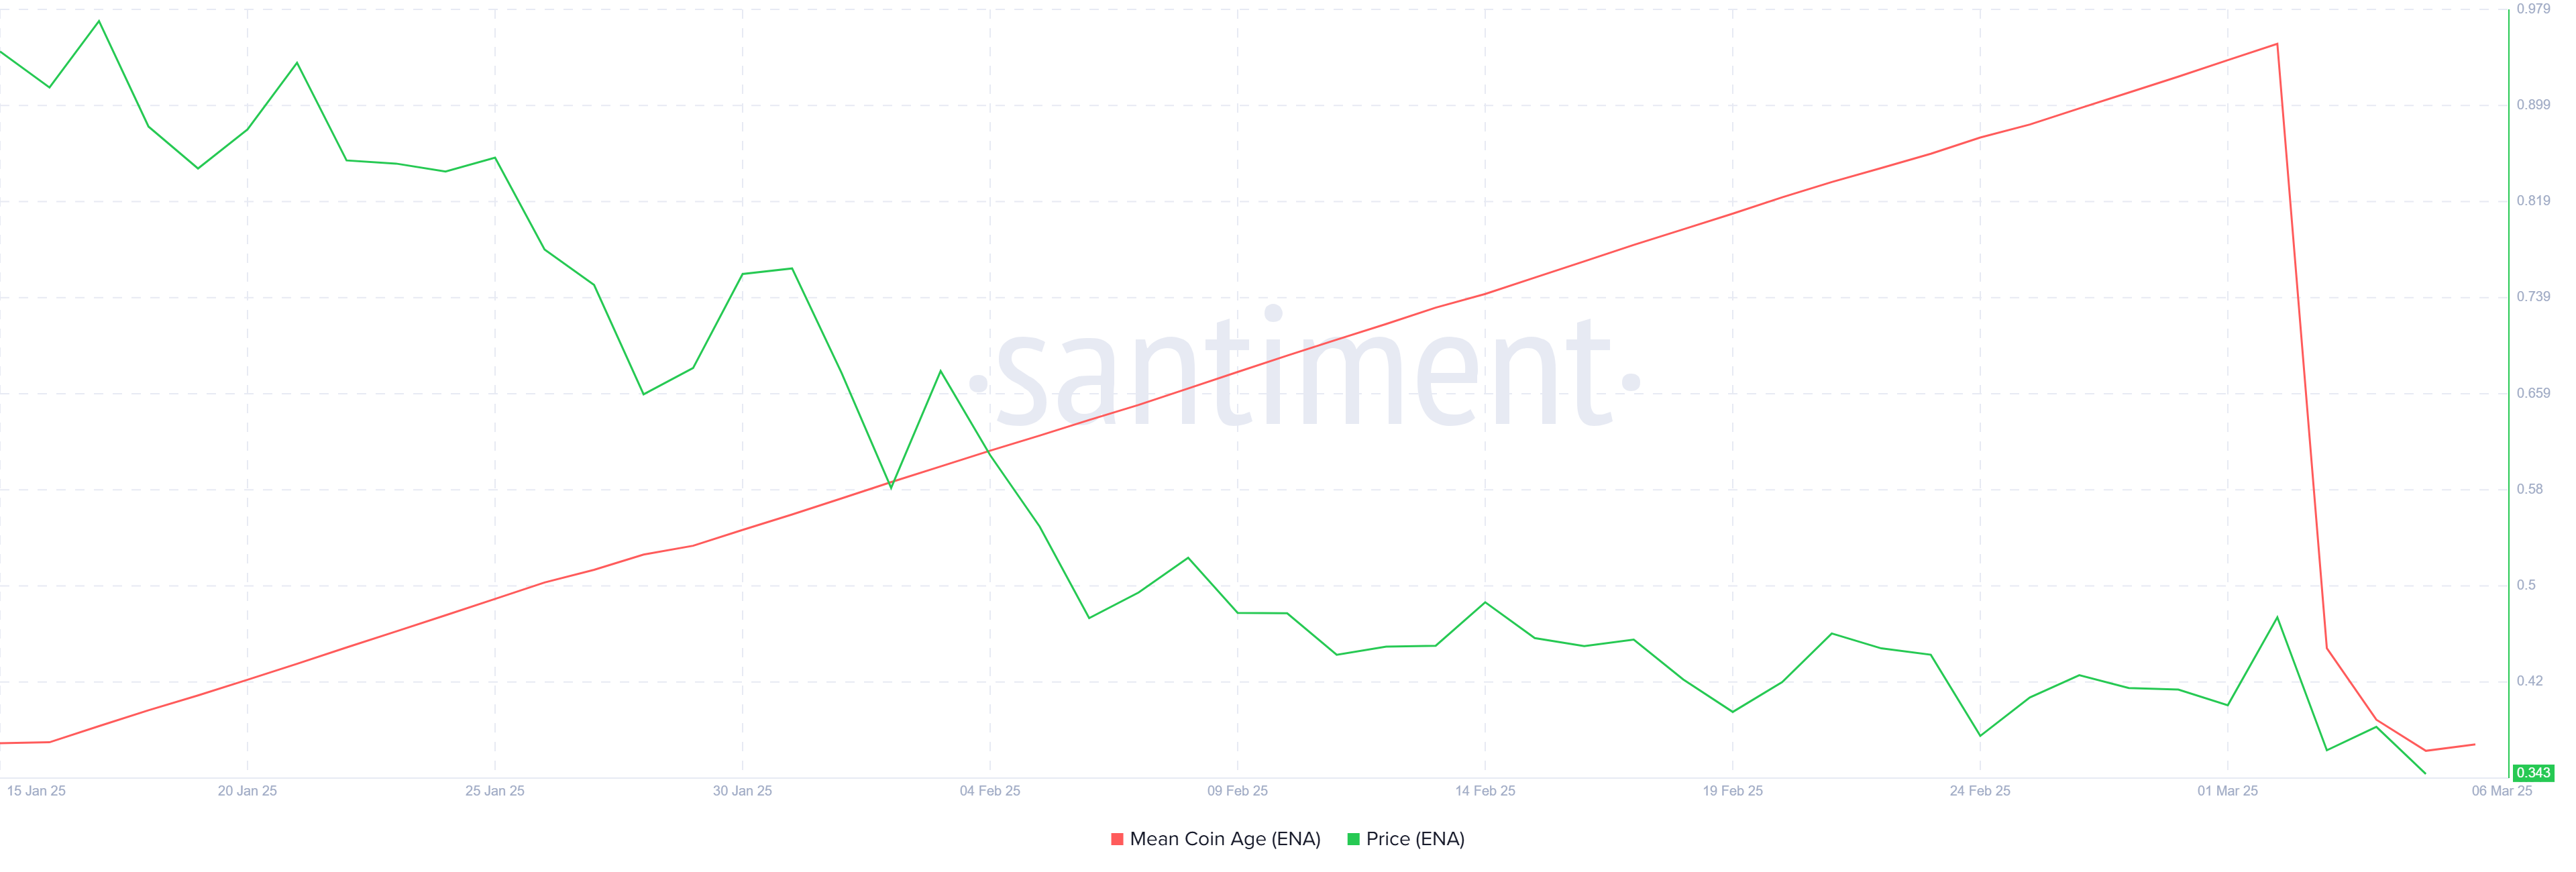
Ethena’s overall momentum has also been negatively affected by the actions of long-term holders (LTHs). The Mean Coin Age (MCA) indicator has shown a significant downtick. This signals that LTHs began liquidating their positions even before the broader market reacted.
LTHs are considered the backbone of any cryptocurrency. Thus, their selling behavior is often a sign of weak sentiment toward the asset.
The decrease in the MCA reflects the loss of confidence among these long-term holders, adding further pressure to Ethena’s price. When LTHs exit their positions, it often signals a broader market reluctance to hold, which can keep the price in a downtrend for an extended period.
ENA Price May Face Some Challenges
At the time of writing, Ethena’s price stands at $0.404, just under the resistance level of $0.434. Despite a 17% rise, this move was not enough to reverse the broader downtrend. For ENA to break free of the current market conditions, it needs to breach the $0.434 barrier and sustain higher levels decisively.
If the bearish sentiment persists and the aforementioned factors worsen, Ethena could see a decline toward the $0.326 support level. Should this support fail, further downside risk remains, with the price potentially slipping as low as $0.259, confirming the bearish outlook.
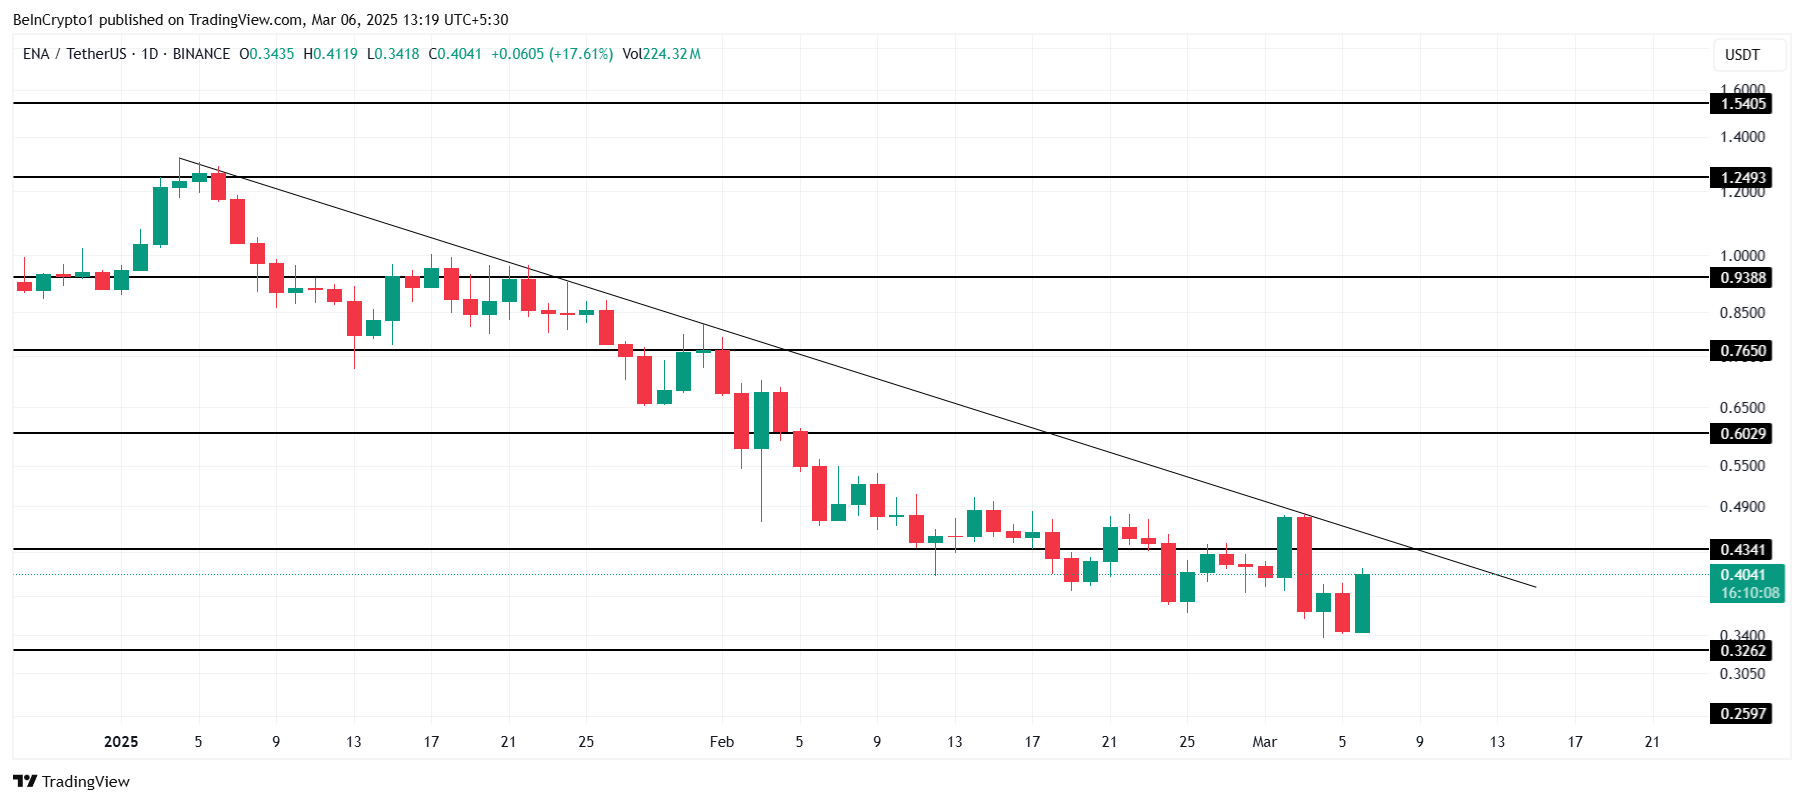
However, if investor sentiment shifts and there is a concerted effort to accumulate ENA at these lower prices, a breakout could be on the horizon. A successful breach of $0.434, followed by a flip into support, would set ENA on a trajectory toward $0.602. This scenario would invalidate the bearish thesis and provide a path for long-term recovery.
Disclaimer
In line with the Trust Project guidelines, this price analysis article is for informational purposes only and should not be considered financial or investment advice. BeInCrypto is committed to accurate, unbiased reporting, but market conditions are subject to change without notice. Always conduct your own research and consult with a professional before making any financial decisions. Please note that our Terms and Conditions, Privacy Policy, and Disclaimers have been updated.

Bitcoin price started a recovery wave from the $82,000 zone. BTC is back above $88,500 and might revisit the $95,000 resistance zone.
- Bitcoin started a fresh upward move from the $82,000 zone.
- The price is trading above $90,000 and the 100 hourly Simple moving average.
- There was a break above a connecting bearish trend line with resistance at $90,000 on the hourly chart of the BTC/USD pair (data feed from Kraken).
- The pair could start another decline if it fails to clear the $95,000 resistance zone.
Bitcoin Price Starts Recovery
Bitcoin price started a fresh decline below the $92,000 level. BTC traded below the $90,000 and $88,000 support levels. Finally, the price tested the $82,000 support zone.
A low was formed at $81,434 and the price recently started a recovery wave. There was a move above the $85,000 and $88,000 resistance levels. The bulls pushed the price above the 50% Fib retracement level of the downward move from the $95,000 resistance to the $81,434 low.
There was also a break above a connecting bearish trend line with resistance at $90,000 on the hourly chart of the BTC/USD pair. Bitcoin price is now trading above $90,000 and the 100 hourly Simple moving average.
On the upside, immediate resistance is near the $91,800 level or the 76.4% Fib retracement level of the downward move from the $95,000 resistance to the $81,434 low. The first key resistance is near the $92,500 level. The next key resistance could be $93,500.

A close above the $93,500 resistance might send the price further higher. In the stated case, the price could rise and test the $95,000 resistance level. Any more gains might send the price toward the $96,200 level or even $98,000.
Another Decline In BTC?
If Bitcoin fails to rise above the $92,000 resistance zone, it could start a fresh decline. Immediate support on the downside is near the $88,000 level. The first major support is near the $86,200 level.
The next support is now near the $85,000 zone. Any more losses might send the price toward the $82,000 support in the near term. The main support sits at $80,000.
Technical indicators:
Hourly MACD – The MACD is now gaining pace in the bullish zone.
Hourly RSI (Relative Strength Index) – The RSI for BTC/USD is now above the 50 level.
Major Support Levels – $88,000, followed by $85,000.
Major Resistance Levels – $92,000 and $93,500.

BioNexus Gene Lab Corp, a Wyoming-based healthcare technology company, has become the first Nasdaq-listed company to adopt Ethereum (ETH) as its primary treasury asset.
The announcement was made on March 5. It was accompanied by the release of a strategic whitepaper detailing the company’s rationale for prioritizing Ethereum over Bitcoin (BTC).
BioNexus Chooses Ethereum Over Bitcoin
The board-approved Ethereum treasury strategy positions BioNexus at the forefront of a growing trend of corporations integrating digital assets into their financial frameworks. Unlike Bitcoin, often hailed as a digital “store of value,” BioNexus is betting on Ethereum’s versatility as a programmable blockchain platform.
“Ethereum offers high liquidity, utility, and stability compared to other digital assets, positioning BGLC as a leader in blockchain-integrated corporate finance,” CEO Sam Tan said.
The company’s whitepaper emphasizes the preference for Ethereum due to its broader utility, significant institutional adoption, and key features that make it ideal for corporate treasury management.
Ethereum is widely used in decentralized finance (DeFi) and stablecoin transactions. This enables cost-effective cross-border payments. Its Proof-of-Stake (PoS) mechanism also offers staking rewards of 3-5% annually, turning ETH into an income-generating asset.
BioNexus also pointed to Ethereum’s institutional credibility. Major financial players like BlackRock, Grayscale, and Fidelity have embraced Ethereum. This lends it legitimacy, which the company believes will ensure its long-term viability.
The whitepaper also touts Ethereum’s scalability. Upcoming upgrades like Pectra further bolster this. Additionally, Ethereum’s Layer-2 solutions further enhance its appeal for enterprise use by reducing costs.
With growing institutional adoption and real-world applications like tokenized assets and decentralized payments, the company believes Ethereum is set to lead the future of corporate finance.
“We believe Ethereum is more than a digital asset—it is a new financial paradigm. BGLC’s commitment to an Ethereum-first treasury strategy underscores our confidence in its stability, institutional growth, and transformative potential,” the whitepaper read.
Nonetheless, the move comes at a tumultuous time for Ethereum. ETH’s market performance has been shaky, with its value continuously declining since early December.
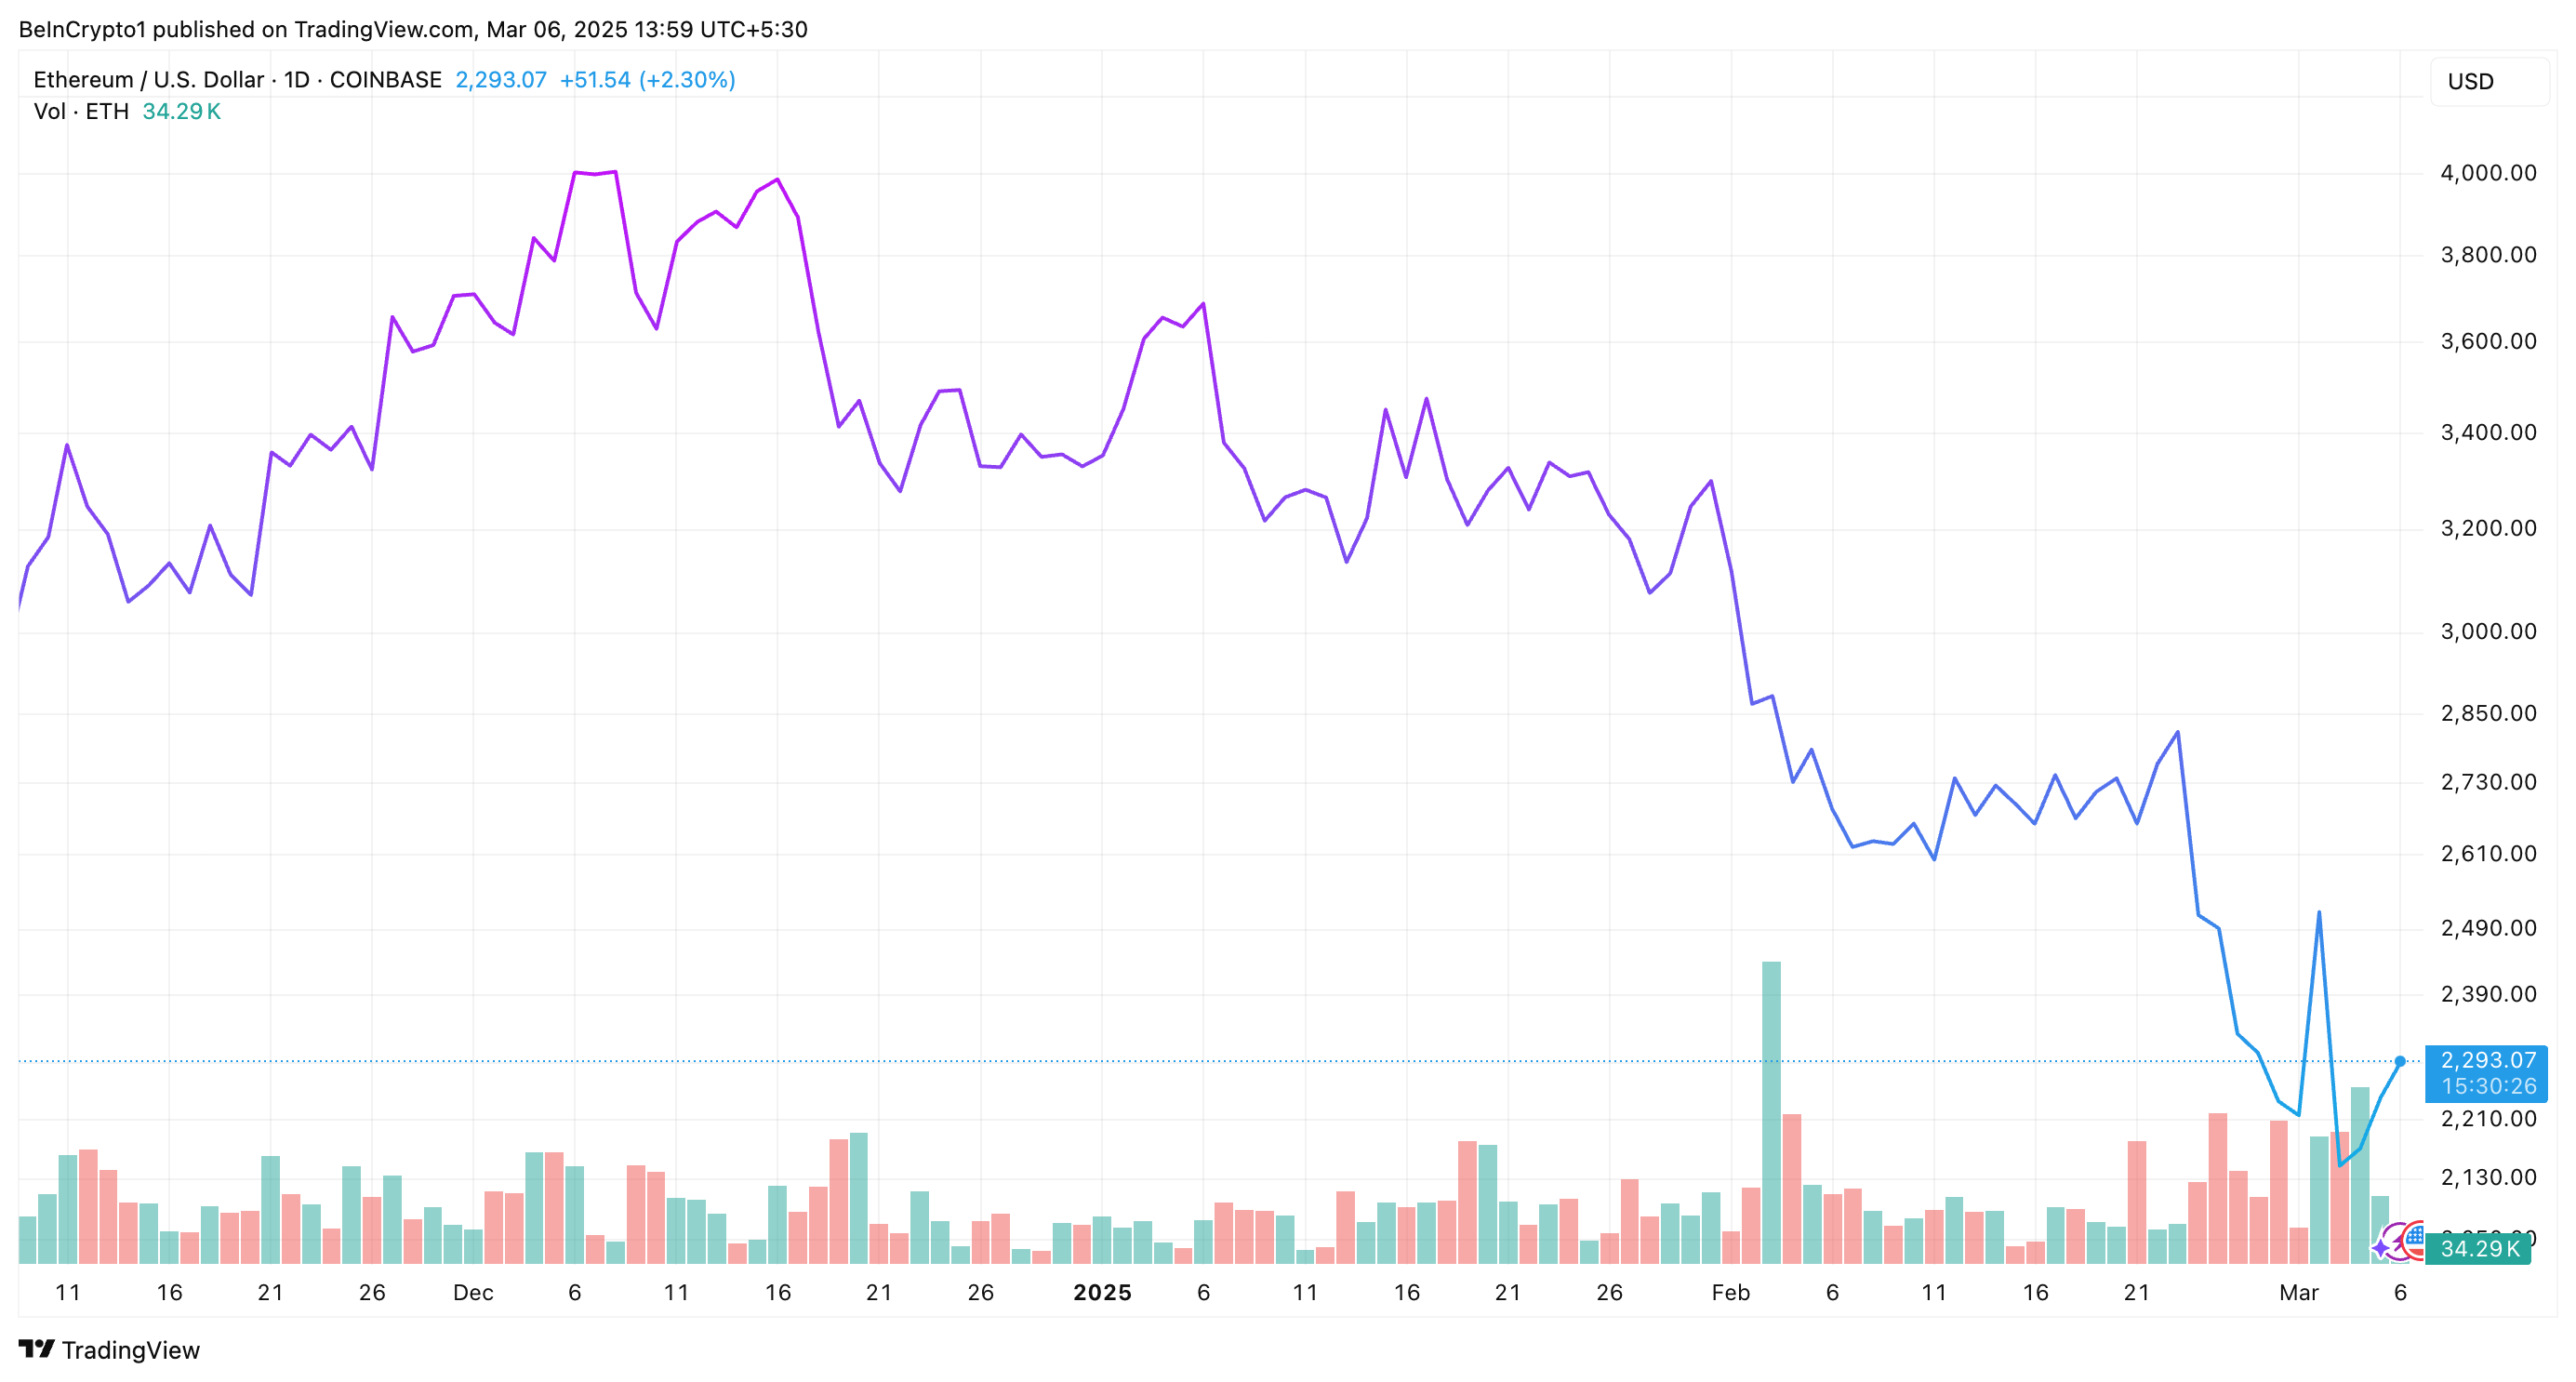
Over the past month alone, ETH has shed 15.8% of its gains. At press time, it traded at $2,293. As per BeInCrypto data, this represented a slight appreciation of 3.3% over the past day.
Meanwhile, Ethereum ETFs have also majorly recorded outflows since February 20, with the exception of March 4. According to data from SoSo Value, on March 5, the total outflows were recorded at $63.3 million. The outflow was from Grayscale Ethereum Trust (ETHE). Furthermore, other ETFs saw no flows at all.
Disclaimer
In adherence to the Trust Project guidelines, BeInCrypto is committed to unbiased, transparent reporting. This news article aims to provide accurate, timely information. However, readers are advised to verify facts independently and consult with a professional before making any decisions based on this content. Please note that our Terms and Conditions, Privacy Policy, and Disclaimers have been updated.

Ethena Price Rises 17%, But Here’s Why ENA May Fail Breakout

US DXY Decline Below 200 MA Sparks Speculation of Crypto Rally

Bitcoin Price Attempts a Comeback—Is a Recovery Rally on the Horizon?

BioNexus Chooses Ethereum as Treasury Asset Over Bitcoin

XRP Price Gears Up—Can It Overcome Key Resistance Levels?

Uniswap’s Unichain L2 Raises Red Flags About Tokenholder Rights

2.52 Million Altcoins Are Ruining Crypto’s Future

Animoca Brands Valuation Tanks 75% In Two Years, Here’s Why

Crypto exchange BingX hacked for $43 million

Are The Big Players Losing Interest?

Hong Kong’s Securities Association Tips Authorities On Crypto Self-Regulation

Coinbase cbBTC Set to go Live on Solana
2.52 Million Altcoins Are Ruining Crypto’s Future
Animoca Brands Valuation Tanks 75% In Two Years, Here’s Why
Crypto exchange BingX hacked for $43 million
Are The Big Players Losing Interest?
Hong Kong’s Securities Association Tips Authorities On Crypto Self-Regulation
Coinbase cbBTC Set to go Live on Solana
-
 Market21 hours ago
3 Key Things to Expect From the White House Crypto Summit
-

 Market22 hours ago
Pi Price Eyes $3 Milestone Amid Bullish Momentum
-
 Altcoin18 hours ago
Cardano Price Eyes $7 as Analyst Predicts Breakout Above $1.14 Resistance
-
 Regulation17 hours ago
Will The Ripple SEC Case Be Dismissed Before Friday’s Crypto Summit?
-
 Altcoin21 hours ago
WisdomTree Predicts XRP and Solana To Lead Altcoin Season
-

 Market17 hours ago
Bitwise Files for Aptos ETF, Sparking a 18% Rally for APT
-

 Ethereum20 hours ago
Ethereum’s Price Next Move: ETH Eyes Bullish Breakout From Key Chart Pattern
-
 Altcoin20 hours ago
Ripple Whales Move Over $5 Bln Coins, What’s Happening?