
Ethereum
What Important Technical Indicators Are Saying

Crypto analyst Tony Severino has drawn similarities between Ethereum’s price action in 2024 and this year. Specifically, the analyst highlighted important technical indicators and what they are saying about ETH’s future trajectory.
Ethereum’s Price Action In 2024 Vs. 2025 Based On Important Technical Indicators
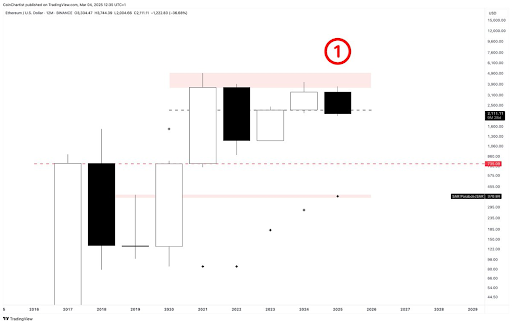
In an X post, Tony Severino provided a Japanese candlestick, TD Sequential and Parabolic SAR analysis of the 2024 and 2025 Ethereum price action. He noted that ETH’s 2024 candle made a lower high both on a candle close and wick high basis. On the other hand, he revealed that 2025’s candlestick is currently a bearish engulfing with the candle body fully engulfing 2024’s candlestick and is entering 2023’s candle body.
Related Reading
Meanwhile, Severino stated that the yearly support is drawn at $735, while the Parabolic SAR is at $370. He also remarked that the TD Sequential count is now on a red 1, potentially denoting the start of Ethereum’s first ever yearly downtrend. The analyst assured that it is still very early to worry about a yearly candlestick that has ten more months to close.
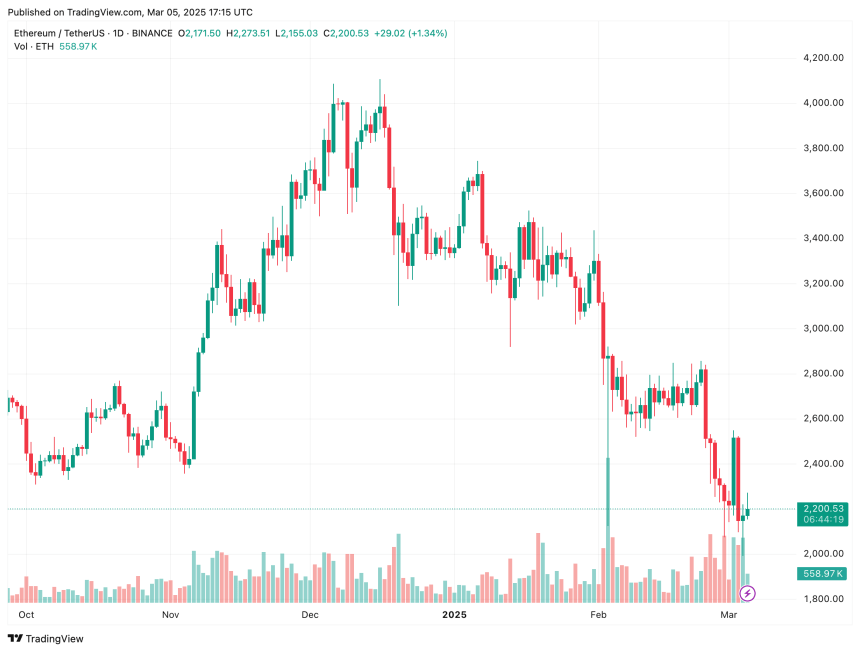
Ethereum is currently in a downtrend, having dropped below $2,000 yesterday for the first time since December 2023. Although ETH has recovered above this psychological level, concerns remain about its current price action. As Severino noted, the Ethereum price could be facing its first-ever yearly downtrend.
Ethereum began the year in an unusual manner, recording a negative monthly close in both January and February, the first time this has happened. Crypto analyst Ali Martinez warned that the Ethereum price could still drop to as low as $1,600 or even $1.200, having broken below the lower boundary of a parallel channel.
ETH’s Bottom Might Be In
In an X post, crypto analyst Titan of Crypto asserted that Ethereum’s bottom is in. He revealed that the 2024 low has been swept on ETH’s perpetual daily chart, tapping into what the analyst believes is the most significant point of interest for a potential reversal. The analyst’s accompanying chart suggested that the Ethereum price could still come close to or even reach its current all-time high (ATH).
Related Reading
In the short term, the Ethereum price is still expected to rebound. The analyst revealed that two ETH CME futures gaps remain unfilled above $2,500. The first is between $2,540 and $2,620, while the second is between $2,900 and $3,300. He noted that these ETH CME futures gaps traditionally tend to get filled, indicating that the crypto could soon rebound to these price levels.
At the time of writing, the Ethereum price is trading at around $2,176, up over 3% in the last 24 hours, according to data from CoinMarketCap.
Featured image from Unsplash, chart from Tradingview.com


Ethereum (ETH), the second-largest cryptocurrency by market cap, is flashing multiple bullish signals that suggest a potential upside move. However, rising exchange reserves are tempering this optimism.
Has Ethereum Formed A Local Bottom?
Ethereum has dropped nearly 20% over the past two weeks, falling from approximately $2,805 on February 23 to just above $2,200 at the time of writing. This decline has wiped out $80 billion from ETH’s market cap.
Related Reading
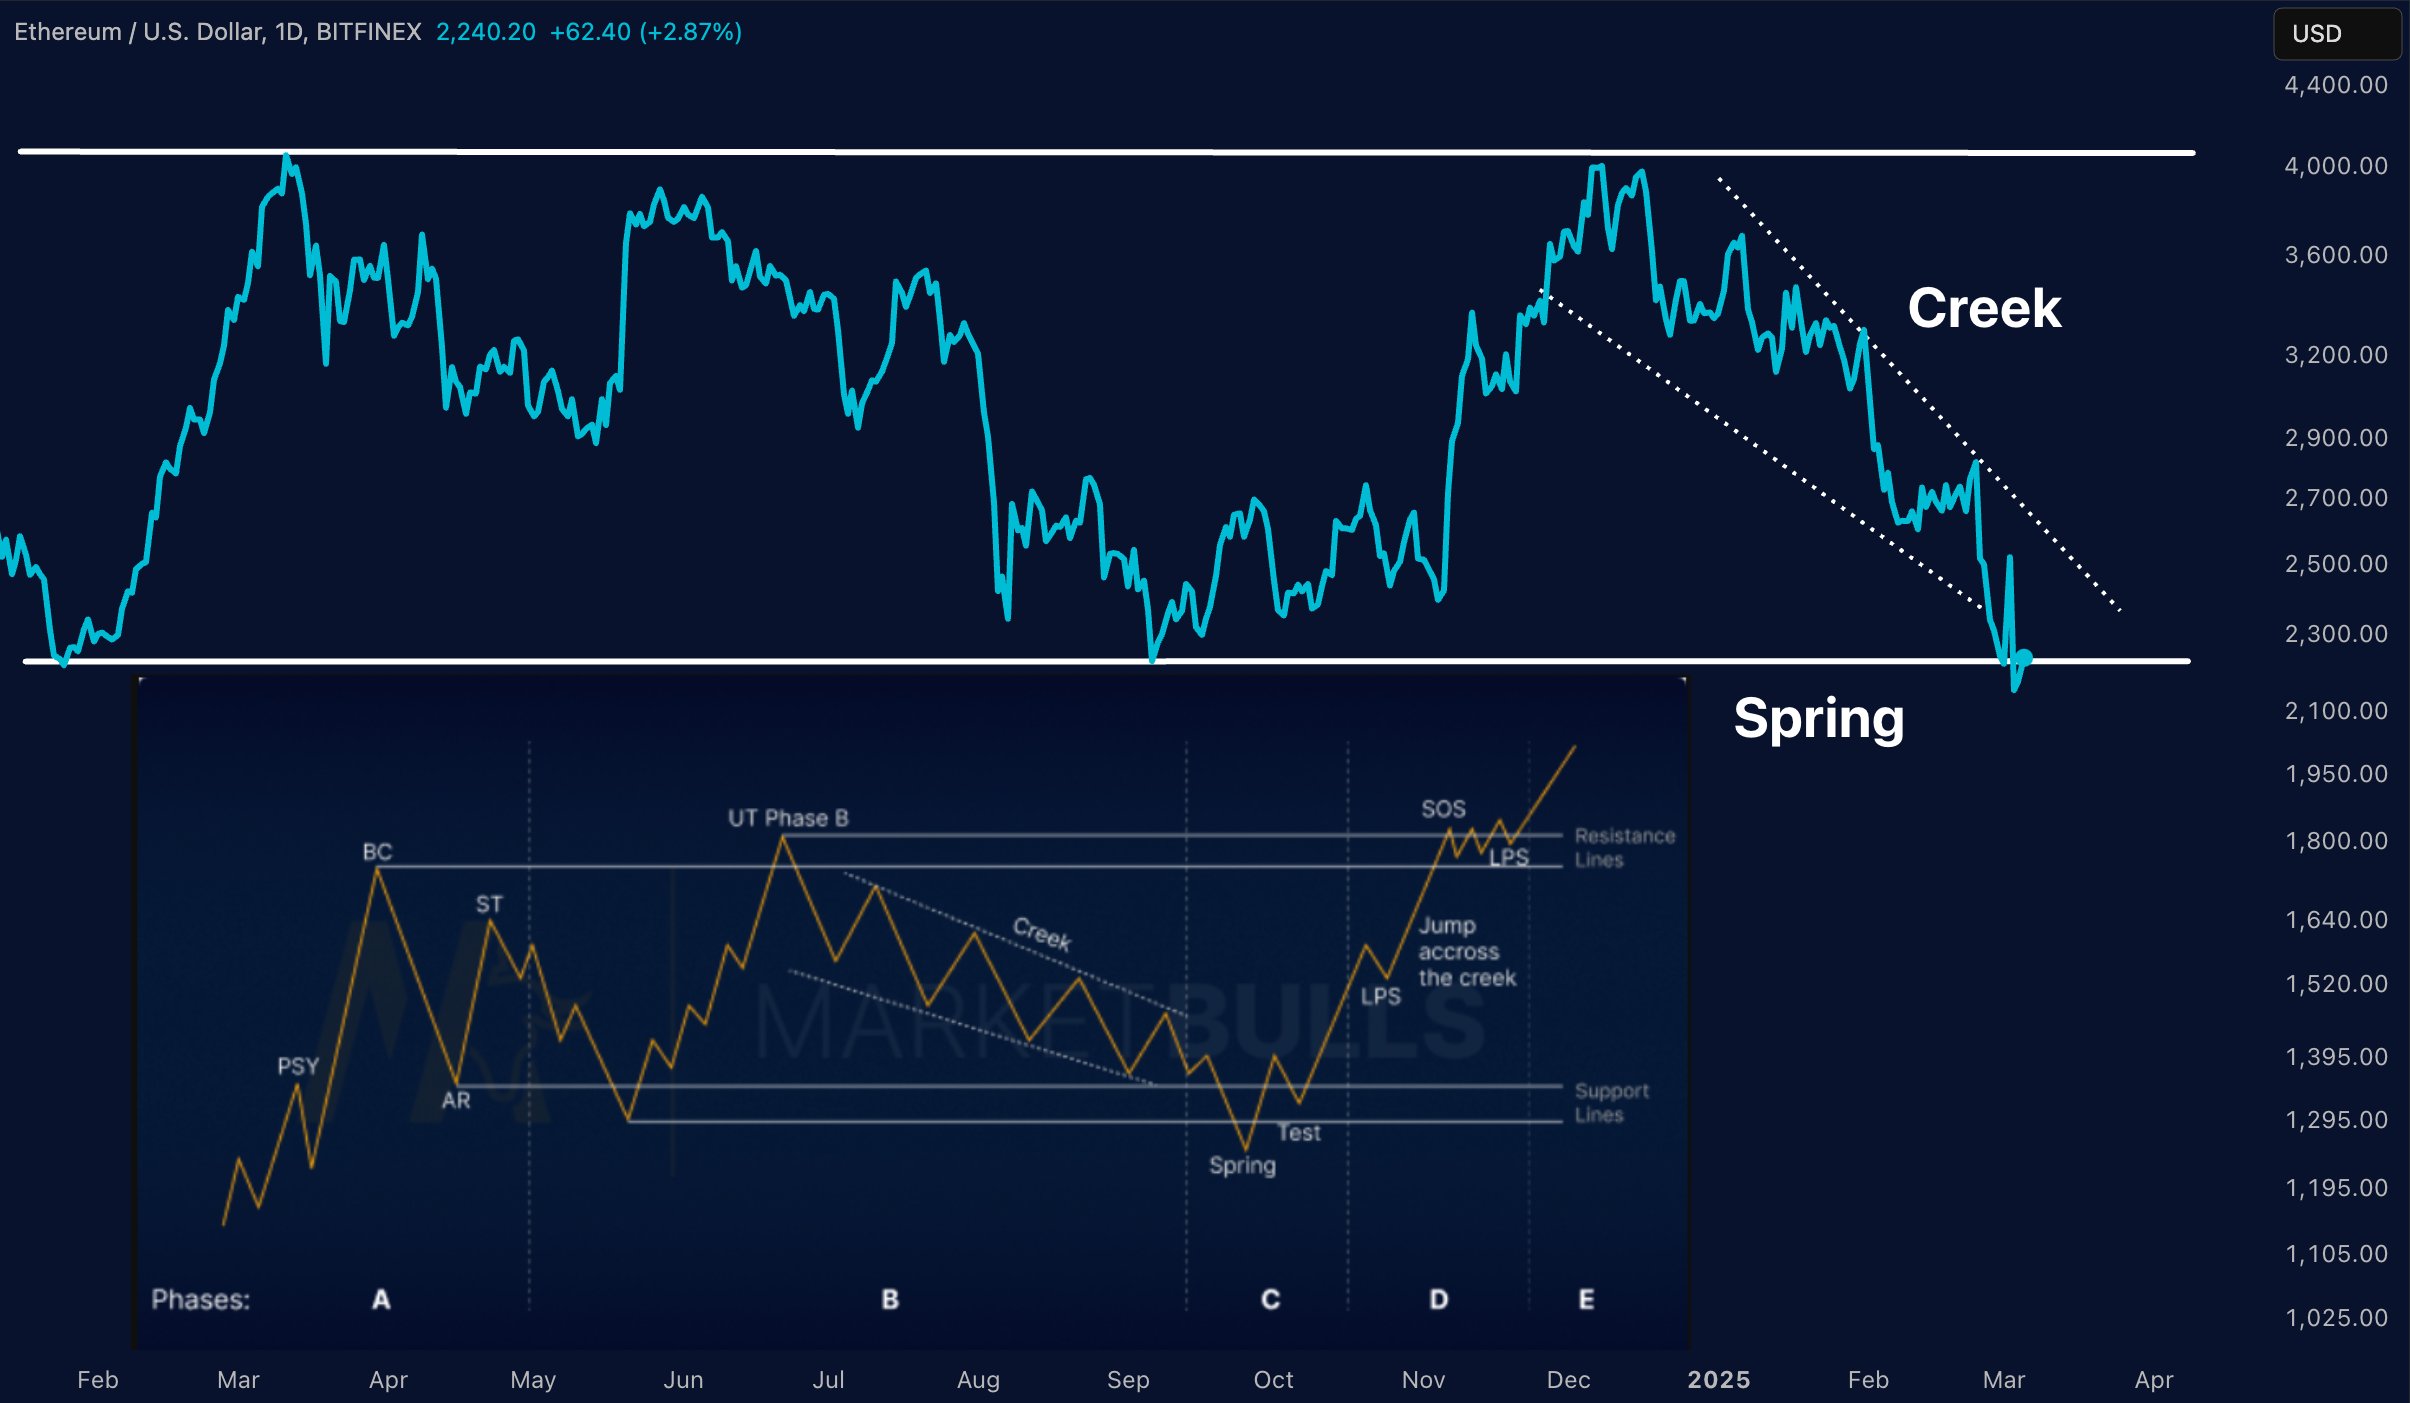
Despite this sharp pullback, crypto analysts are pointing to several bullish indicators that could signal an impending price reversal. Crypto analyst Merlijn The Trader, for instance, has highlighted that ETH is following the Wyckoff Reaccumulation Pattern.
For those unfamiliar, the Wyckoff Reaccumulation Pattern is a technical analysis method developed by Richard Wyckoff. In the context of ETH’s current price action, this pattern suggests that the asset may be entering an accumulation phase before a potential upward movement.
The analyst further noted that the “spring phase” has just been triggered – indicating a possible bear trap where a brief dip below support levels misleads sellers, potentially setting the stage for a rally. A bounce from this level could see ETH climb to $4,000.
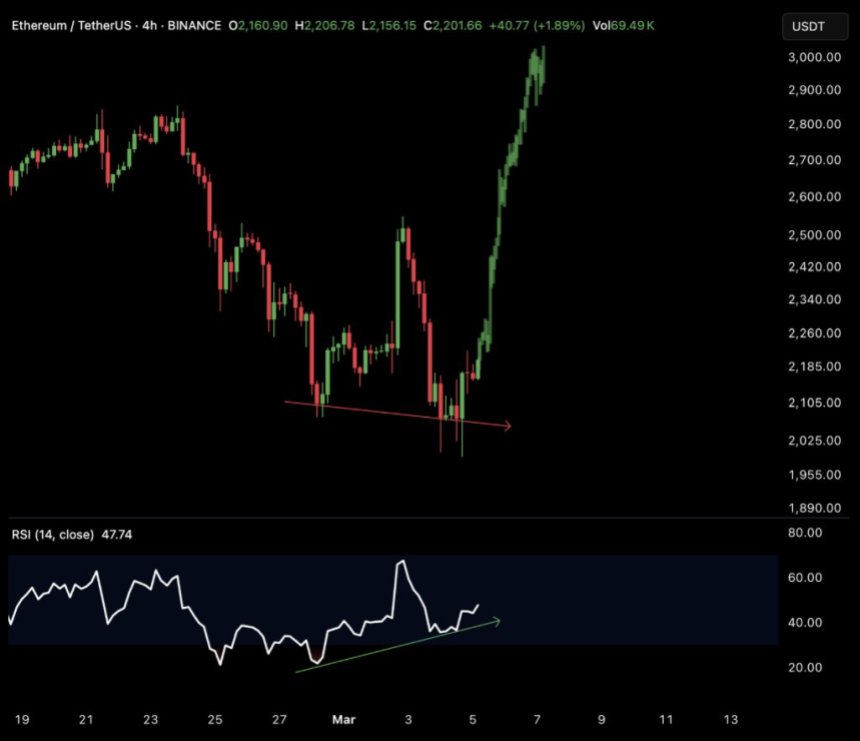
In a separate X post, Merlijn The Trader also pointed to a bullish divergence in Ethereum’s 4-hour chart. According to the analyst, ETH’s next immediate target is $2,700 before moving higher. Fellow crypto analyst CryptoGoos echoed these sentiments.
Beyond technical indicators, whale activity has added to the bullish sentiment surrounding ETH. In an X post, crypto analyst Ted noted:
Ethereum whale bought 17,855 ETH worth $36,000,000 at an average price of $2,054. Total holding $2,530,000,000 Ethereum. You think this is going down? Think again.
Rising Exchange Reserves May Spoil The Party
On the bearish side, crypto analyst Ali Martinez pointed out that ETH reserves on exchanges have been steadily rising. Over the past two weeks, more than 610,000 ETH has been transferred to exchanges, which could increase selling pressure.
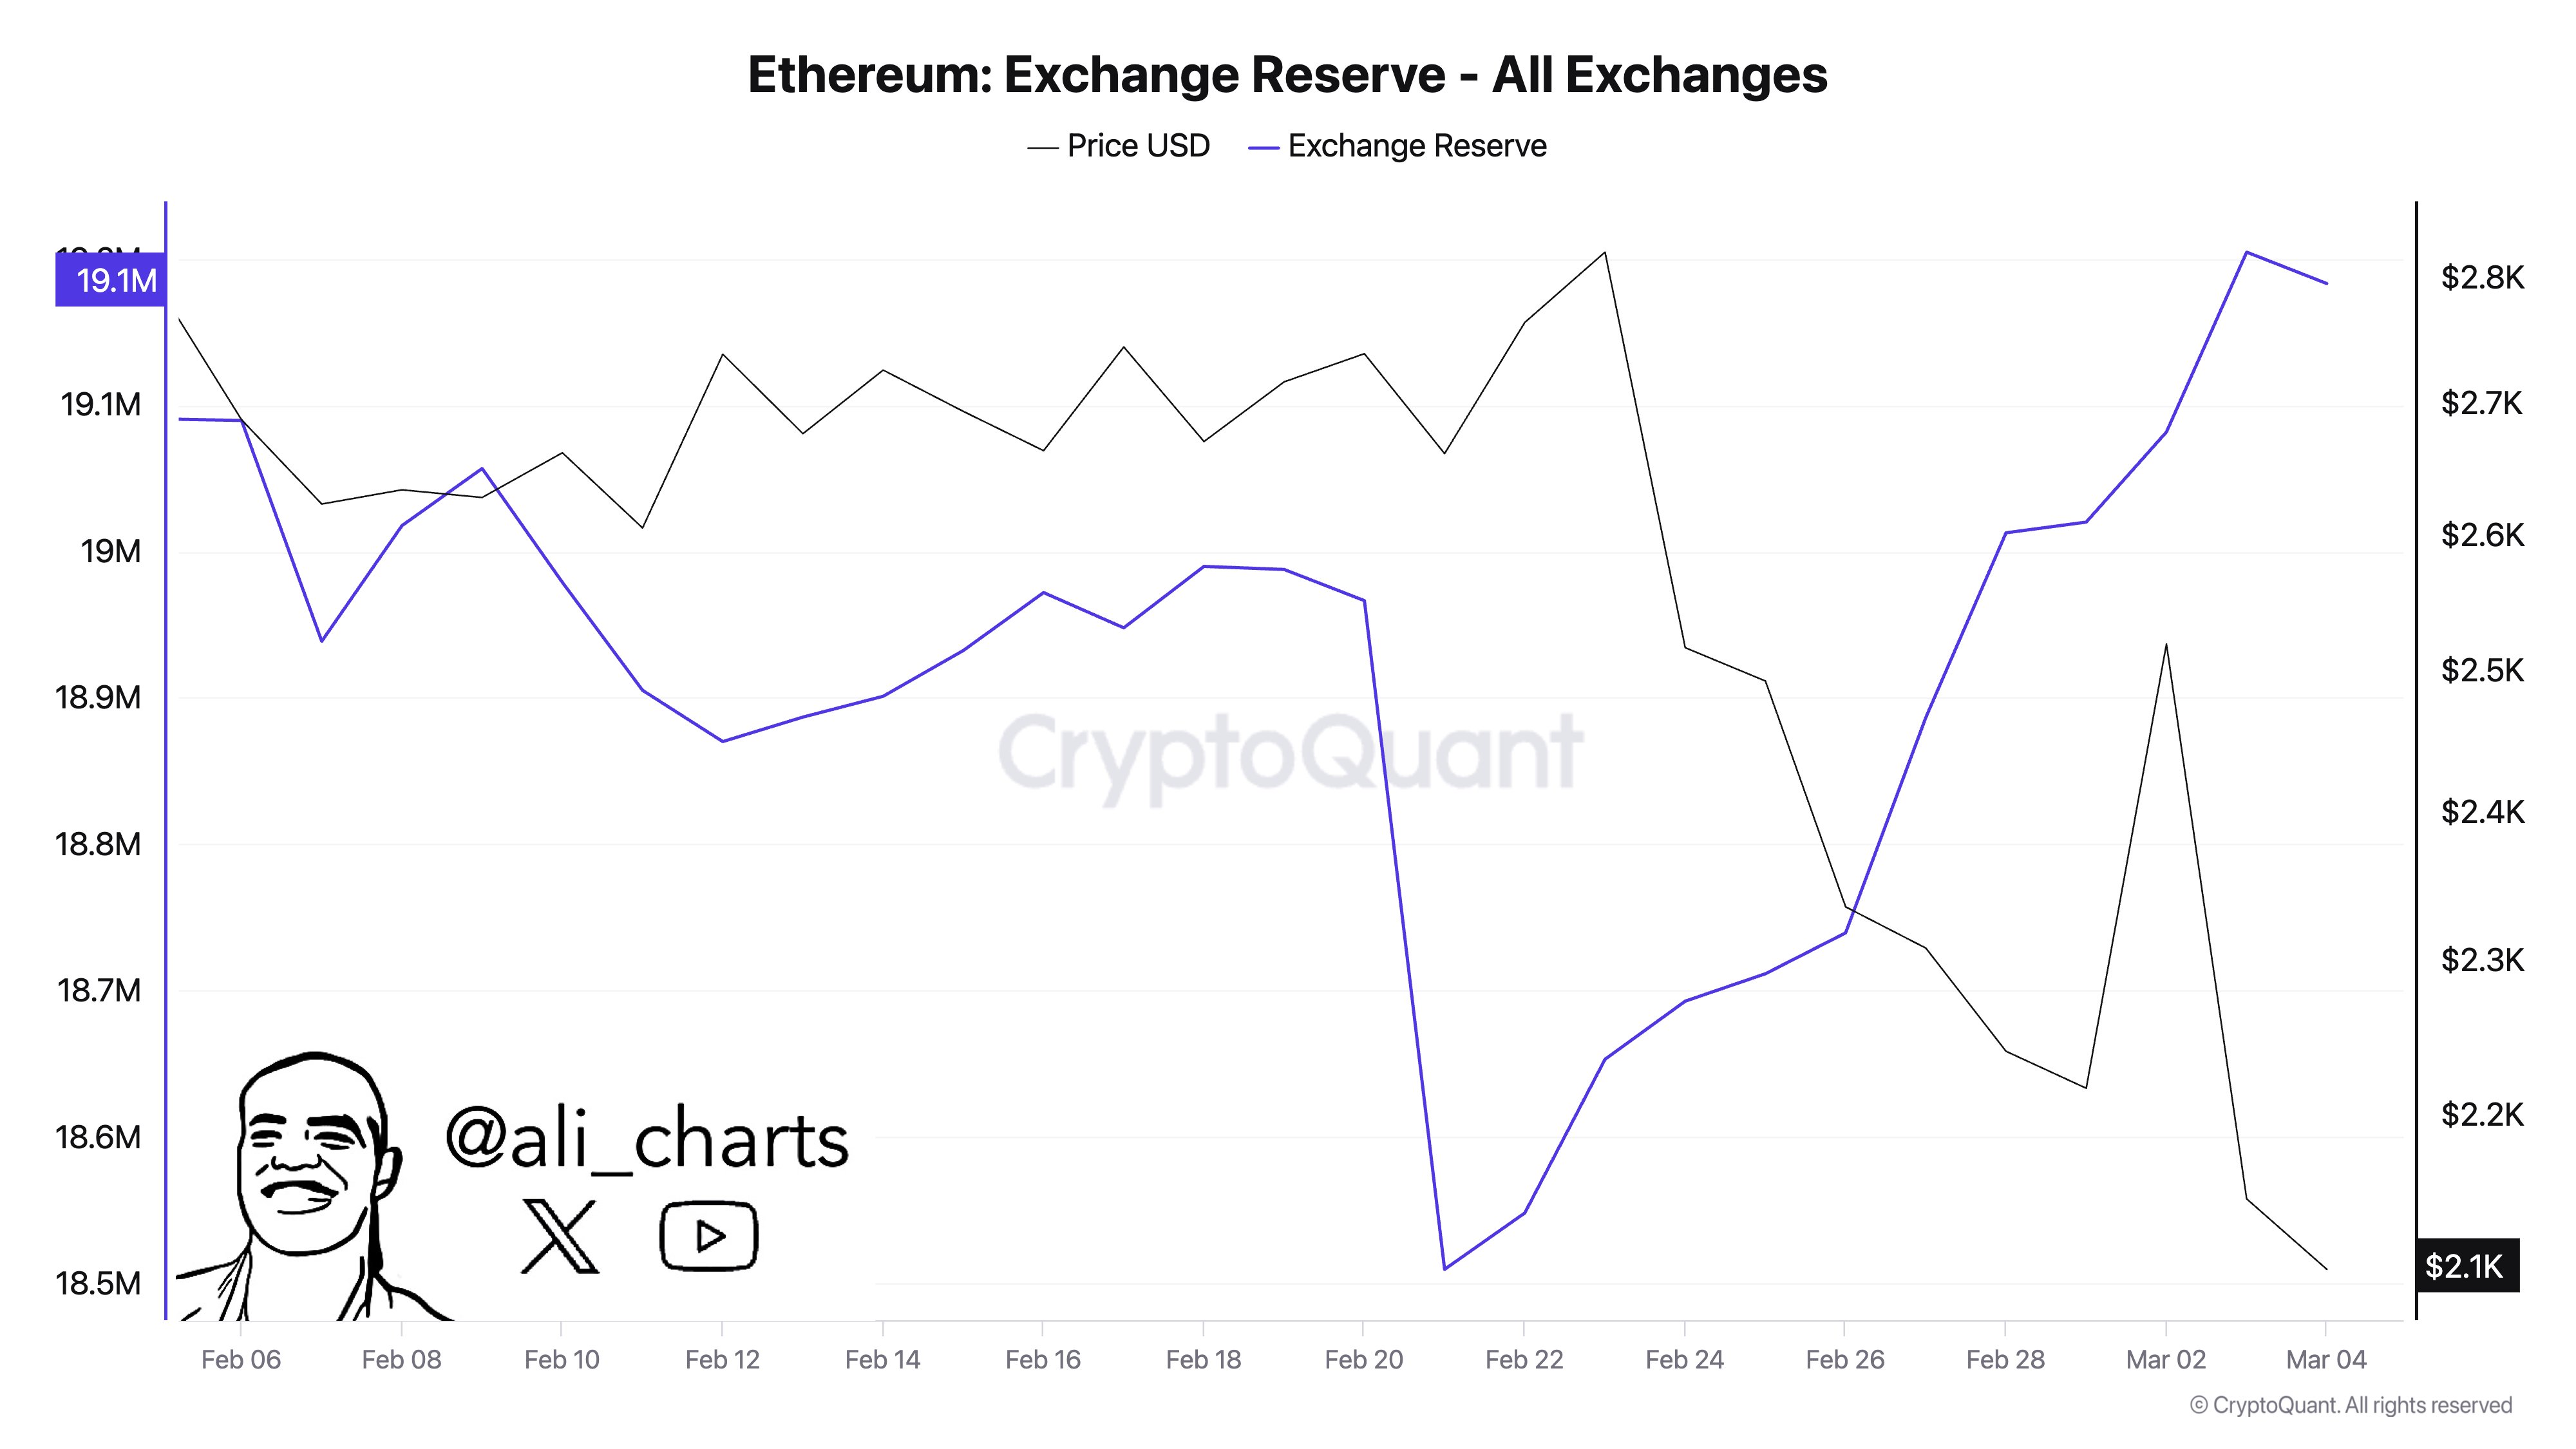
Martinez’s analysis aligns with a recent report that found that despite ETH’s Relative Strength Index (RSI) being at a multi-year low, there could still be further downside in store for the digital currency.
Related Reading
Indeed, ETH has been marred by significant bearish sentiment due to its relatively weak price performance over the past two years compared to cryptocurrencies like Bitcoin (BTC), Solana (SOL), and XRP.
However, extreme bearish sentiment could act as a contrarian signal, setting the stage for a surprise rally. At press time, ETH trades at $2,200, up 6% in the past 24 hours.
Featured image from Unsplash, charts from X and Tradingview.com
Ethereum’s price has mirrored Bitcoin’s recent market movements. ETH experienced a rollercoaster performance earlier this week before rebounding with a 10% increase in the past 24 hours. This recovery follows a broader market correction that initially led to fear among investors.
While Ethereum’s performance remains closely linked to Bitcoin’s price action, recent on-chain data suggests that ETH may enter a renewed accumulation phase.
MVRV Ratio and Institutional Accumulation Trends
A post uploaded on the CryptoQuant QuickTake platform by a contributor known as Mac has particularly pointed out Ethereum’s Market Value to Realized Value (MVRV) ratio, which suggests the asset is currently undervalued.
The latest data indicates that large-scale investors are increasing their ETH holdings, signaling potential support at key price levels. According to Mac, these accumulation patterns could influence Ethereum’s trajectory in the coming weeks.

Mac revealed that the MVRV ratio, a key on-chain metric used to assess whether an asset is overvalued or undervalued, has fallen below 1 for Ethereum. Historically, such levels indicate an undervalued zone, meaning that Ethereum is trading close to the average purchase price of all holders, including institutional investors.
ETH MVRV: Reaching a Highly Undervalued Zone
“When MVRV falls below 1, it signals entry into an undervalued zone in the cycle, indicating an opportunity to buy at a level close to the average purchase price of all holders (including whale investors).” – By @MAC_D46035 pic.twitter.com/urj348TZng
— CryptoQuant.com (@cryptoquant_com) March 5, 2025
The analyst also mentioned that in past market cycles, when Ethereum’s MVRV dropped below 1, it was followed by notable price recoveries. Additionally, there has been a surge in the number of ETH accumulation addresses—wallets that receive ETH but have never withdrawn.
This suggests that large investors and institutions are strategically increasing their holdings, particularly at the current price range of $2,200–$2,300, where the realized price for whale investors is concentrated. This level is expected to act as a strong support zone, reinforcing the possibility of sustained accumulation.
Market Conditions and Long-Term Ethereum Outlook
Beyond accumulation trends, macroeconomic factors continue to play a role in shaping Ethereum’s price movements. Mac noted that liquidity policies in the US, particularly the Trump administration’s trade and monetary policies, have so far influenced risk asset performance, including cryptocurrencies.
Stricter monetary policies and inflation concerns could contribute to “sharp price drops.” Despite this possibility, Mac concluded, noting:
However, Ethereum still maintains its position as the second-largest cryptocurrency by market cap and is a proven network with thousands of mature DeFi projects. As such, institutional investors are likely to accumulate more in this undervalued zone. Therefore, from a long-term perspective, the outlook for Ethereum remains positive.
Featured image created with DALL-E, Chart from TradingView

Ethereum’s price may have been facing significant downside pressure due to an overall market downswing, which is believed to be caused by recent negative macroeconomic conditions. However, a seasoned crypto expert predicts a transition in price behavior from bearish to bullish for ETH as the asset could be experiencing a rebound in the short term.
A Notable Price Reversal Brewing For Ethereum
Ethereum price action is eyeing a potential bullish reversal from its current downward trend. Technical expert and investor Jonathan Carter points to a bullish formation that could spark a notable upsurge to key resistance levels.
Looking at the chart in the 1-day time frame, Ethereum has formed a massive Descending Channel pattern as bearish movements extend. A Descending Channel formation is considered a bullish technical pattern formed by connecting the lower highs and lower lows with parallel trendlines.
Once the price breaks above the upper trendline, it usually indicates that a rally could be on the horizon. As Ethereum hovers around the key technical pattern, the altcoin has formed a key support at the $2,060 level.
Jonathan Carter highlights short-term and long-term opportunities near this support level with targets at $2,360 and $2,560. In the event that Ethereum rebounds and breaks out of the descending channel, the expert foresees a move to the $3,450 mark, where the asset may witness increased buying pressure.

ETH’s breakout signals the beginning of a strong upward trend and the potential end of the ongoing correction. Should the rally continue, the next key resistance barrier to challenge is at $4,050, where the current downward trend initially began.
Analyzing the 1-week time frame, the much-anticipated reversal is capable of reaching new all-time highs in the upcoming weeks. Carter has identified a huge Ascending Triangle pattern on the weekly chart, signaling growing momentum toward the upside.
The chart shows that Ethereum is attempting to bounce from the ascending triangle support, which will propel its price into uncharted territory. Furthermore, the altcoin’s price has managed to stay above the 100-day Moving Average (MA) and the multi-year trendline. When the breakout occurs, Carter expects bullish momentum to drive prices to targets at $3,200, $4,000, $4,850, $6,000, and $7,500.
Has ETH’s Price Bottomed Out?
Recent downward trend has caused ETH to revisit a crucial level that previously led to a substantial upswing. Market expert and trader Titan of Crypto spotted the development, which indicates an impending price resurgence.
Specifically, Titan of Crypto noted that Ethereum has fallen to the 2024 low on the perpetual 1-day chart. Considering the 2024 price trend, the altcoin may have bottomed out and is gearing up for a rebound at the most significant point of interest.
Featured image from Unsplash, chart from Tradingview.com

Fake National Hong Kong Coin Launch on Solana Exposed

BNB Price Starts Fresh Increase—Can Bulls Sustain the Momentum?

Bitcoin Price Could Soar as Global M2 Money Supply Expands

Analyst Predicts TRX Price To Hit $1 As TRON Network Activity Heats Up

Bitcoin Pepe’s presale nears $4m as BTC’s price hits $92k

Ethereum Flashing Bullish Signals, But Rising Exchange Reserves Raise Concerns

2.52 Million Altcoins Are Ruining Crypto’s Future

Animoca Brands Valuation Tanks 75% In Two Years, Here’s Why

Crypto exchange BingX hacked for $43 million

Are The Big Players Losing Interest?

Hong Kong’s Securities Association Tips Authorities On Crypto Self-Regulation

Coinbase cbBTC Set to go Live on Solana
2.52 Million Altcoins Are Ruining Crypto’s Future
Animoca Brands Valuation Tanks 75% In Two Years, Here’s Why
Crypto exchange BingX hacked for $43 million
Are The Big Players Losing Interest?
Hong Kong’s Securities Association Tips Authorities On Crypto Self-Regulation
Coinbase cbBTC Set to go Live on Solana
-
 Altcoin22 hours ago
Binance Extends RedStone Backing; RED Price To Hit New ATH?
-
 Market21 hours ago
Insights from Outlier Ventures CEO
-
 Altcoin21 hours ago
Lawyer Reveals If Ripple Vs SEC Resolution Possible In March
-

 Altcoin20 hours ago
Bitcoin Tests $90K on Speculation of Trump’s Crypto Reserve Plan
-

 Regulation23 hours ago
Matrixport subsidiary Fly Wing receives Major Payment Institution License from MAS in Singapore
-

 Market20 hours ago
XCN Price in Freefall – Will It Recover?
-
 Altcoin15 hours ago
Ripple Whales Move Over $5 Bln Coins, What’s Happening?
-

 Market18 hours ago
XRP Price Set To Benefit From Whales’ $3.2 Billion Accumulation