
Market
BNB Remains Resilient Amid Market Crash as Ecosystem Grows
BNB is down 8% in the last 30 days, but its correction remains notably less severe than those of BTC, ETH, XRP, and SOL. The overall crypto market slumped nearly 10% today, while BNB remains resilient.
Despite the bearish trend, BNB’s ecosystem remains strong. PancakeSwap, its largest DEX, generated more fees in the last seven days than Uniswap and Hyperliquid. In the coming weeks, BNB could break above $586 and target levels near $635 or even $680.
BNB DMI Shows Sellers Are Back In Control
BNB’s Directional Movement Index (DMI) shows that its Average Directional Index (ADX) is currently at 28.5, rising from 22.8 yesterday, signaling that the current trend is strengthening.
ADX measures trend strength but not direction, meaning that whether bullish or bearish, a rising ADX suggests an increase in momentum.
In this case, it remains in a downtrend, and the strengthening ADX indicates that the bearish pressure is becoming more dominant. Unless buying activity picks up, the downward movement could accelerate.
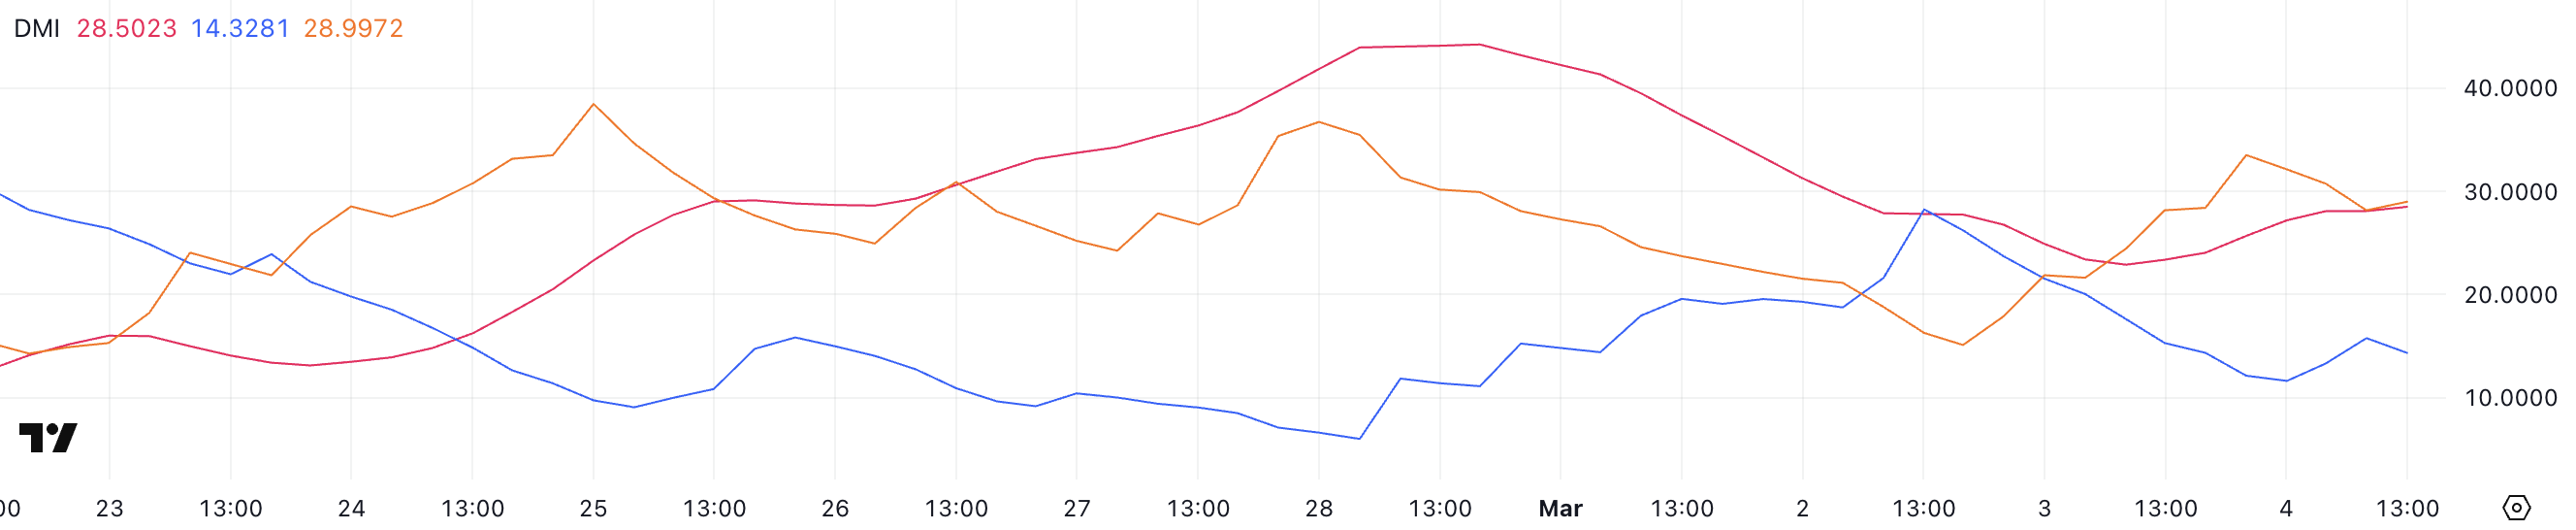
The +DI (Positive Directional Indicator) has dropped to 14.3, down from 28.2 two days ago, signaling that bullish momentum has weakened significantly.
Meanwhile, -DI (Negative Directional Indicator) has surged to 28.99, up from 15 two days ago, confirming that selling pressure is increasing.
With -DI now well above +DI, bears are fully in control, and BNB’s price is likely to remain under pressure. If this trend continues, BNB could face further declines unless bulls step in to reverse the momentum.
Ichimoku Cloud Shows a Bearish Setup For BNB
The Ichimoku Cloud for BNB shows that the price is currently trading well below the cloud, confirming a bearish trend. The sharp decline began after it was rejected from the Tenkan-sen (blue line), which is now sloping downward, reinforcing short-term weakness.
Additionally, the Kijun-sen (red line) remains above the price, signaling that momentum favors the bears. Unless BNB reclaims these key levels, the downtrend could continue in the coming sessions.
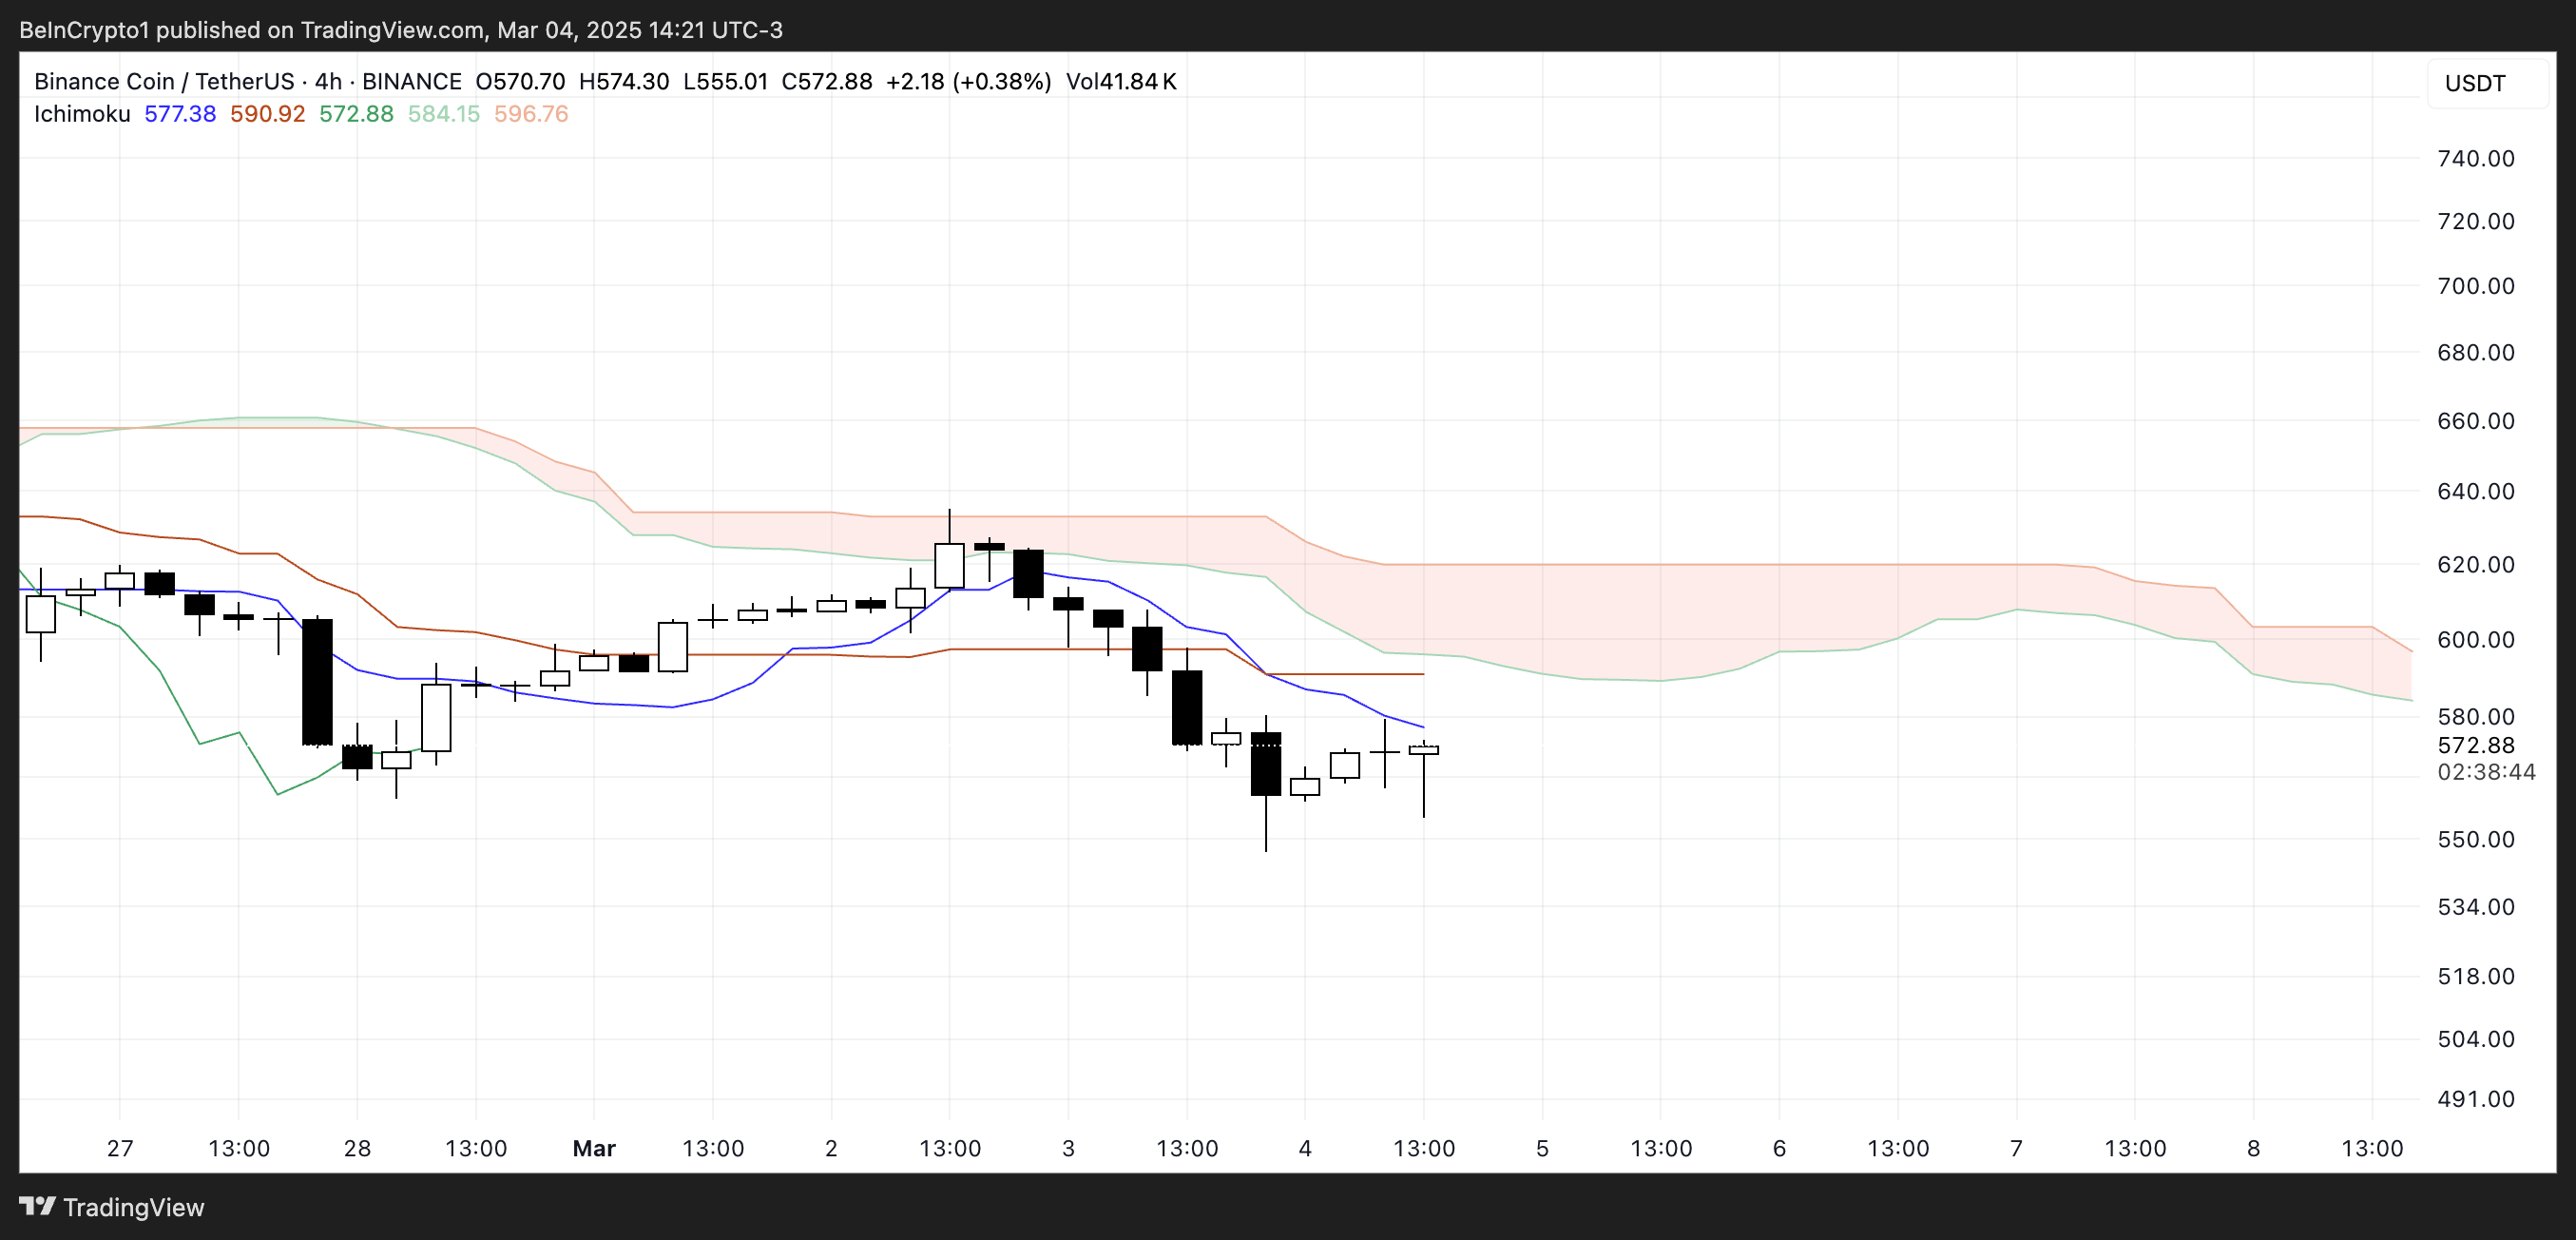
The future cloud remains red, suggesting that bearish conditions may persist. When the price is below the cloud, it indicates a clear downtrend, and a break above it would be necessary to shift momentum bullish again.
For now, BNB faces resistance at the Tenkan-sen and Kijun-sen, and failure to reclaim these levels could lead to further downside. If BNB remains below the cloud, the selling pressure may continue, making it difficult for bulls to regain control.
BNB Is Currently Trading Between Two Important Key Levels
BNB price is currently trading between support at $559 and resistance at $586, with price action consolidating in this range. If the $559 support is tested and lost, BNB could decline further toward $500, a key level.
A break below $500 would be significant, as it would mark the first time it trades below this level since September 2024.
With momentum indicators still favoring the bears, further downside remains a possibility if buying pressure does not increase.
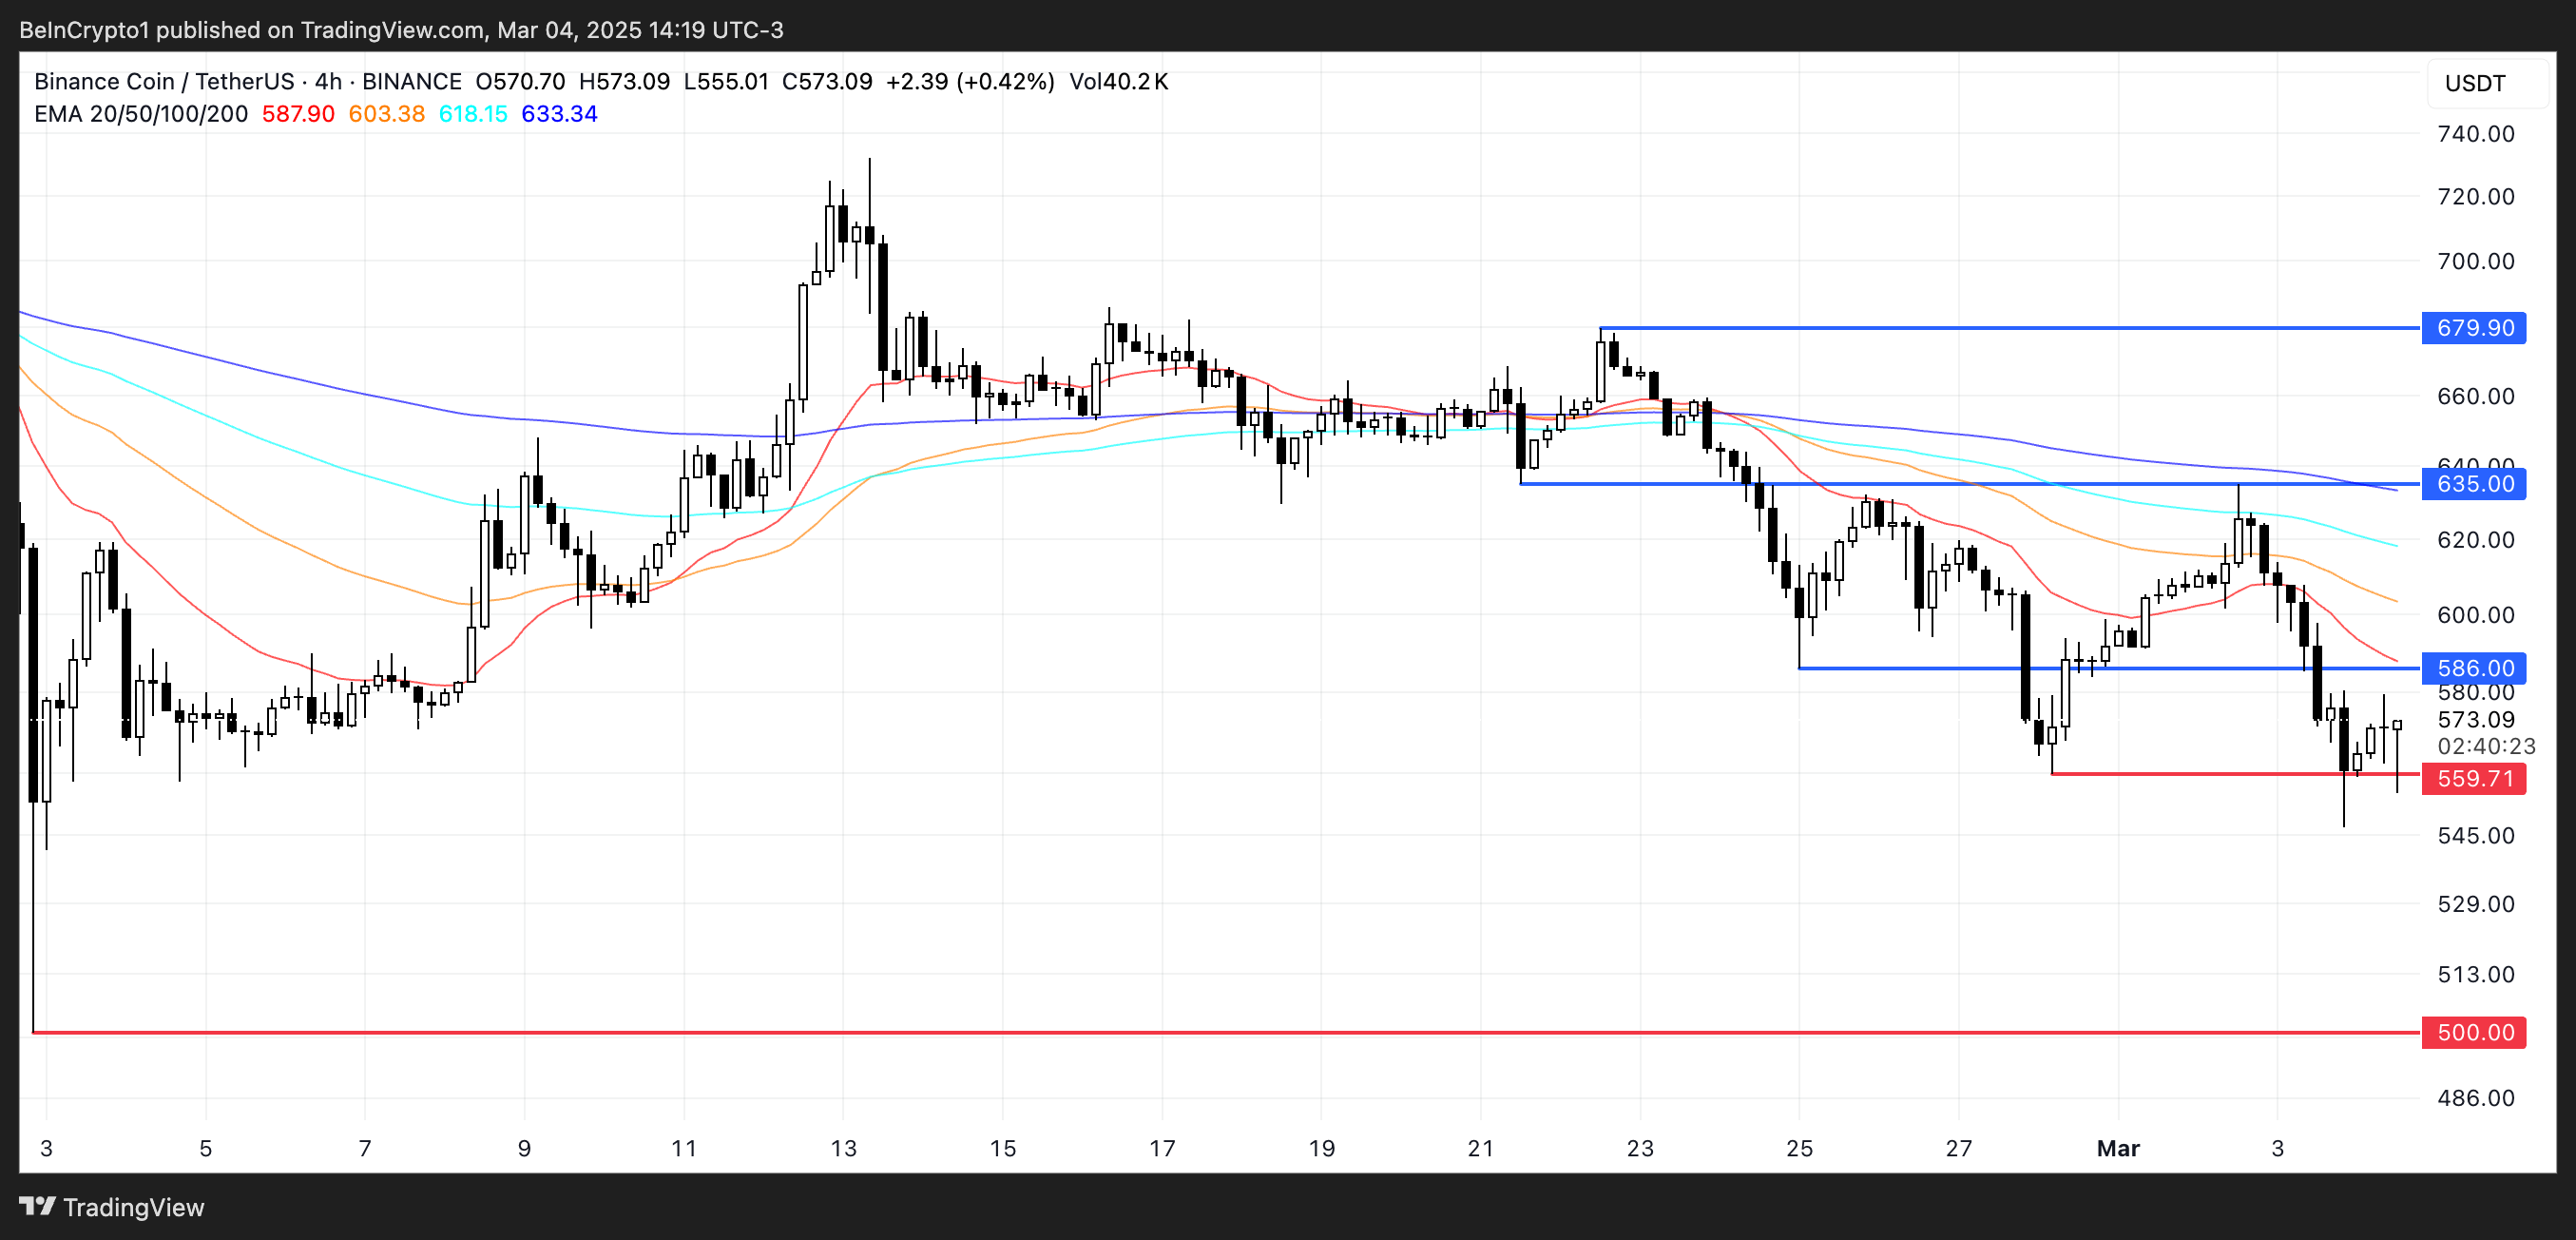
On the other hand, if it can break above $586, it could gain momentum toward the $635 resistance.
A successful move past this level would signal a stronger uptrend, potentially pushing BNB toward $680.
For this scenario to unfold, bulls need to reclaim key resistance levels and reverse the current bearish sentiment. A sustained breakout above $635 would be the first sign of a trend shift.
Disclaimer
In line with the Trust Project guidelines, this price analysis article is for informational purposes only and should not be considered financial or investment advice. BeInCrypto is committed to accurate, unbiased reporting, but market conditions are subject to change without notice. Always conduct your own research and consult with a professional before making any financial decisions. Please note that our Terms and Conditions, Privacy Policy, and Disclaimers have been updated.


Ethereum price started a recovery wave from the $2,000 support zone. ETH is now rising and might aim for a move above the $2,350 resistance zone.
- Ethereum started a fresh upward move above the $2,220 support zone.
- The price is trading above $2,220 and the 100-hourly Simple Moving Average.
- There is a key rising channel forming with support at $2,200 on the hourly chart of ETH/USD (data feed via Kraken).
- The pair must clear the $2,275 and $2,350 resistance levels to start a decent increase.
Ethereum Price Eyes A Comeback
Ethereum price started a fresh decline below the $2,350 zone, like Bitcoin. ETH gained bearish momentum below the $2,220 and $2,250 support levels.
A low was formed at $2,003 and the price is now attempting a recovery wave. There was a move above the $2,150 and $2,200 resistance levels. It even tested the 50% Fib retracement level of the downward move from the $2,550 swing high to the $2,003 low.
Ethereum price is now trading above $2,200 and the 100-hourly Simple Moving Average. There is also a key rising channel forming with support at $2,200 on the hourly chart of ETH/USD. On the upside, the price seems to be facing hurdles near the $2,275 level.
The first major resistance is near the $2,340 level and the 61.8% Fib retracement level of the downward move from the $2,550 swing high to the $2,003 low. A clear move above the $2,340 resistance might send the price toward the $2,420 resistance.

An upside break above the $2,420 resistance might call for more gains in the coming sessions. In the stated case, Ether could rise toward the $2,500 resistance zone or even $2,550 in the near term.
Another Drop In ETH?
If Ethereum fails to clear the $2,275 resistance, it could start another decline. Initial support on the downside is near the $2,240 level. The first major support sits near the $2,220 zone.
A clear move below the $2,130 support might push the price toward the $2,080 support. Any more losses might send the price toward the $2,050 support level in the near term. The next key support sits at $2,000.
Technical Indicators
Hourly MACD – The MACD for ETH/USD is gaining momentum in the bullish zone.
Hourly RSI – The RSI for ETH/USD is now above the 50 zone.
Major Support Level – $2,220
Major Resistance Level – $2,275

Hedera (HBAR) has surged more than 6% in the last 24 hours, bringing its market cap to $10.6 billion. With its price up nearly 30% over the past week, HBAR stands out as one of the top-performing altcoins among the largest in the market.
This strong rally has pushed key technical indicators into bullish territory, with BBTrend reaching its highest level in over a month and the Ichimoku Cloud structure showing sustained upward momentum. If HBAR maintains this strength, it could soon test critical resistance levels, with the potential to surpass $0.35 in March.
Hedera BBTrend Is On Its Highest Levels In More Than a Month
Hedera BBTrend is currently at 18.15, maintaining a positive stance for over a day. Earlier today, it reached a peak of 21.3, marking its highest level since late January.
While it has pulled back slightly from that peak, the indicator remains elevated, suggesting that the recent uptrend is still intact.
This sustained positivity in BBTrend indicates strong directional momentum in HBAR’s price action, aligning with broader market trends.
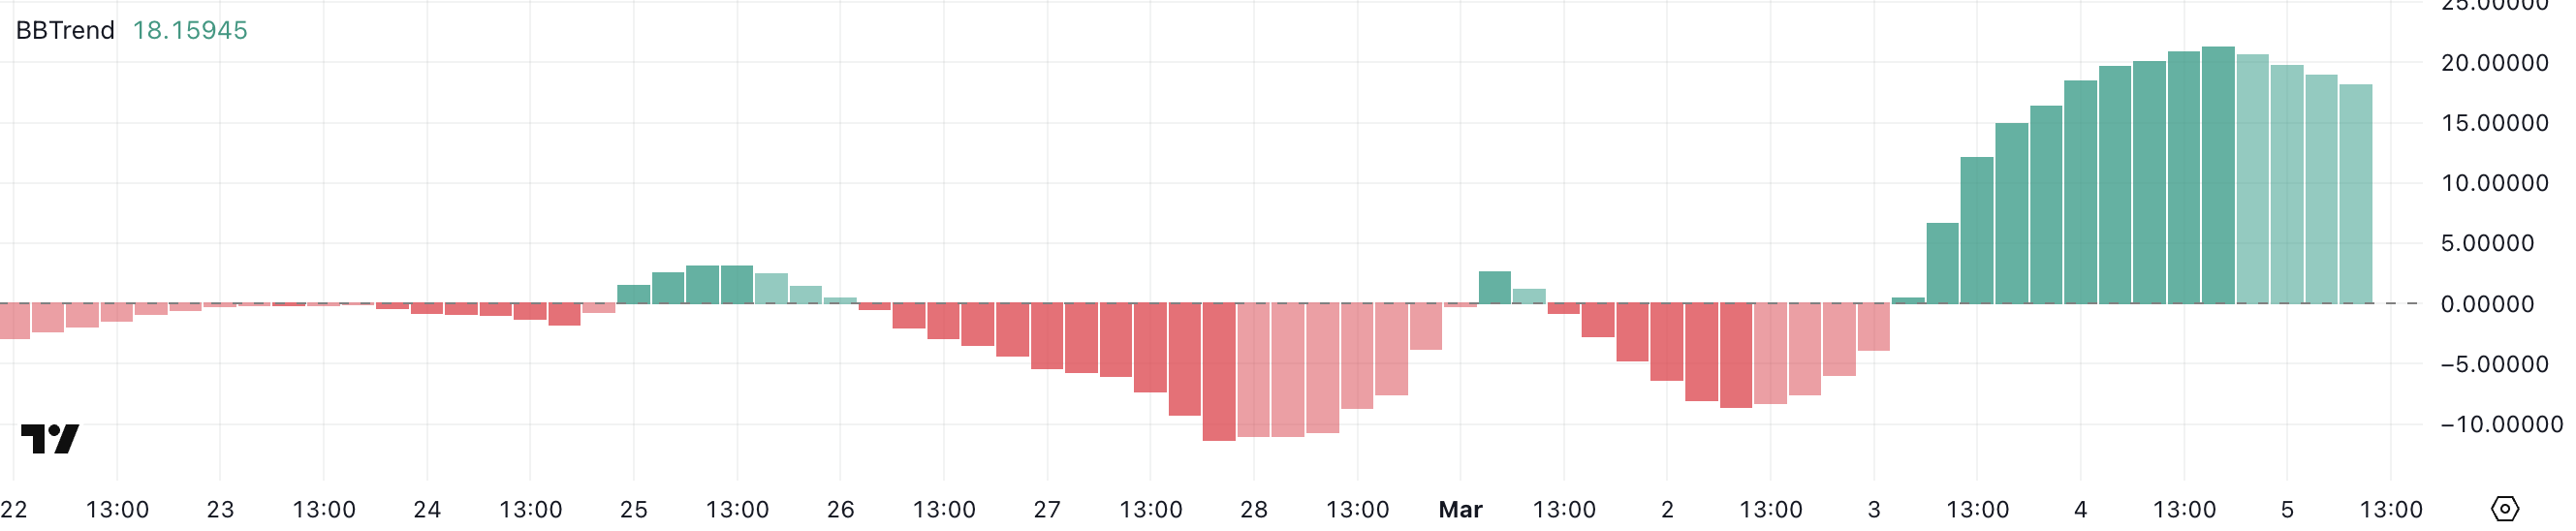
BBTrend, or Bollinger Band Trend, is a technical indicator that measures trend strength based on the relationship between price and Bollinger Bands. When BBTrend is positive, it suggests that the price is trading in the upper portion of the Bollinger Bands, often signaling an ongoing bullish trend.
In HBAR’s case, the current level of 18.15 – while lower than its earlier peak of 21.3 – still reflects a strong upward bias. If this trend remains elevated, it could indicate continued bullish momentum for HBAR, but the slight pullback from 21.3 suggests some moderation in buying pressure.
Whether this leads to consolidation or further upside will depend on market follow-through and broader sentiment shifts.
HBAR Ichimoku Cloud Shows a Bullish Setup
According to the Ichimoku Cloud, Hedera is currently positioned in a bullish structure. The price is trending above the blue conversion line and the red baseline, indicating short-term bullish momentum.
The green leading span A is sloping upward, while the orange leading span B remains relatively steady, forming an ascending cloud that suggests growing support. Additionally, the lagging span (green line) is above the price from 26 periods ago, reinforcing the strength of the ongoing trend.
However, the price is consolidating just above the red baseline, signaling a potential decision point between continuation or a short-term pullback.
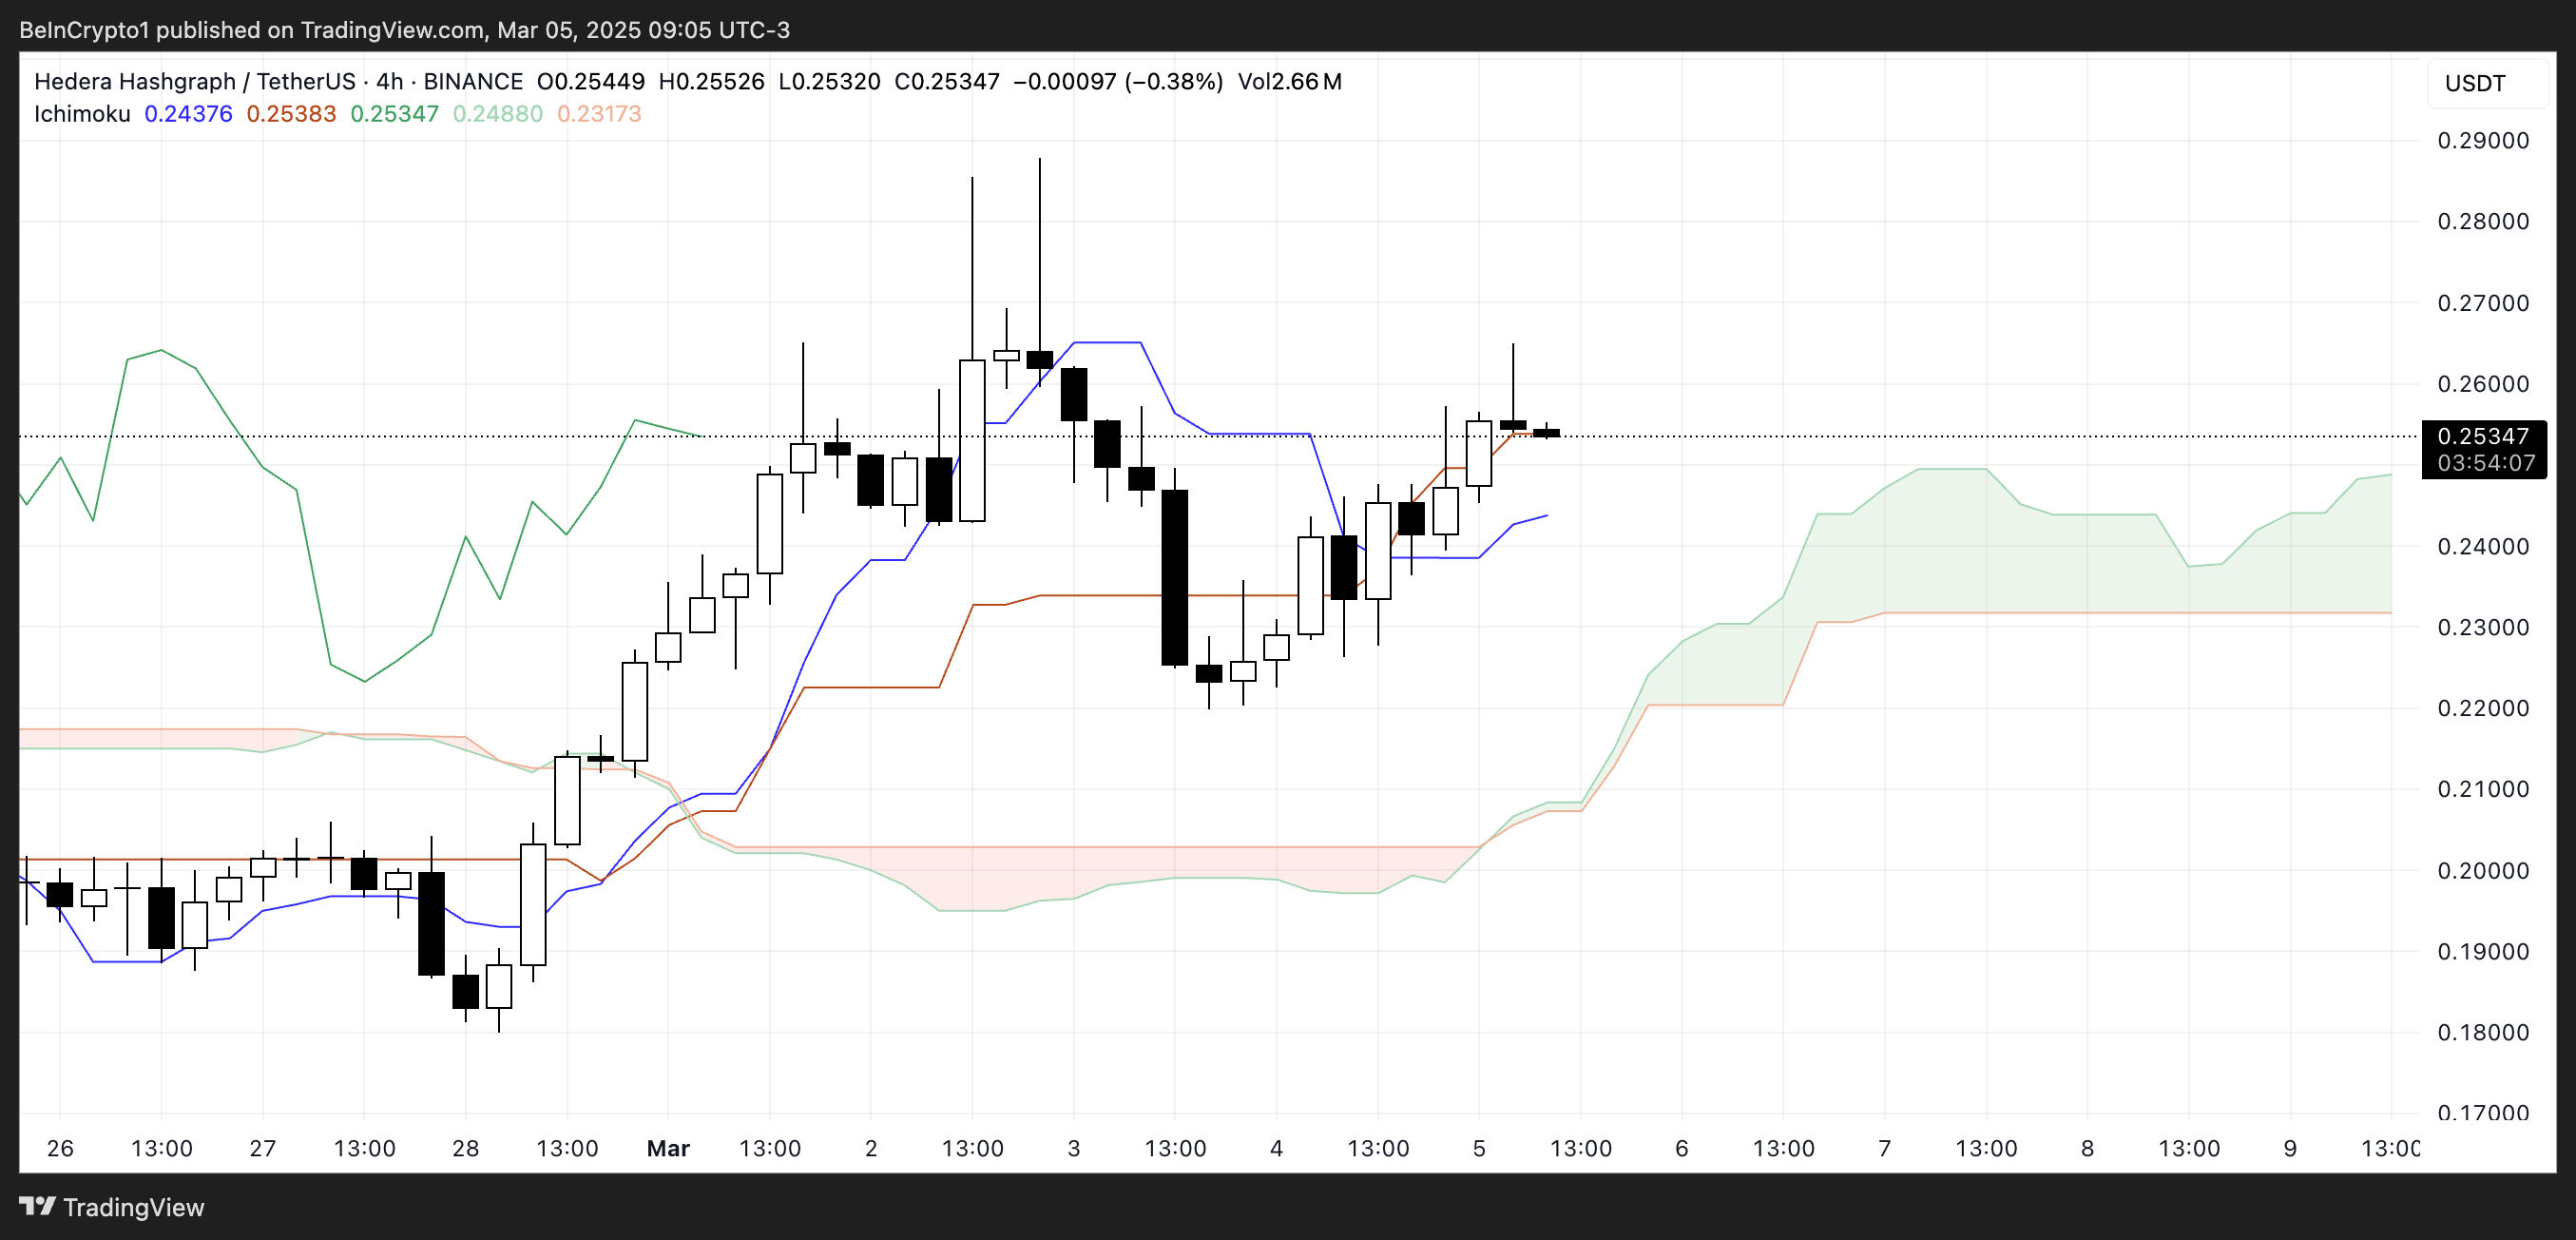
The Ichimoku Cloud provides a multi-faceted view of trend direction and key support-resistance zones. When the price is above the cloud, it signals a dominant bullish trend, while movement below would indicate a shift in sentiment.
The current positioning above both the blue conversion line and red baseline suggests that bullish momentum is intact. If the price maintains this structure, further upside could be expected, especially as the green leading span A continues to rise.
However, a drop below the red baseline would indicate weakening momentum, potentially leading to a test of the cloud’s support region. The thickness of the cloud ahead suggests a moderate support zone, meaning any pullback would face resistance before shifting the overall trend.
Hedera (HBAR) Could Surpass $0.35 In March
Hedera EMA lines indicate a bullish trend, with a golden cross forming yesterday and the possibility of another one soon. A golden cross occurs when a shorter-term EMA crosses above a longer-term EMA, signaling strong upward momentum.
If this setup continues, HBAR could test the next resistance at $0.28. A breakout above this level could open the path for a move toward $0.322.
If buying pressure intensifies and Hedera price regains the strong uptrend seen in previous months, it could push further to test $0.35 and $0.37. In an extended rally, HBAR might even rise above $0.40 for the first time since November 2021, marking a significant recovery.
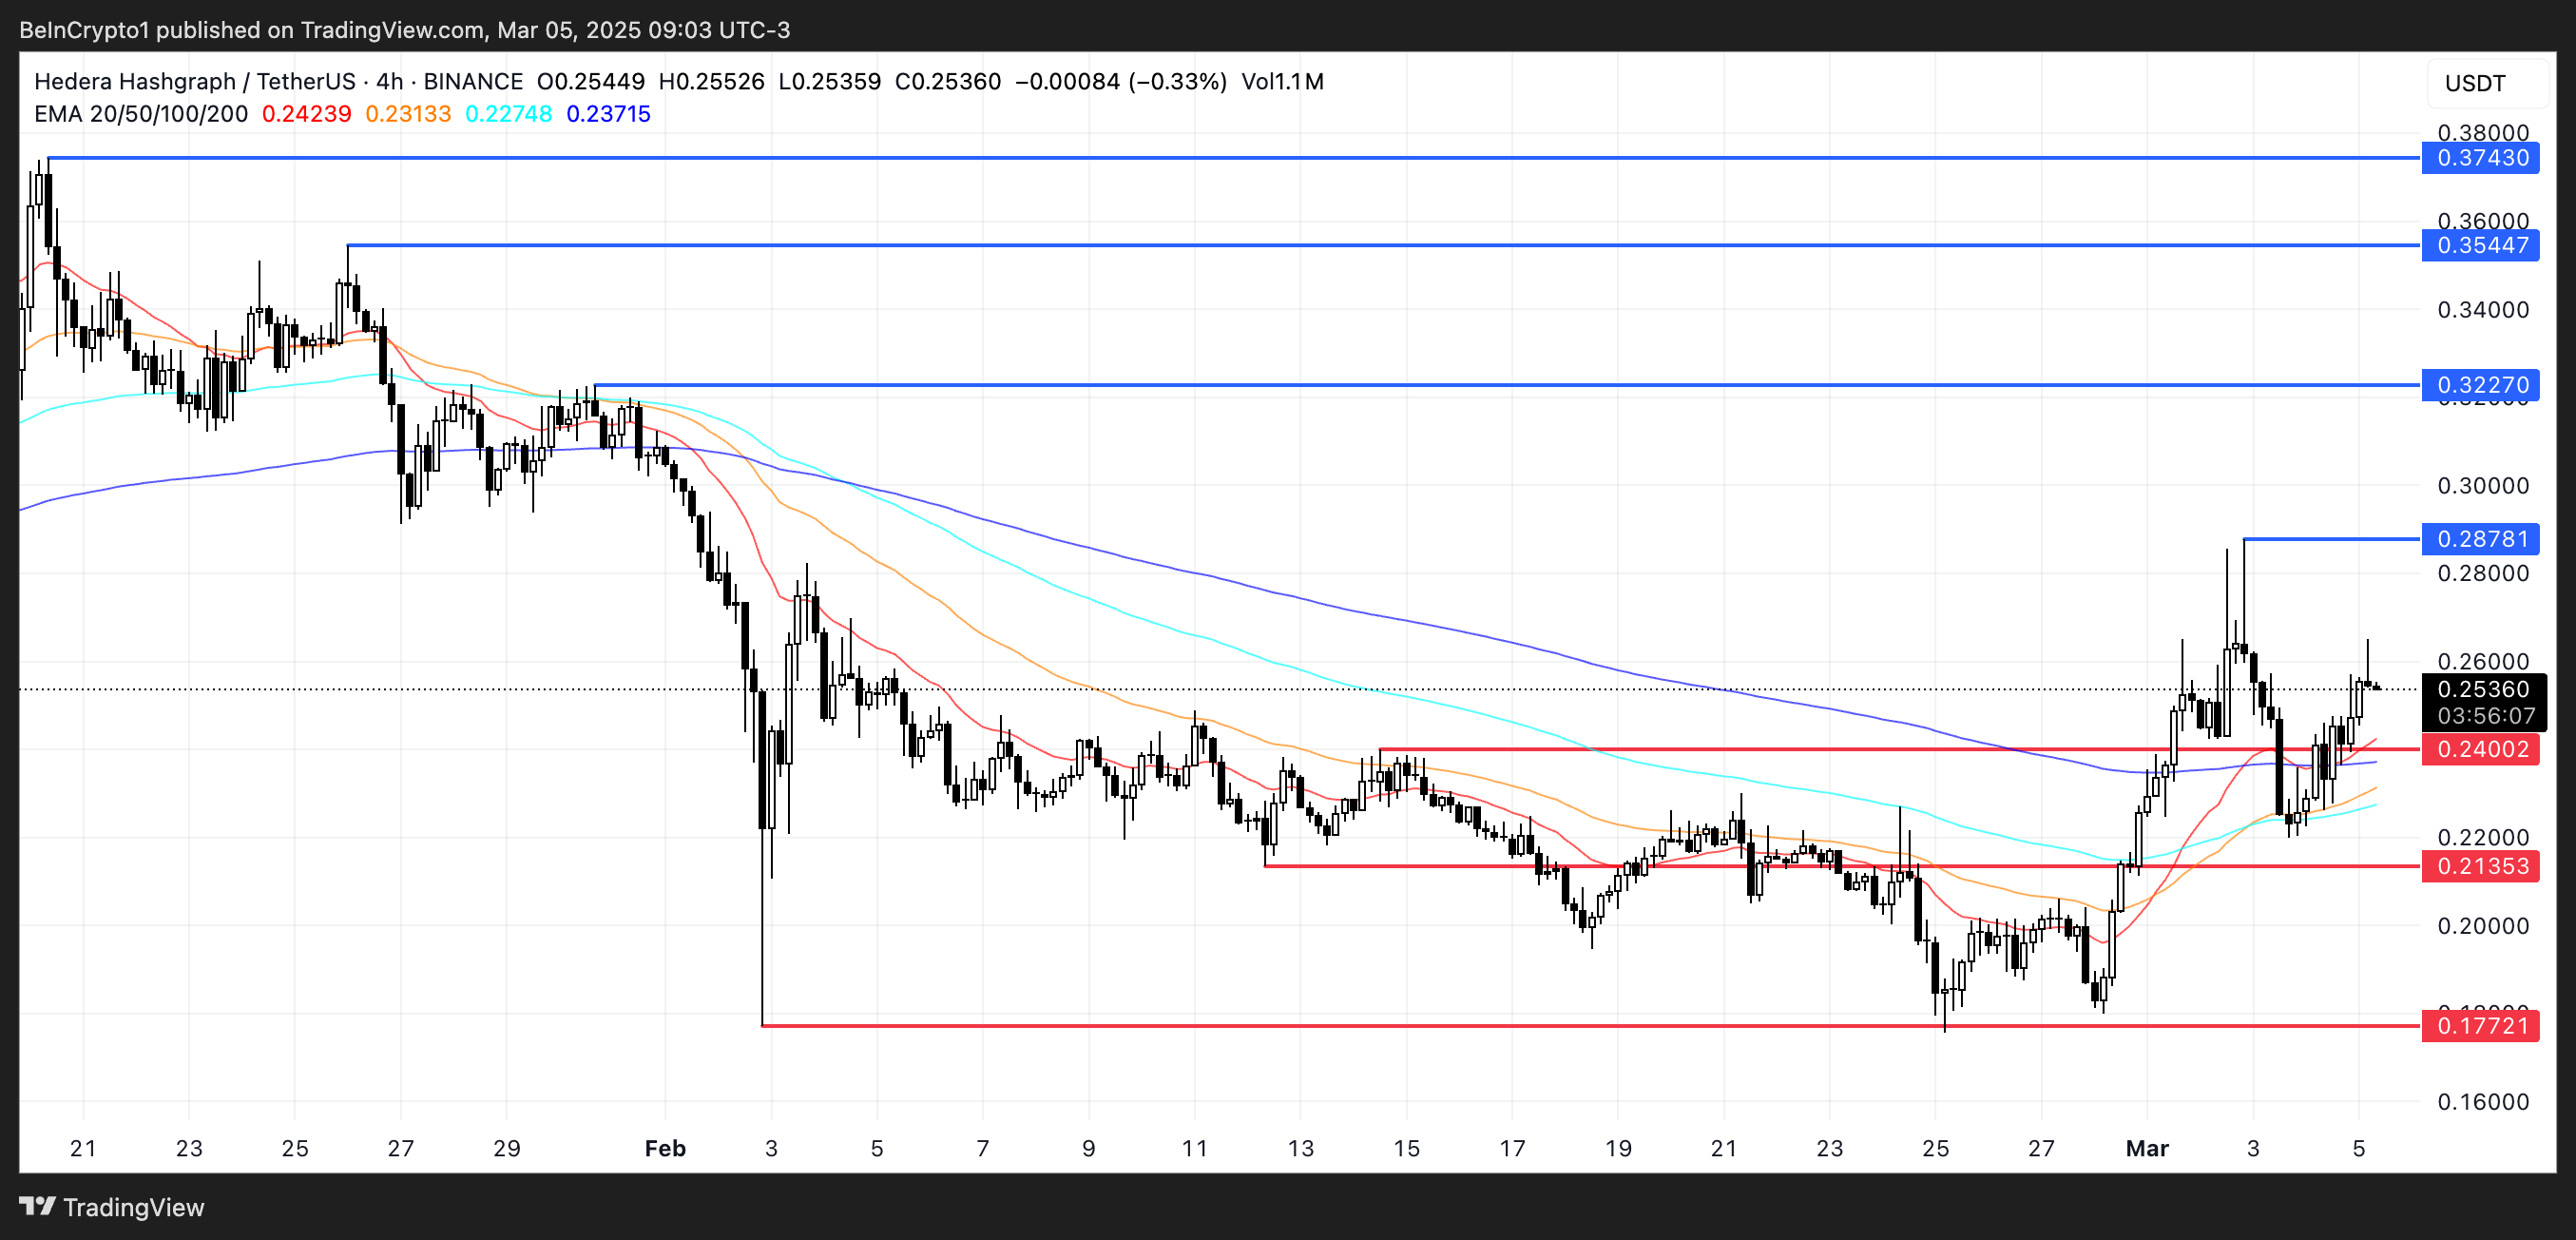
On the other hand, if the uptrend fails to materialize, HBAR could face a retest of the $0.24 support level.
Losing this support would indicate a weakening structure, potentially leading to a decline toward $0.213.
If bearish momentum intensifies and buying interest does not return, Hedera could drop further to $0.177, testing deeper support zones.
Disclaimer
In line with the Trust Project guidelines, this price analysis article is for informational purposes only and should not be considered financial or investment advice. BeInCrypto is committed to accurate, unbiased reporting, but market conditions are subject to change without notice. Always conduct your own research and consult with a professional before making any financial decisions. Please note that our Terms and Conditions, Privacy Policy, and Disclaimers have been updated.

Meme coin PEPE has been hovering near a crucial support level over the past few weeks, following a sustained decline that began at the start of the year. Interestingly, a crypto analyst on TradingView has highlighted this price support as a make-or-break level for PEPE, suggesting that a breakout above this zone could spark a 400% rally toward $0.0001. This outlook comes after a particularly challenging week for the entire crypto market, during which PEPE extended its losses and dropped to its lowest price point in months.
This Level To Trigger 400% Move For PEPE
Technical analysis shows that PEPE’s upward trajectory hinges on a bounce at support around $0.00000650. This interesting analysis was highlighted by a crypto analyst on the TradingView platform using the PEPE weekly candlestick timeframe chart.
Related Reading
This support level comes into play in light of PEPE’s extended decline since the beginning of the year. Interestingly, technical analysis shows that the decline looks like a repeating pattern of the meme coin’s price action in 2024. The ongoing correction stems from PEPE’s peak price of $0.00002803 in December 2024, which the analyst termed the third drive. Notably, earlier first and second drives in 2024 were also each accompanied by a correction phase after rallies.
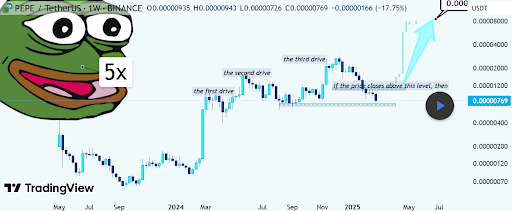
Interestingly, the meme coin has shown signs of life in the past 24 hours with a push above this support level and climbing into the $0.000007 range. However, the uptrend could not be defined yet, and the crypto analyst noted that any uptrend will depend on how PEPE reacts with a crucial resistance zone between $0.00001150 and $0.00001200.
This level has previously acted as support but has now turned into resistance. Therefore, a weekly close above this zone would confirm a bullish breakout and a potential trend reversal from bearish to bullish.
Price Targets If The Meme Coin Breaks Above Resistance
A break above $0.00001200 would cement a breakout with more momentum for PEPE. Such a breakout would mark the first bullish catalyst in a while, confirm momentum, and lead to increased buy-side pressure with an aggressive upward move. From here, the next resistance levels are projected to be around $0.00001700 to $0.00002200. A move to $0.00002200 will most likely cascade into more momentum above its current all-time high of $0.00002803.
Related Reading
The analyst further predicted a price target of $0.0001, provided the bullish momentum sustains itself. However, failure to close above the key resistance level at $0.00001200 could result in a continued downtrend, with PEPE possibly retesting lower support zones around $0.00000650 to $0.00000550.
At the time of writing, PEPE is trading at $0.000007239, up by 4.4% in the past 24 hours. PEPE’s ability to sustain such an upward trajectory would depend on broader market conditions for Bitcoin and other large market cap cryptocurrencies.
Featured image from Adobe Stock, chart from Tradingview.com

Ethereum Price Aims Higher—Can Bulls Push Past Key Resistance?
Ethereum Surges Nearly 10% As MVRV Ratio Drops Below 1—Bigger Rally Incoming?

BTC Nears $92K, Major Altcoins Gain

Hedera (HBAR) Surges 30%, Faces Key Resistance Level

Analyst Says Watch This Level To Trigger 400% Move Toward $0.0001

Analysts Predict Solana Price Next Big Move As Key Support Holds

2.52 Million Altcoins Are Ruining Crypto’s Future

Animoca Brands Valuation Tanks 75% In Two Years, Here’s Why

Crypto exchange BingX hacked for $43 million

Are The Big Players Losing Interest?

Hong Kong’s Securities Association Tips Authorities On Crypto Self-Regulation

Coinbase cbBTC Set to go Live on Solana
2.52 Million Altcoins Are Ruining Crypto’s Future
Animoca Brands Valuation Tanks 75% In Two Years, Here’s Why
Crypto exchange BingX hacked for $43 million
Are The Big Players Losing Interest?
Hong Kong’s Securities Association Tips Authorities On Crypto Self-Regulation
Coinbase cbBTC Set to go Live on Solana
-

 Market24 hours ago
Ethereum Price Attempts Recovery—Key Levels to Watch After $2,000 Drop
-

 Market22 hours ago
XRP Bulls on Edge—Could the Downtrend Continue?
-

 Regulation20 hours ago
Matrixport subsidiary Fly Wing receives Major Payment Institution License from MAS in Singapore
-

 Altcoin16 hours ago
Bitcoin Tests $90K on Speculation of Trump’s Crypto Reserve Plan
-
 Altcoin23 hours ago
XRP Price Shoots 10.5% Eyeing Ethereum Flippening With This Breakout
-
 Altcoin19 hours ago
Binance Extends RedStone Backing; RED Price To Hit New ATH?
-
 Market18 hours ago
Insights from Outlier Ventures CEO
-
 Altcoin18 hours ago
Lawyer Reveals If Ripple Vs SEC Resolution Possible In March