
Market
Cronos Eyes 70 Billion CRO Token Burn Reversal

Cronos, the EVM-compatible blockchain developed by Crypto.com, has proposed reissuing 70 billion previously burned CRO tokens.
Announced on March 3, 2025, the initiative seeks to restore the total supply of CRO to its original 100 billion. This would effectively reverse a significant token burn conducted in February 2021.
Cronos Calls for Token Burn Reversal
The reissued tokens will be allocated to a Cronos Strategic Reserve escrow wallet. The move is designed to support Cronos’ and Crypto.com’s long-term roadmap.
“Making America the World Capital of Crypto will ensure the successful execution of the Cronos roadmap, hence we are proposing that the community vote on the creation of a Cronos Strategic reverse, a reversal of the February 2021 token burn, to support this ambition,” the blog read.
Cronos’ leadership frames this as a pivotal step toward a “new golden age” for the blockchain. The restored token supply is intended to bolster liquidity and provide a financial buffer for ecosystem growth.
A core focus of this strategy is institutional adoption. The roadmap aims to position CRO among the top 10 blockchain protocols, with plans to develop a CRO exchange-traded fund (ETF) to offer regulated exposure to institutional investors. Additionally, the project is working toward US regulatory approval to integrate the ETF into institutional liquidity pools.
Beyond the ETF, the Cronos Strategic Reserve will support broader initiatives. These include traditional finance (TradFi) crossover projects, primarily by seeding the CRO ETF. It will also fund artificial intelligence (AI)-related initiatives, such as grants, developer tools, and funding for decentralized applications (dApps).
The reserve will operate under strict controls. Tokens will vest linearly over 10 years, approximately every 30.4 days, through the Cosmos SDK vesting account on the Cronos POS chain. This ensures a gradual release that aims to balance supply dynamics while funding strategic initiatives.
However, the move has raised eyebrows among the community.
“Did Cronos just become the Federal Reserve? Printing CRO out of thin air? A burn is a burn. Burnt tokens shouldn’t be brought back to life,” said one user on X.
Some investors worry that this might put downward pressure on CRO’s price.
“How in the world would this be healthy for CRO price action?” wrote another user.
Despite the concerns about potential dilution, CRO has shown strong price performance, rallying by double digits.

At press time, CRO was trading at $0.09. This marked a 15.5% increase over the past day.
Disclaimer
In adherence to the Trust Project guidelines, BeInCrypto is committed to unbiased, transparent reporting. This news article aims to provide accurate, timely information. However, readers are advised to verify facts independently and consult with a professional before making any decisions based on this content. Please note that our Terms and Conditions, Privacy Policy, and Disclaimers have been updated.


Ethereum (ETH) dipped over 7% in the last 24 hours despite Trump’s 90-day tariff pause. Key technical indicators suggest that a full trend reversal might be unlikely in the short term.
The BBTrend remains strongly negative, and whale accumulation has stalled, both signaling caution. Combined with a still-bearish EMA structure, Ethereum may need a stronger wave of buying pressure before it can break out of its current downtrend.
ETH BBTrend Is Strongly Negative But Bigger Than Yesterday
Ethereum’s BBTrend indicator has slightly improved, currently reading -18, up from -21.59 just before Trump’s tariff pause announcement.
This shift suggests that bearish momentum may be starting to fade, although it still signals overall downside pressure. The BBTrend (Band-Based Trend) is a volatility-based indicator that helps gauge the strength and direction of a trend using the relationship between price and Bollinger Bands.
Values above zero indicate bullish momentum, while negative values point to bearish trends—the further from zero, the stronger the directional conviction.
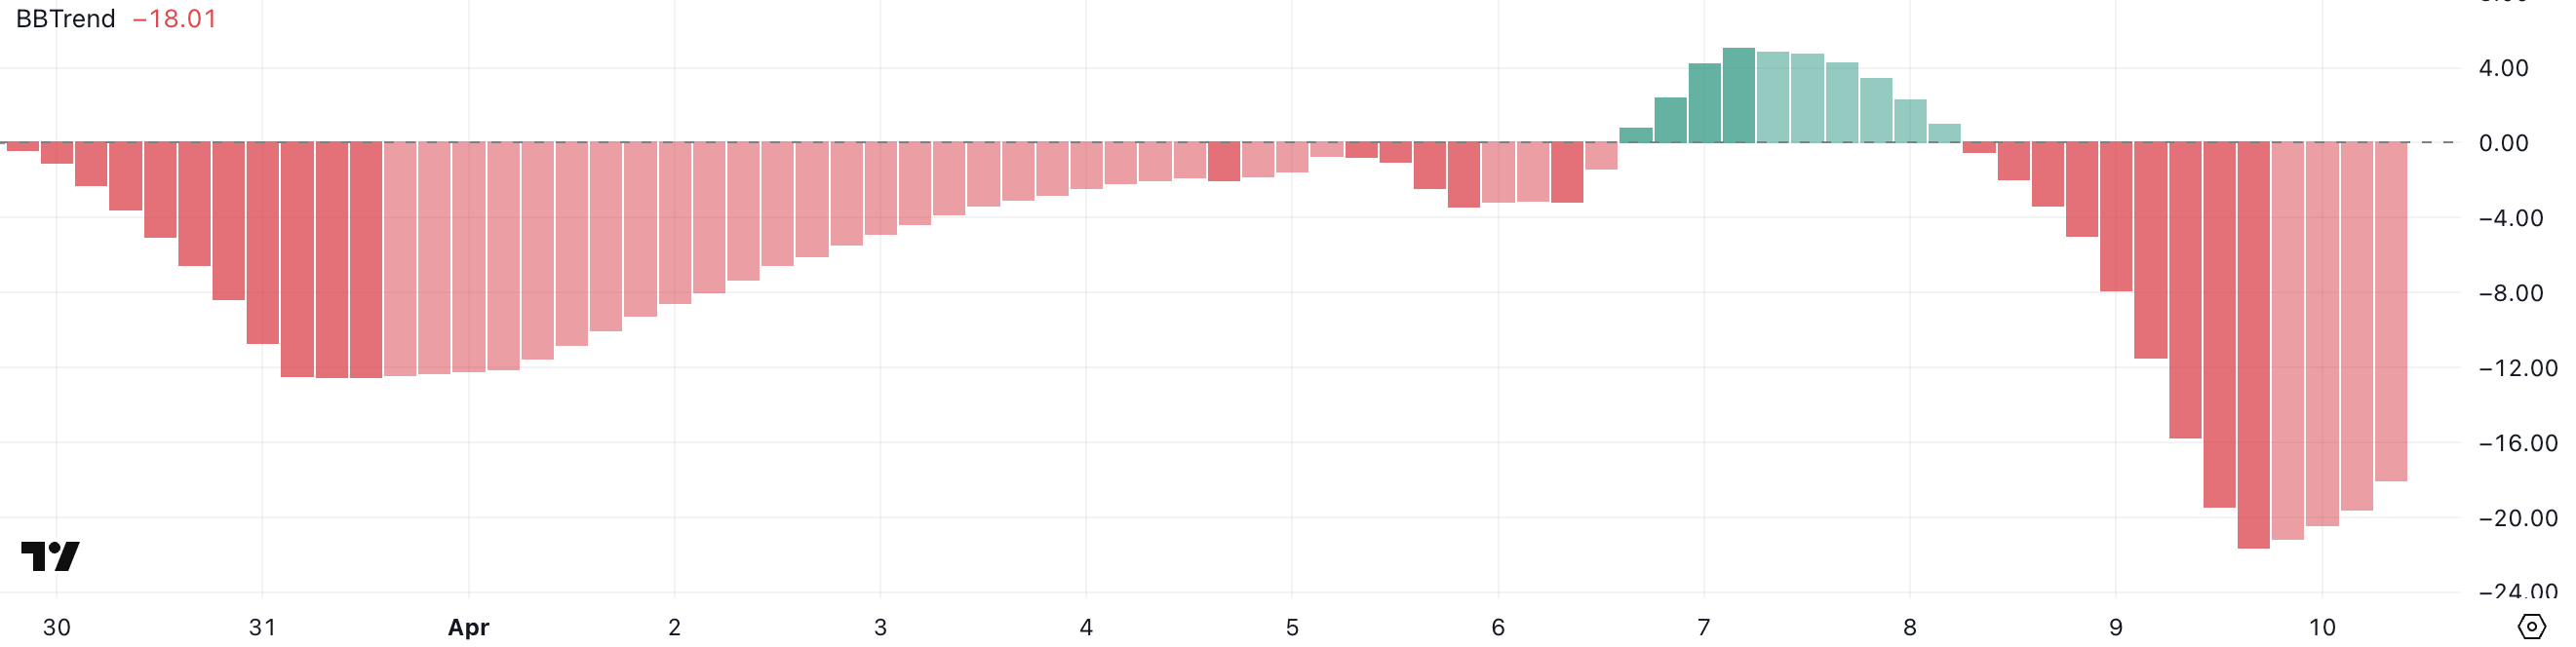
ETH’s BBTrend has remained in negative territory since April 8, reflecting sustained weakness in recent sessions. While the recent uptick could hint at early stabilization, the current value of -18 suggests Ethereum hasn’t yet flipped the broader trend.
For bullish confirmation, ETH would need to push BBTrend back toward neutral or positive territory, ideally supported by volume and strong price action.
Until then, the chart points to a market still in correction mode but with some signs of possible reversal ahead.
Whales Are Still Not Accumulating
The number of Ethereum whales—wallets holding between 1,000 and 10,000 ETH—rose from 5,340 to 5,382 between April 5 and 6, marking a brief uptick in accumulation.
However, the metric has since stabilized and currently sits at 5,376, showing little change in recent days.
Tracking whale activity is critical because these large holders often have the influence to move markets, either by initiating big buys during dips or selling into strength to take profits.
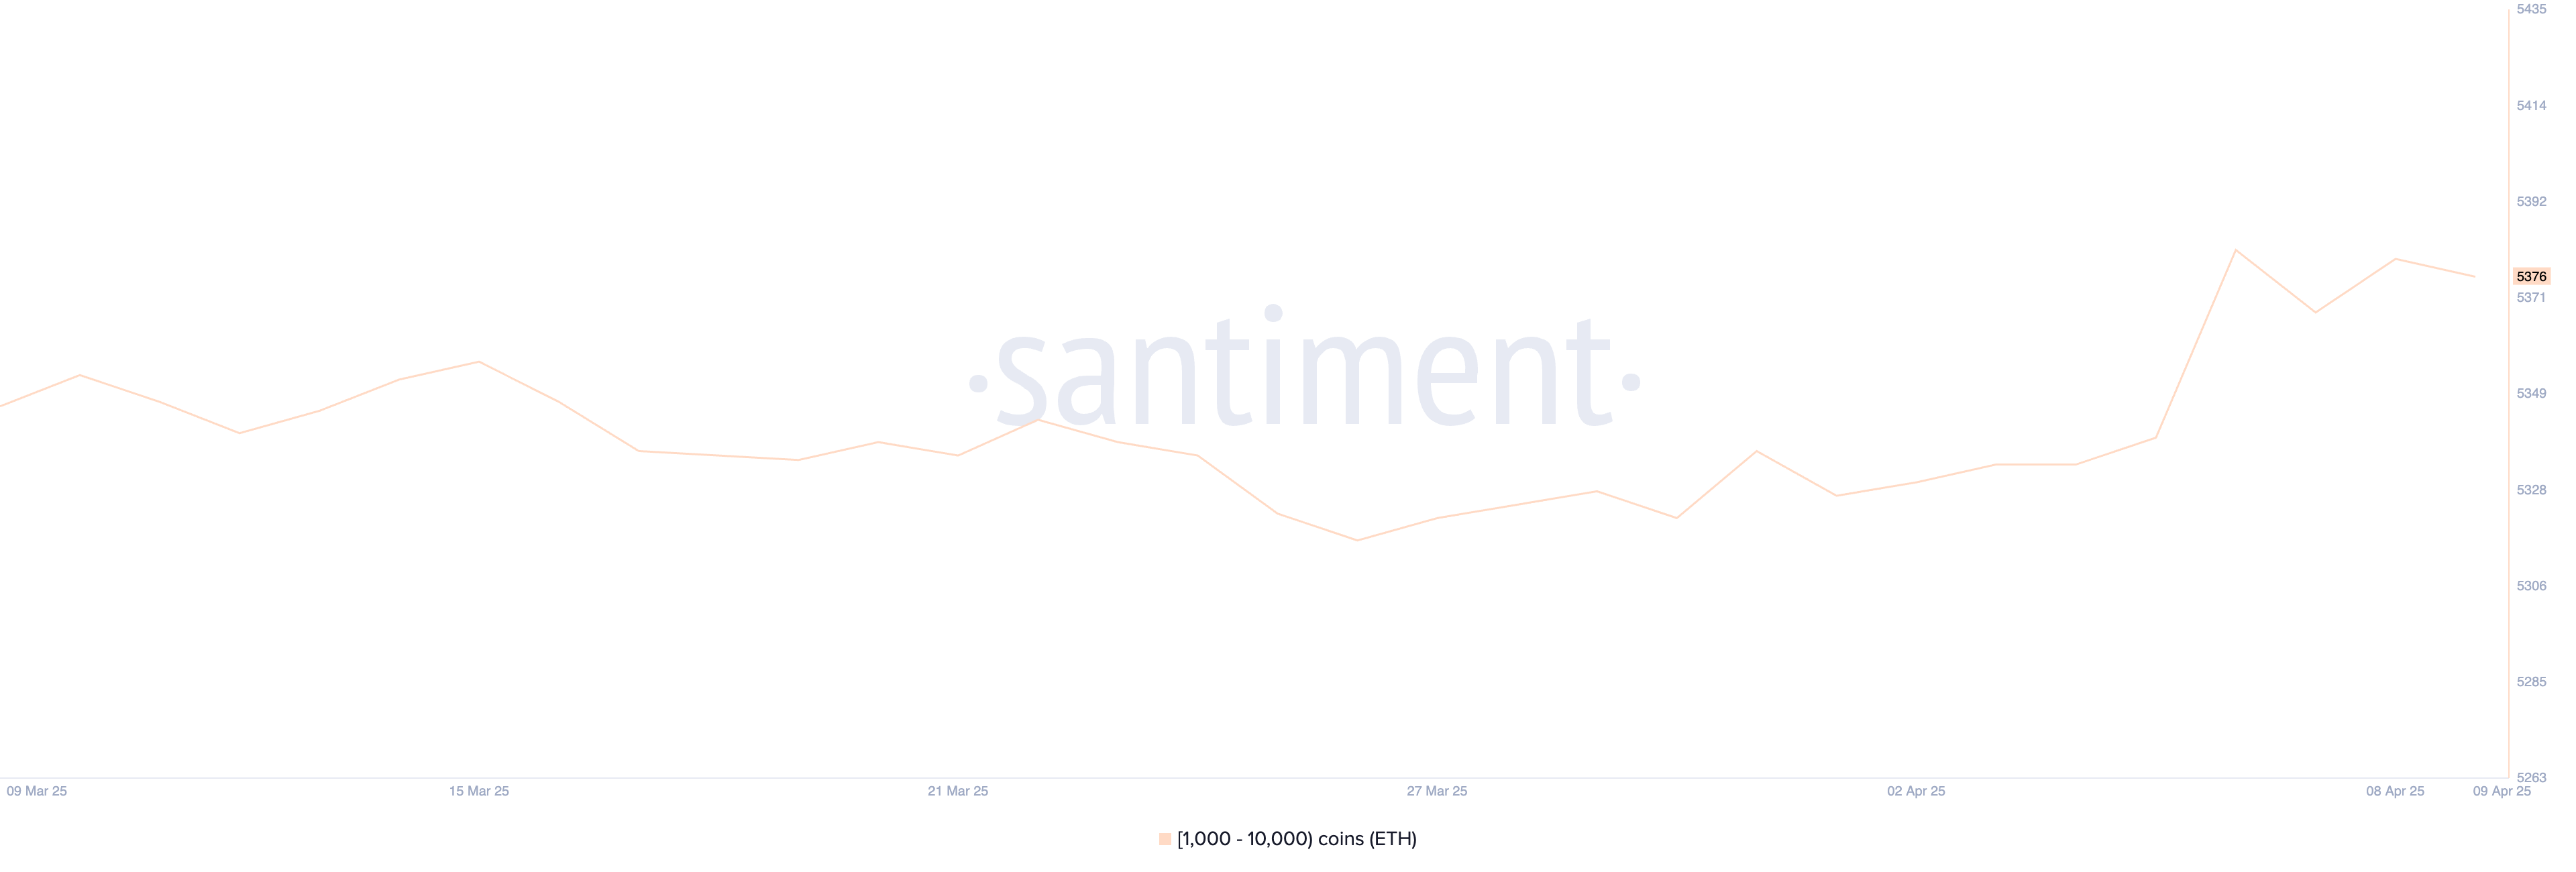
The recent stabilization in whale numbers suggests a wait-and-see approach from major holders. After a brief accumulation spike, whales appear to be holding their positions rather than aggressively buying or selling.
This could mean that confidence is returning but not yet strong enough to fuel a major breakout.
For Ethereum to see sustained upward momentum, a renewed rise in whale accumulation would be a positive signal, indicating growing conviction from the largest players in the market.
Is The Current Ethereum Surge Just Temporary?
Despite Ethereum’s recent bounce following Trump’s tariff pause, its EMA structure remains bearish, with short-term moving averages still positioned below the longer-term ones.
This lagging alignment typically reflects continued downside pressure, even during relief rallies.
When viewed alongside other indicators—like the still-negative BBTrend and stagnant whale accumulation—it becomes clear that Ethereum needs significantly more buying volume to shift into a confirmed uptrend.
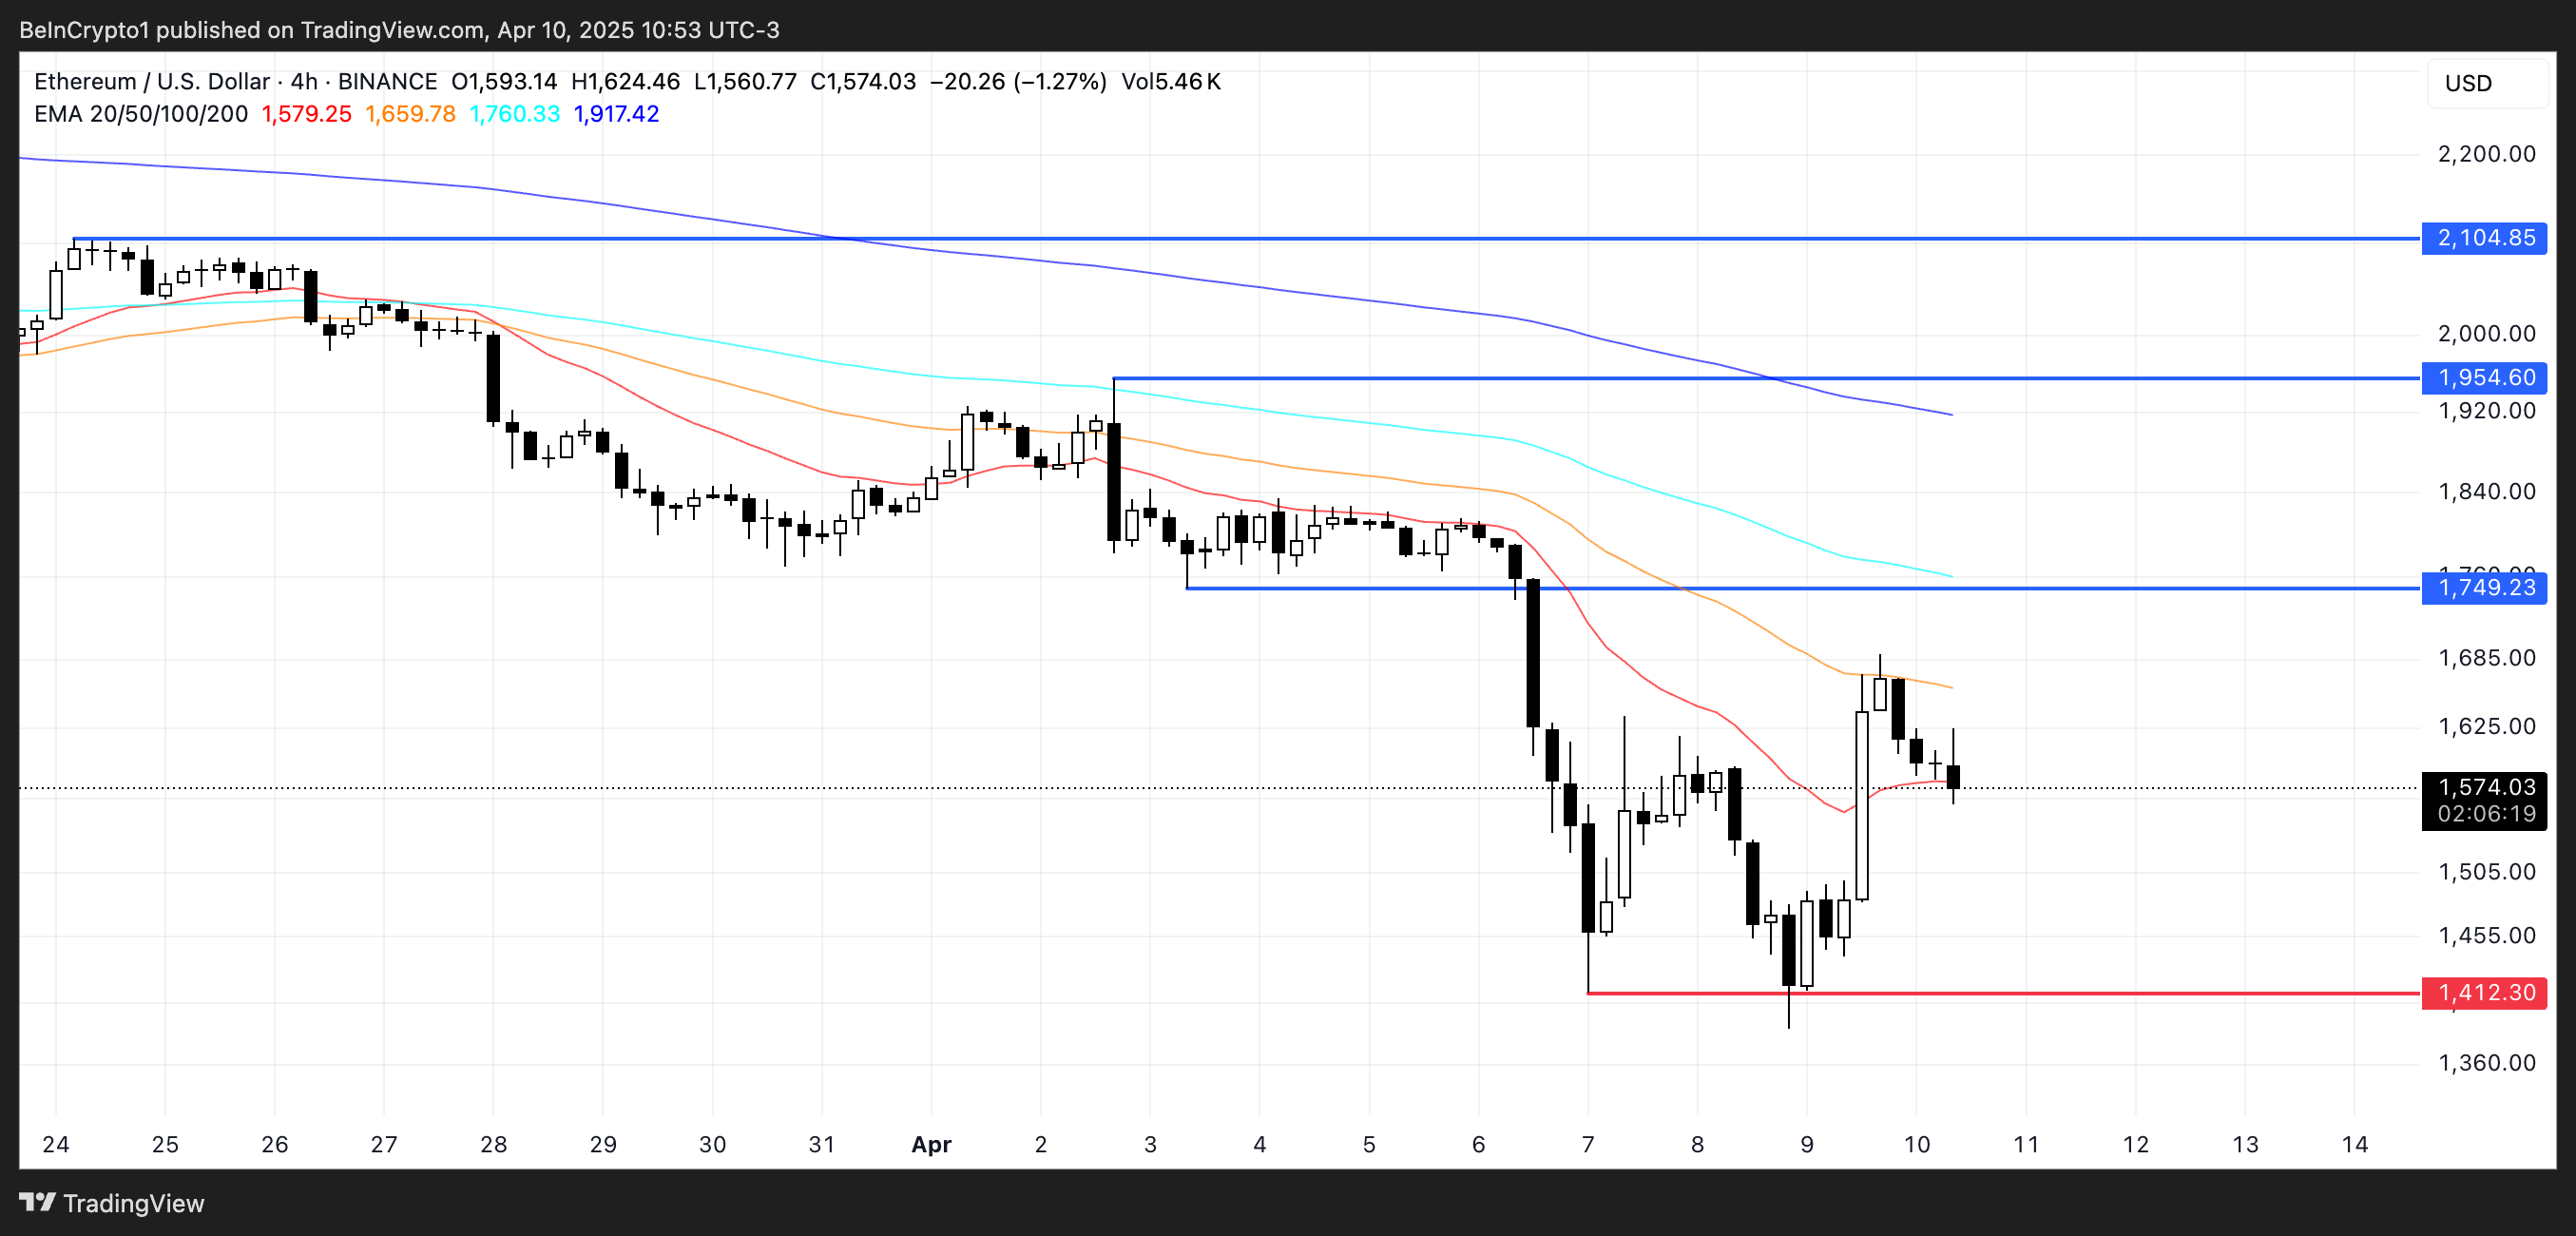
If that bullish pressure does emerge, Ethereum’s price could aim to test resistance at $1,749, and a breakout there could open the path to $1,954 and even $2,104. That could be driven by macro developments, like the SEC’s recent approval of options trading on BlackRock’s Ethereum ETF.
However, if momentum fades, the price risks entering another correction phase.
Key support lies at $1,412, and if that level fails, ETH could slip below $1,400 and potentially revisit sub-$1,300 territory.
Disclaimer
In line with the Trust Project guidelines, this price analysis article is for informational purposes only and should not be considered financial or investment advice. BeInCrypto is committed to accurate, unbiased reporting, but market conditions are subject to change without notice. Always conduct your own research and consult with a professional before making any financial decisions. Please note that our Terms and Conditions, Privacy Policy, and Disclaimers have been updated.

The value of Cardano’s ADA has soared nearly 10% in the past 24 hours, joining the broader crypto market in a strong recovery rally.
The coin’s technical indicators point to renewed bullish momentum, suggesting that ADA may be gearing up for further gains in the near term.
Cardano Gathers Steam with an 8% Gain
ADA is up 8% over the past day, with its recent price action hinting at growing investor confidence. A key factor supporting this upward trajectory is the rise in its Chaikin Money Flow (CMF), signaling increased capital inflow and accumulation.
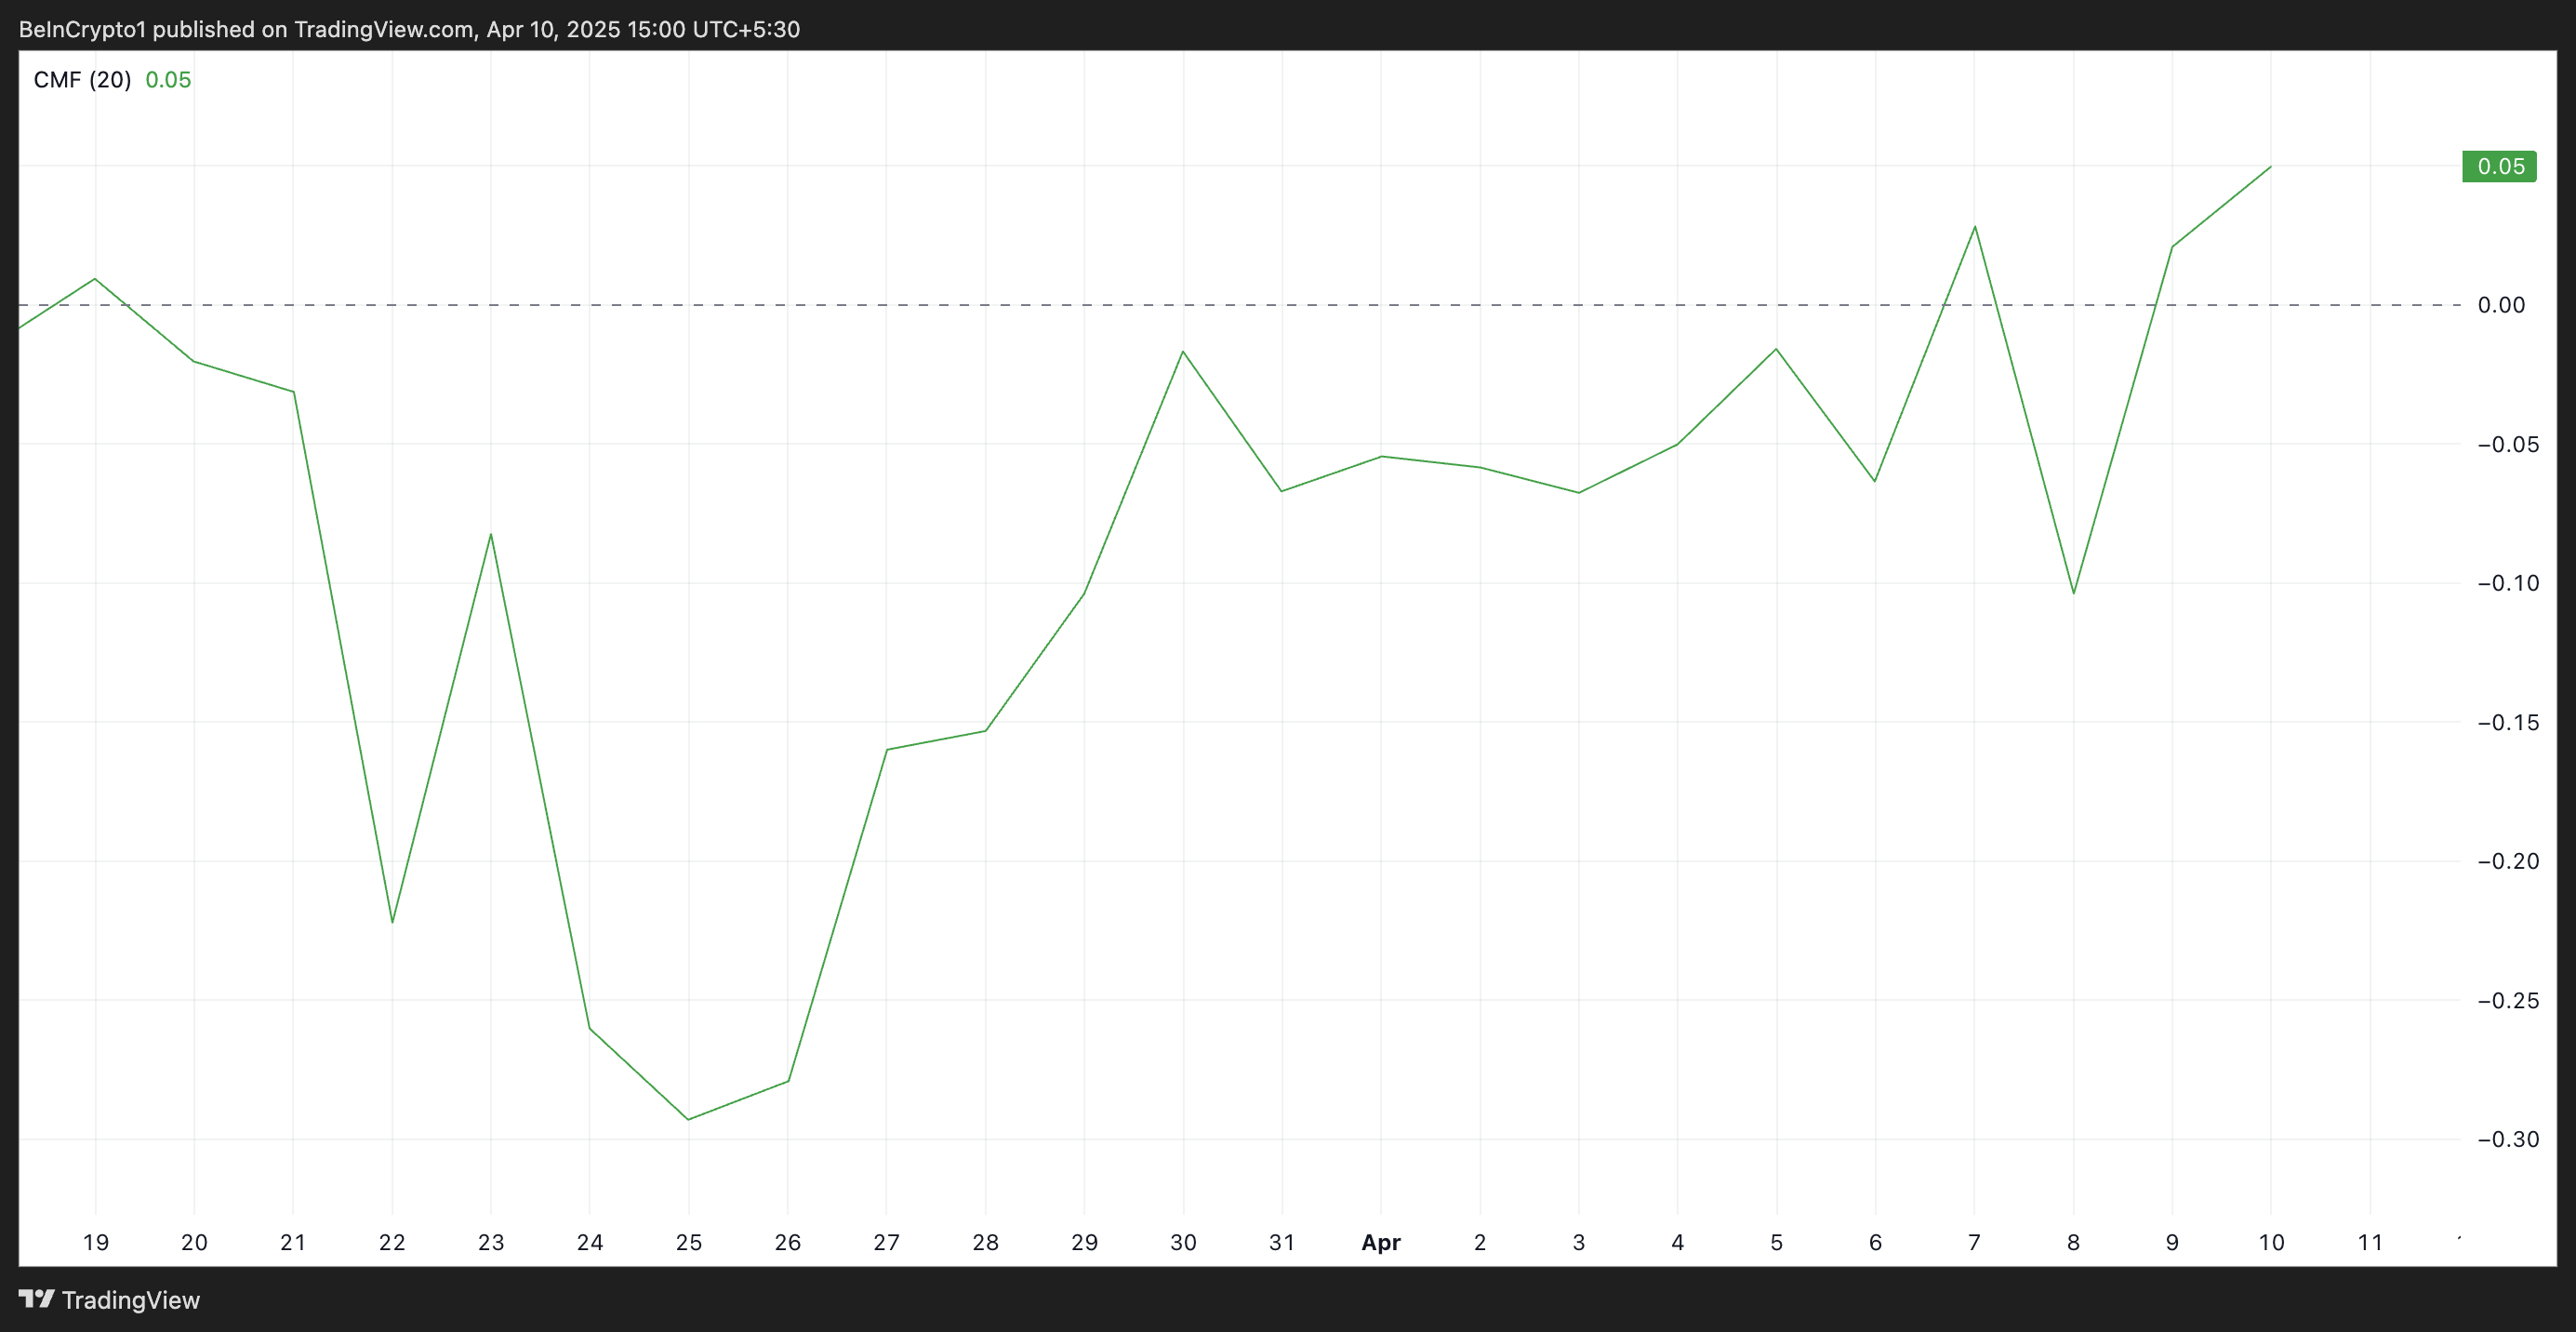
At press time, this indicator, which measures the flow of money into and out of an asset, rests above the zero line at 0.05 and is in an uptrend.
An asset’s positive CMF reading indicates that buying pressure is stronger than selling pressure, suggesting accumulation. This signals growing bullish sentiment in the ADA spot markets as more investors buy the altcoin.
Additionally, ADA’s Moving Average Convergence Divergence (MACD) is approaching a potential golden cross—a historically bullish indicator that occurs when the MACD line (blue) crosses above the signal line.
The MACD indicator measures asset price trends and identifies reversal points. When a potential golden cross emerges, it hints at an upcoming bullish crossover, often seen as an early indicator of upward momentum.
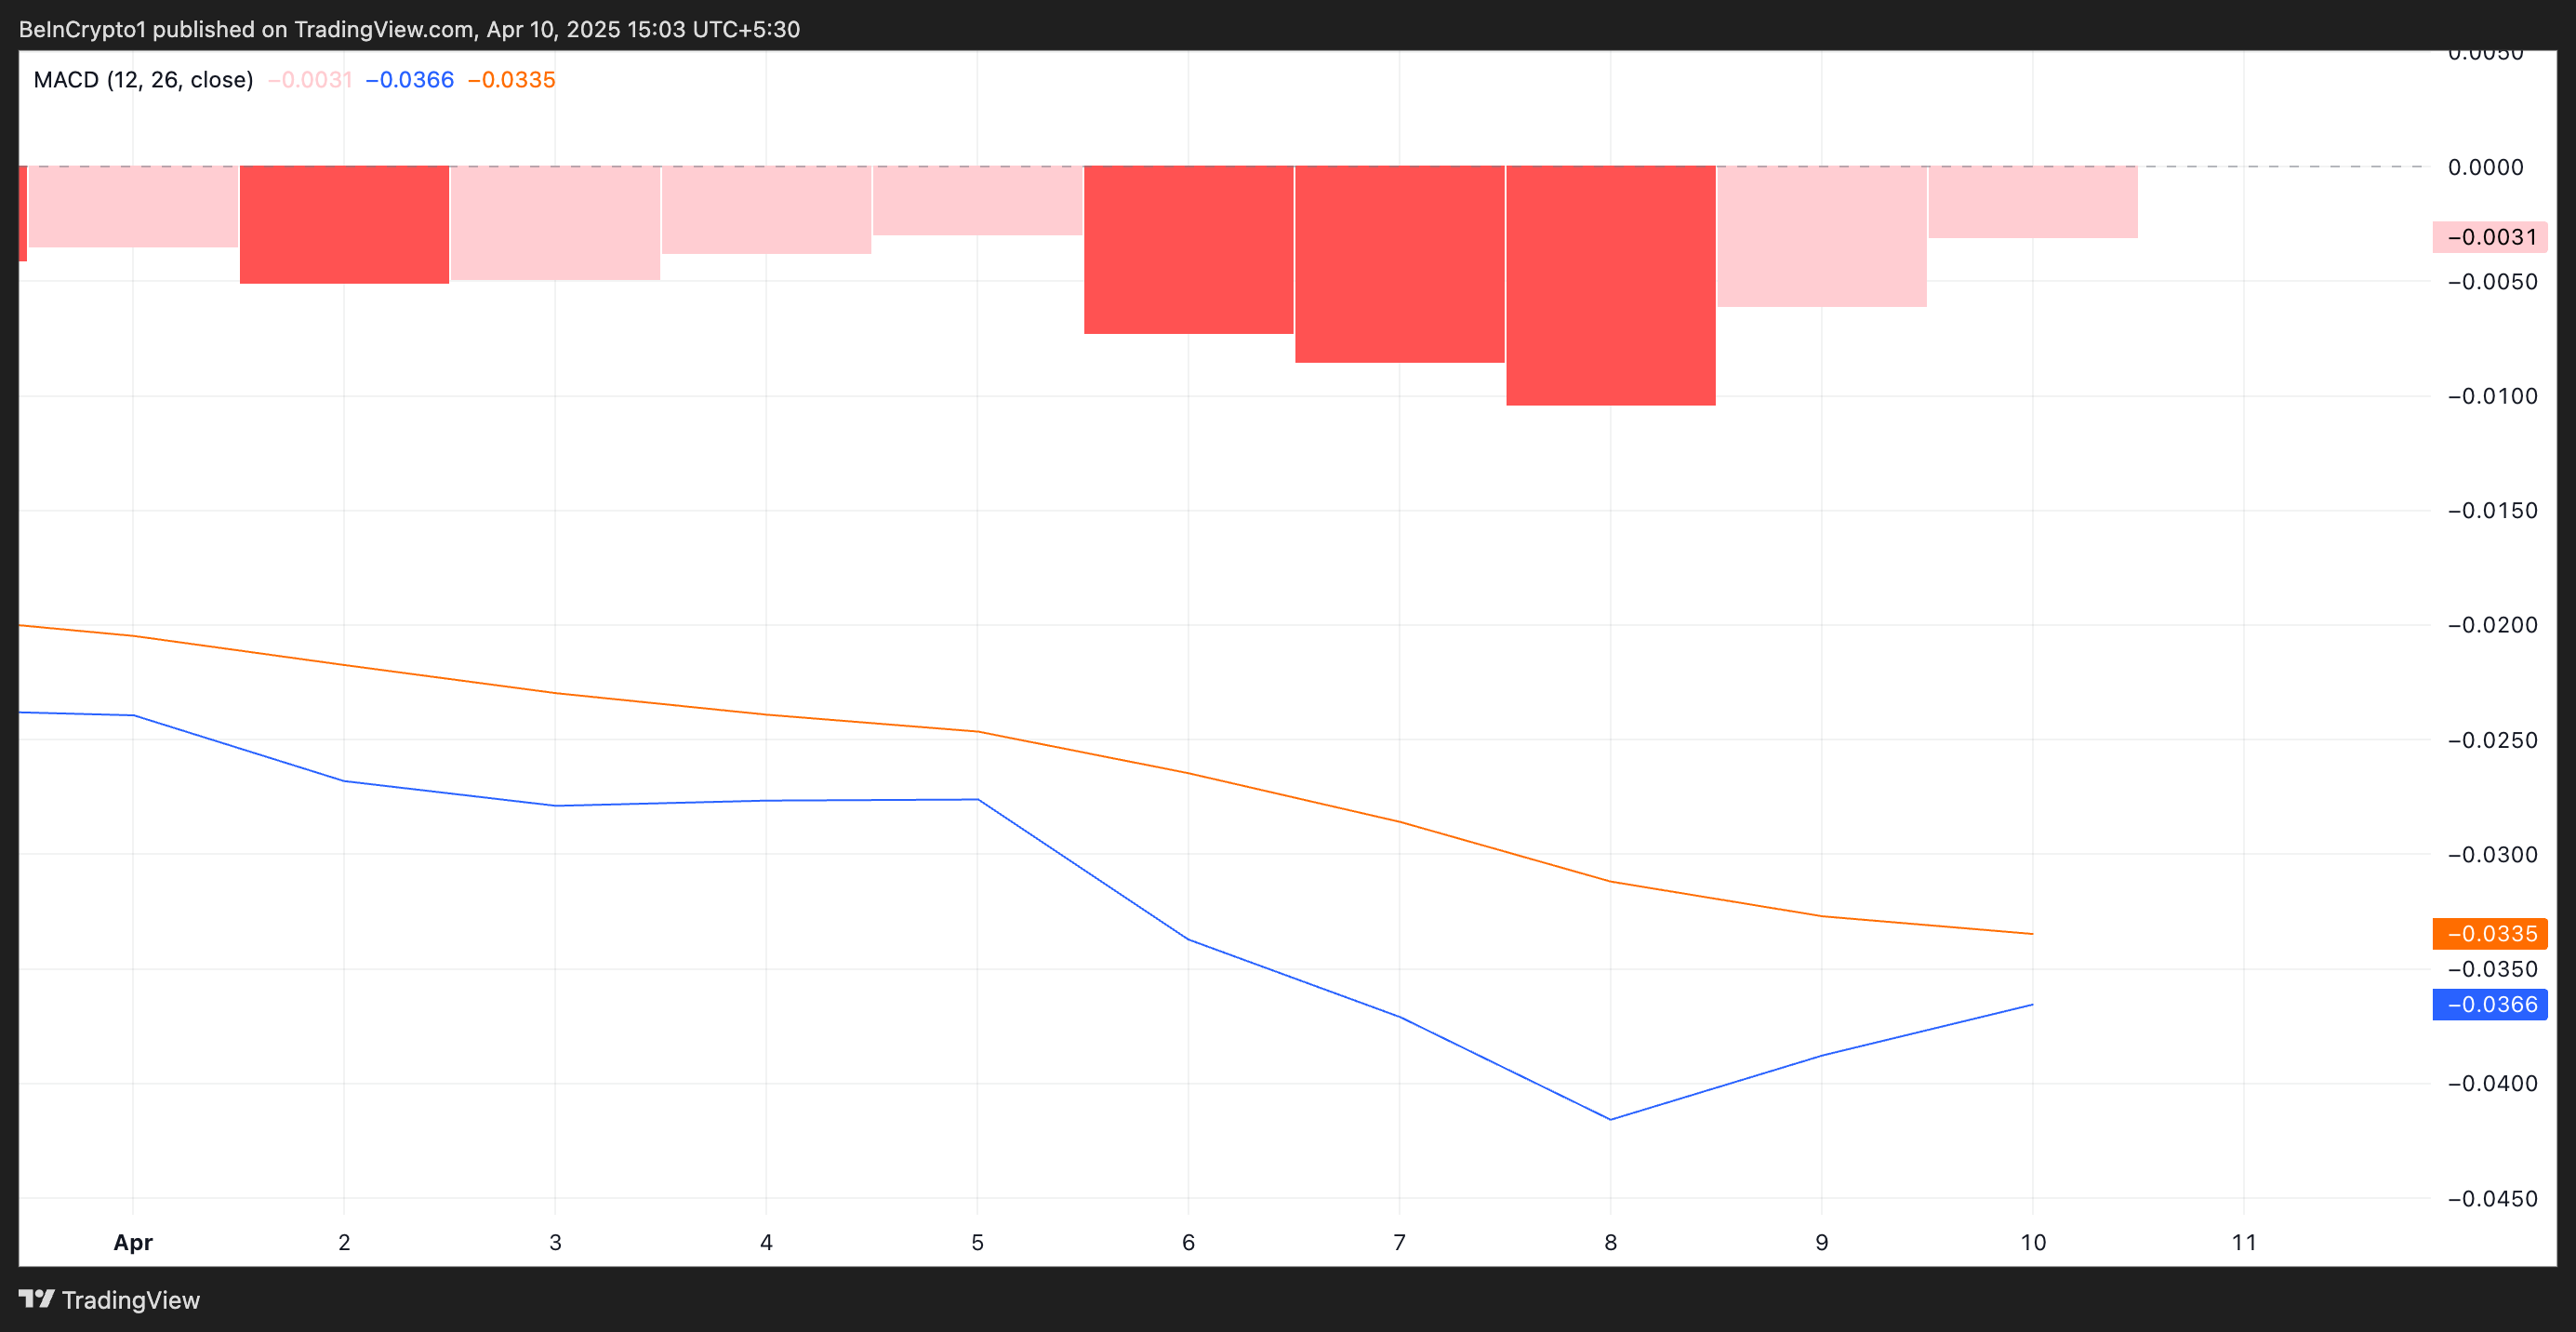
This suggests that ADA’s short-term price strength is increasing, which, if confirmed, could lead to a sustained price rally.
Cardano Bulls Eye $0.76 as Buying Pressure Mounts
A combined reading of these bullish signals reflects strong buying pressure behind ADA, with traders potentially anticipating a breakout. If momentum continues to build, ADA could soon challenge and surpass the resistance level at $0.64.
A break above this barrier may open the door for an extended rally, especially if broader market sentiment remains supportive. In that case, the coin’s price could reach $0.76.
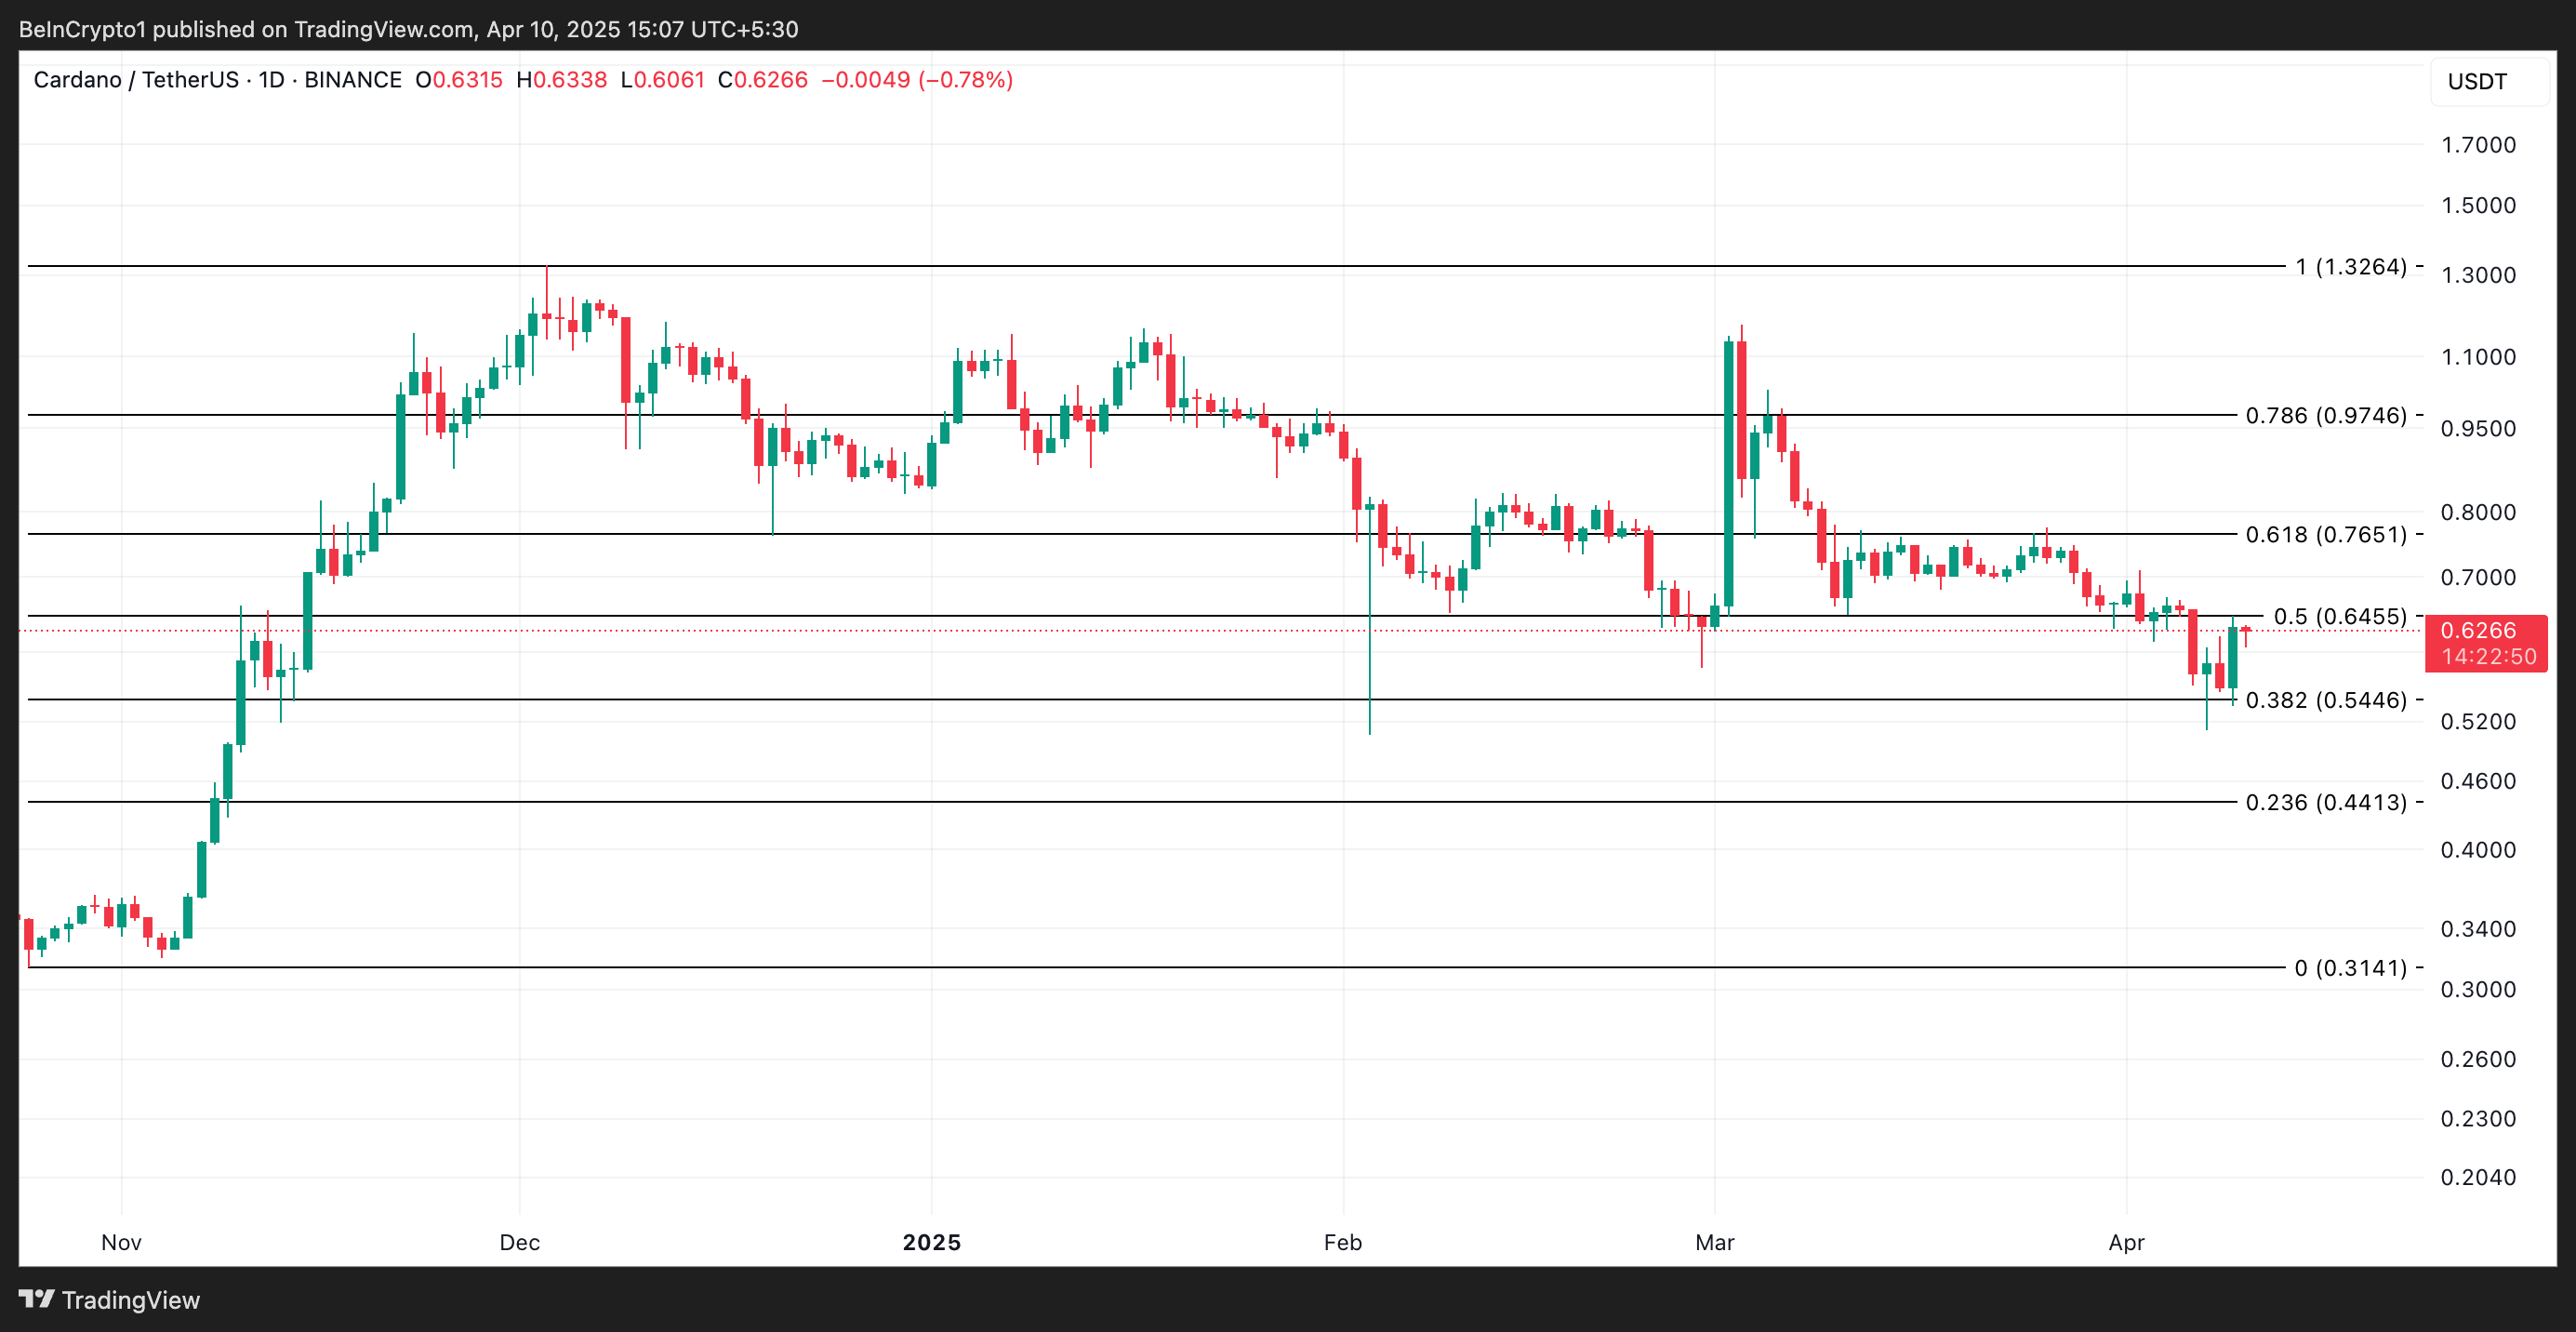
On the other hand, if ADA loses its bullish momentum, it could drop to $0.54.
Disclaimer
In line with the Trust Project guidelines, this price analysis article is for informational purposes only and should not be considered financial or investment advice. BeInCrypto is committed to accurate, unbiased reporting, but market conditions are subject to change without notice. Always conduct your own research and consult with a professional before making any financial decisions. Please note that our Terms and Conditions, Privacy Policy, and Disclaimers have been updated.

Hedera (HBAR) has recovered over 5% in the past week. Despite some corrections today, multiple technical indicators flash bullish signals, suggesting a potential shift in momentum.
The DMI shows buyers firmly in control, the Ichimoku Cloud has flipped bullish, and a golden cross appears close to forming on the EMA lines. With key resistance levels approaching, HBAR could be gearing up for an extended move—if the current momentum holds.
HBAR DMI Shows Buyers Are In Full Control
Hedera’s DMI chart is showing signs of strengthening trend momentum, with the ADX (Average Directional Index) rising to 24.17 from 21.82 just a day ago.
The ADX measures the strength of a trend regardless of its direction. Readings above 25 typically indicate a strong trend, while values between 20 and 25 suggest a trend may be developing.
With the ADX nearing that threshold, Hedera could be preparing for a more decisive move if momentum continues building.
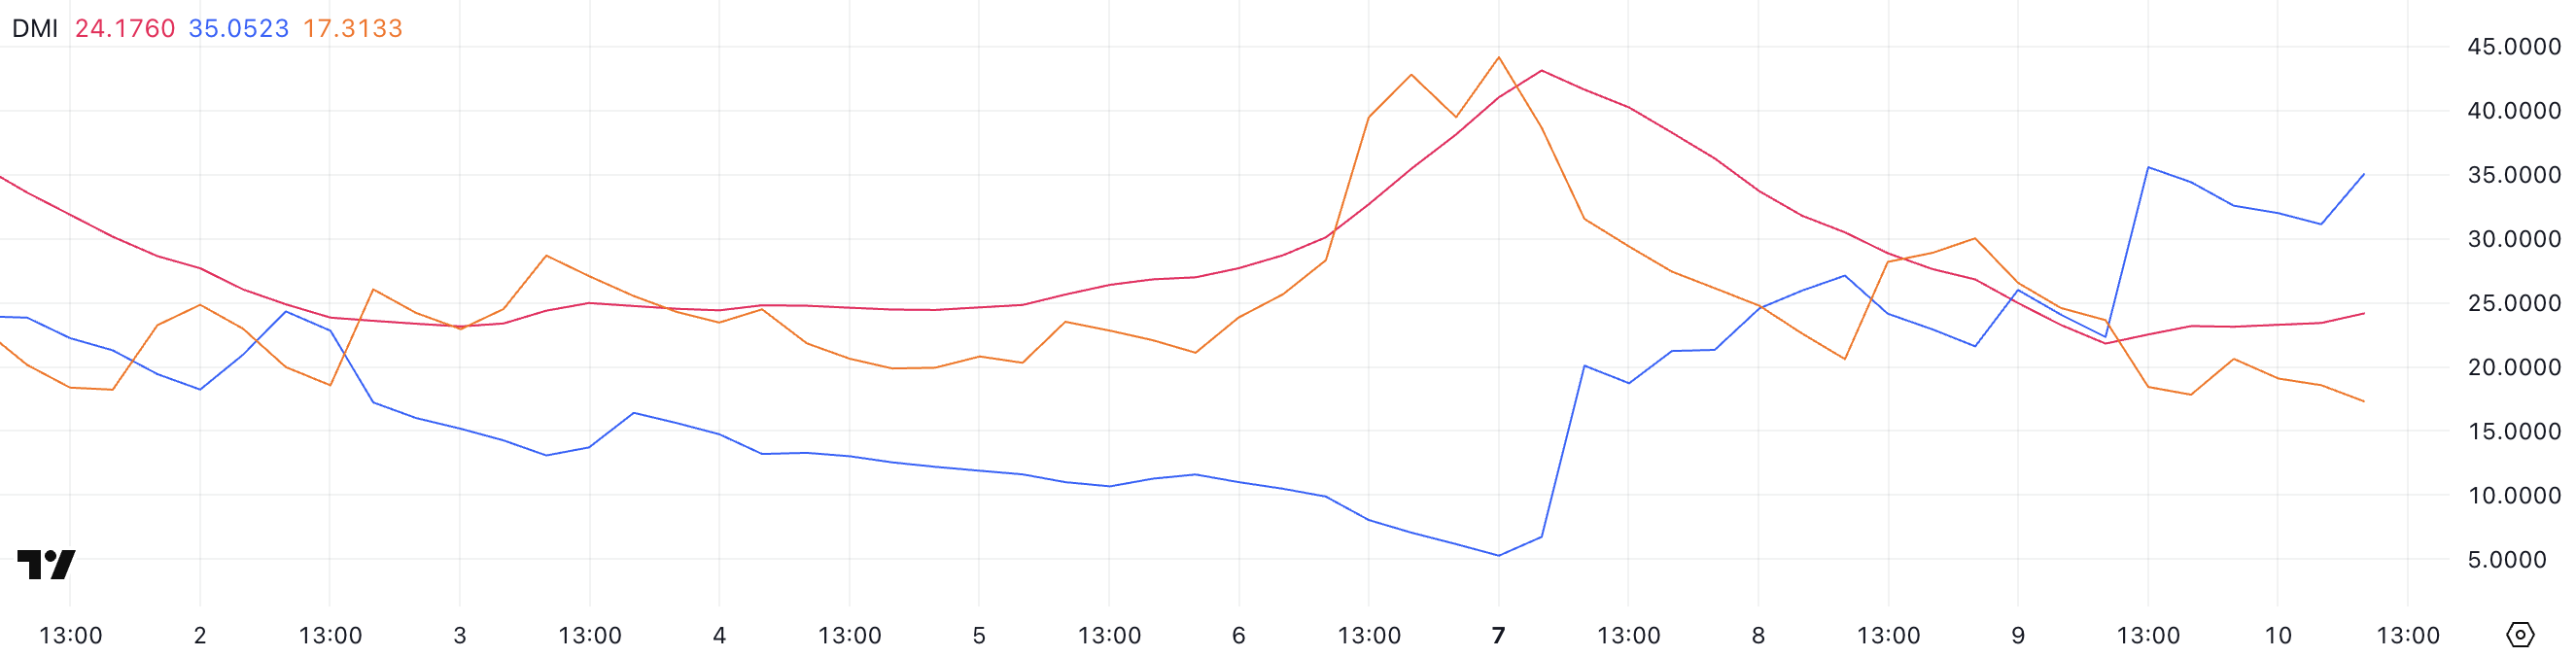
Looking at the directional indicators, the +DI has surged to 35.05 from 22.33, while the -DI has dropped to 17.31 from 23.65. This widening gap between the bullish and bearish pressure signals a strong shift in favor of buyers.
If this setup holds, it could indicate a developing uptrend for HBAR, especially if the ADX continues to climb above 25.
The combination of rising bullish momentum and weakening selling pressure is a positive technical signal, suggesting that Hedera may be gearing up for further upside in the short term.
Hedera Ichimoku Cloud Shows A Bullish Setup
Hedera’s Ichimoku Cloud chart is flashing a bullish signal. After a strong move upward, price action broke above the red cloud (Kumo).
This breakout places the candles above both the Tenkan-sen (blue line) and the Kijun-sen (red line), which is generally seen as a sign of bullish momentum and short-term trend strength.
The cloud ahead has also started to thin, suggesting that resistance may be weakening. If momentum holds, further upside is more achievable.
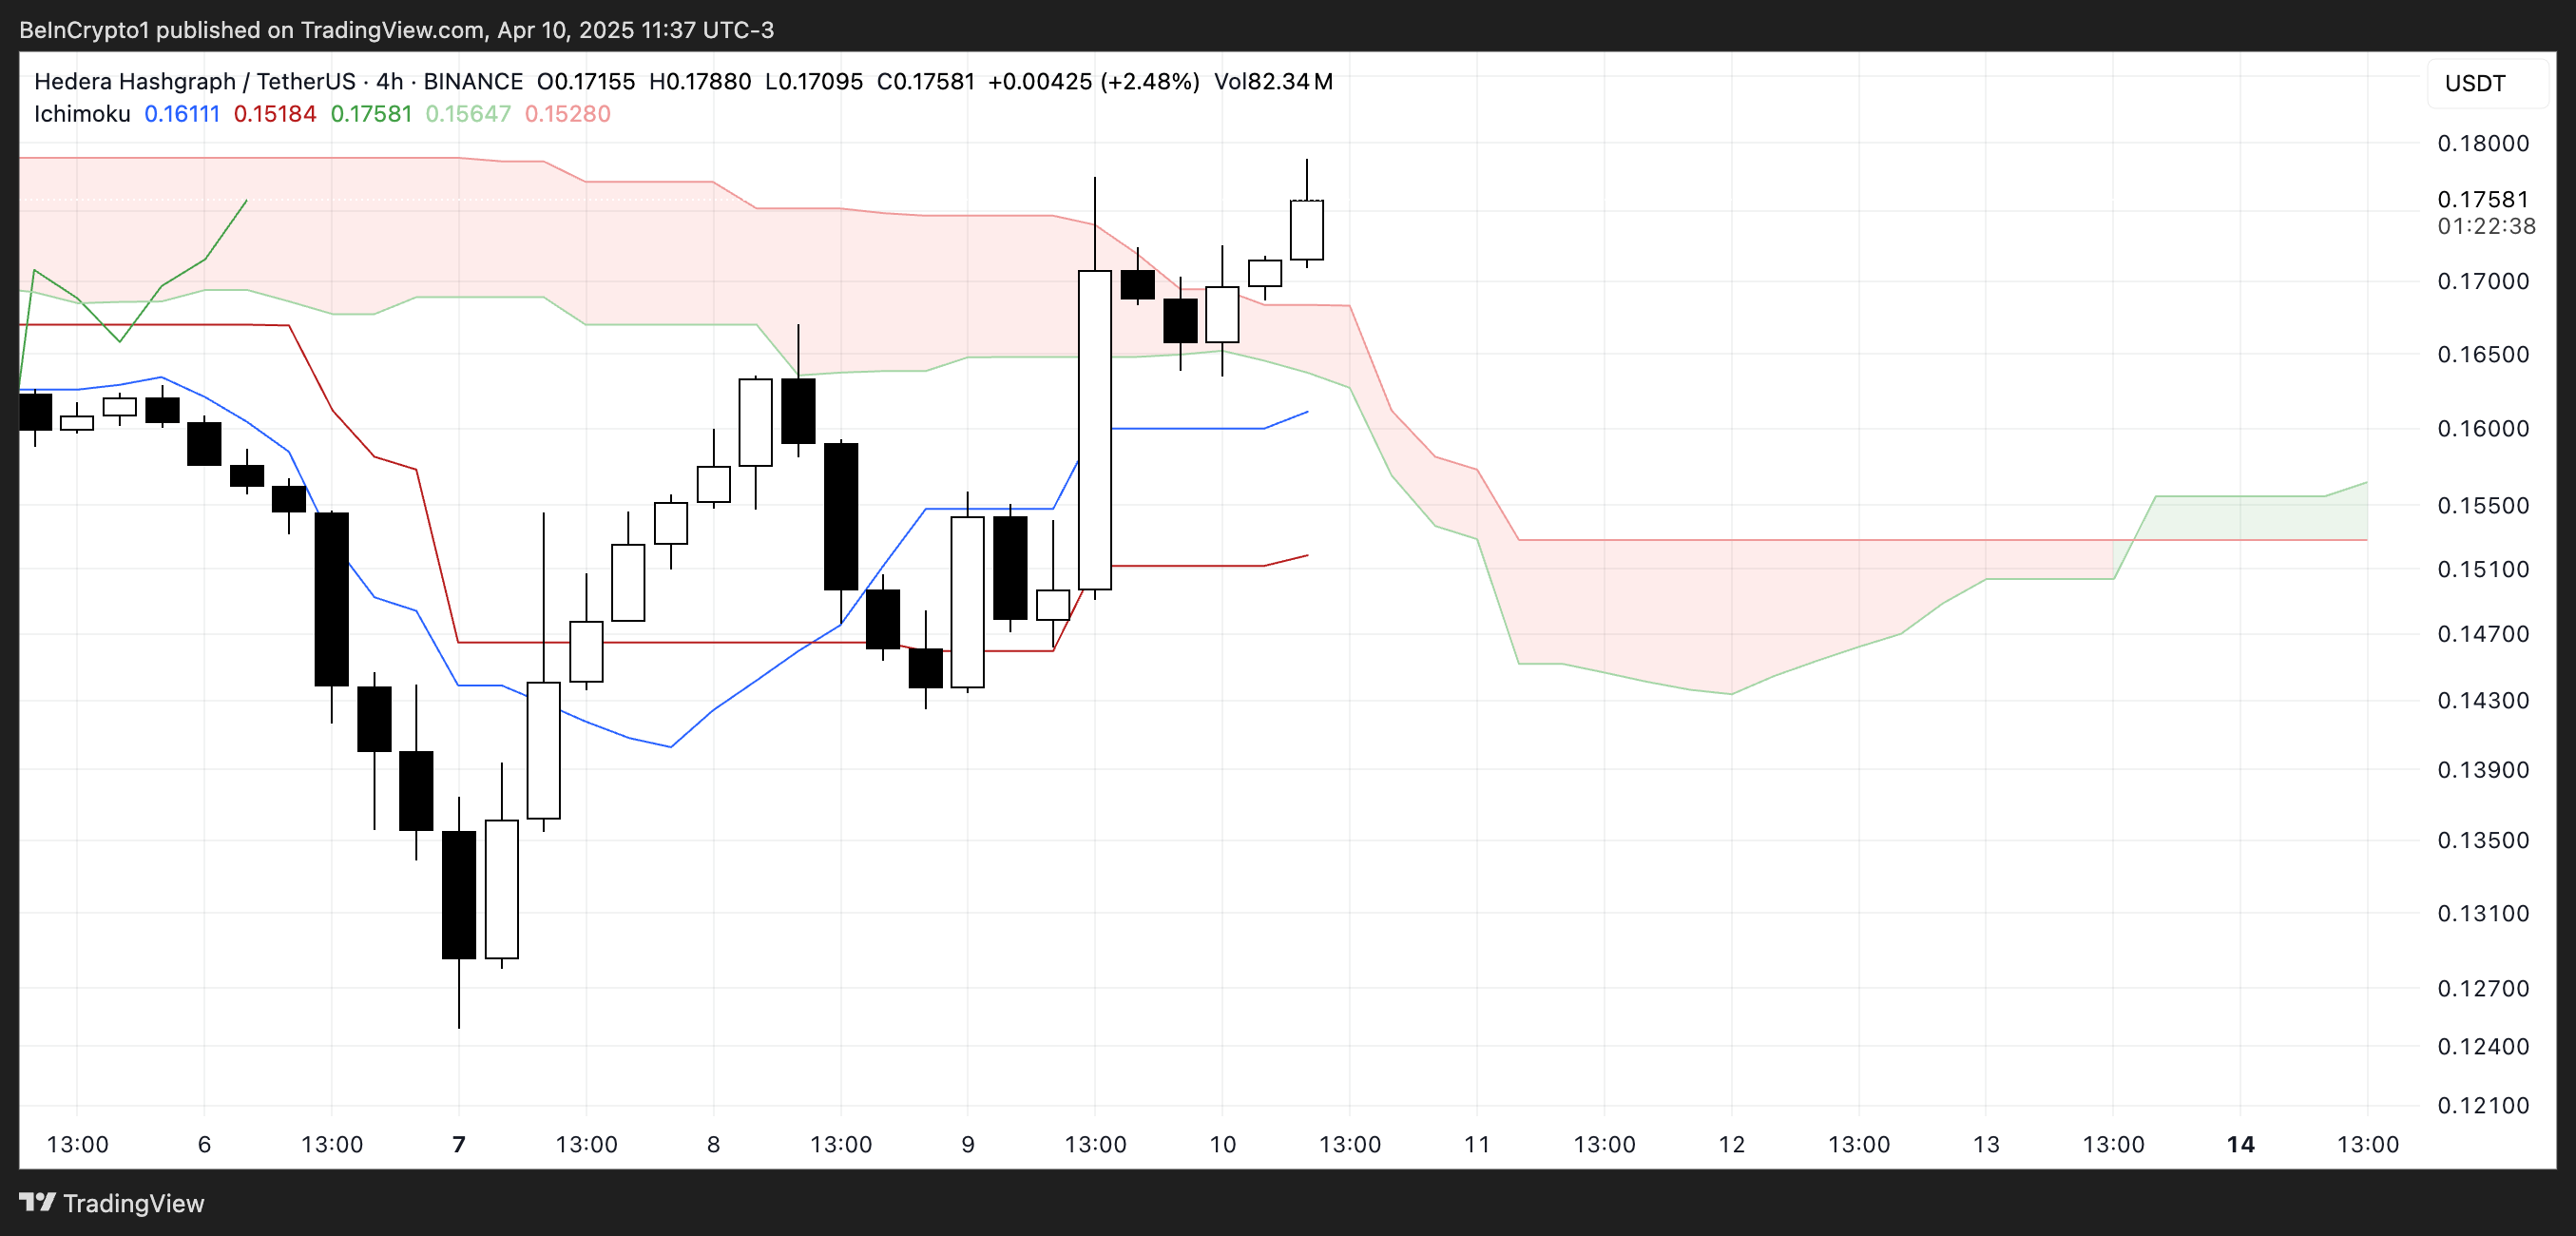
The Chikou Span (lagging green line) is now positioned above the price candles and the cloud, reinforcing the bullish bias. However, with the cloud still showing a mostly flat and narrow structure, the current trend doesn’t yet show strong continuation signals.
If the price remains above the cloud and the Tenkan-sen continues to lead above the Kijun-sen, Hedera could sustain this upward trajectory.
But traders should watch closely for any signs of a reversal back into or below the cloud, which would weaken the bullish setup.
Hedera Could Surge Soon If The Golden Cross Emerges
Hedera’s EMA lines are tightening, signaling a potential breakout. A golden cross—where short-term EMAs move above long-term ones—appears to be forming, which would typically indicate a bullish trend reversal.
If confirmed, this setup could push Hedera price toward resistance levels at $0.18 and $0.20, and if the momentum holds, even higher targets like $0.21 and $0.258 may come into play.
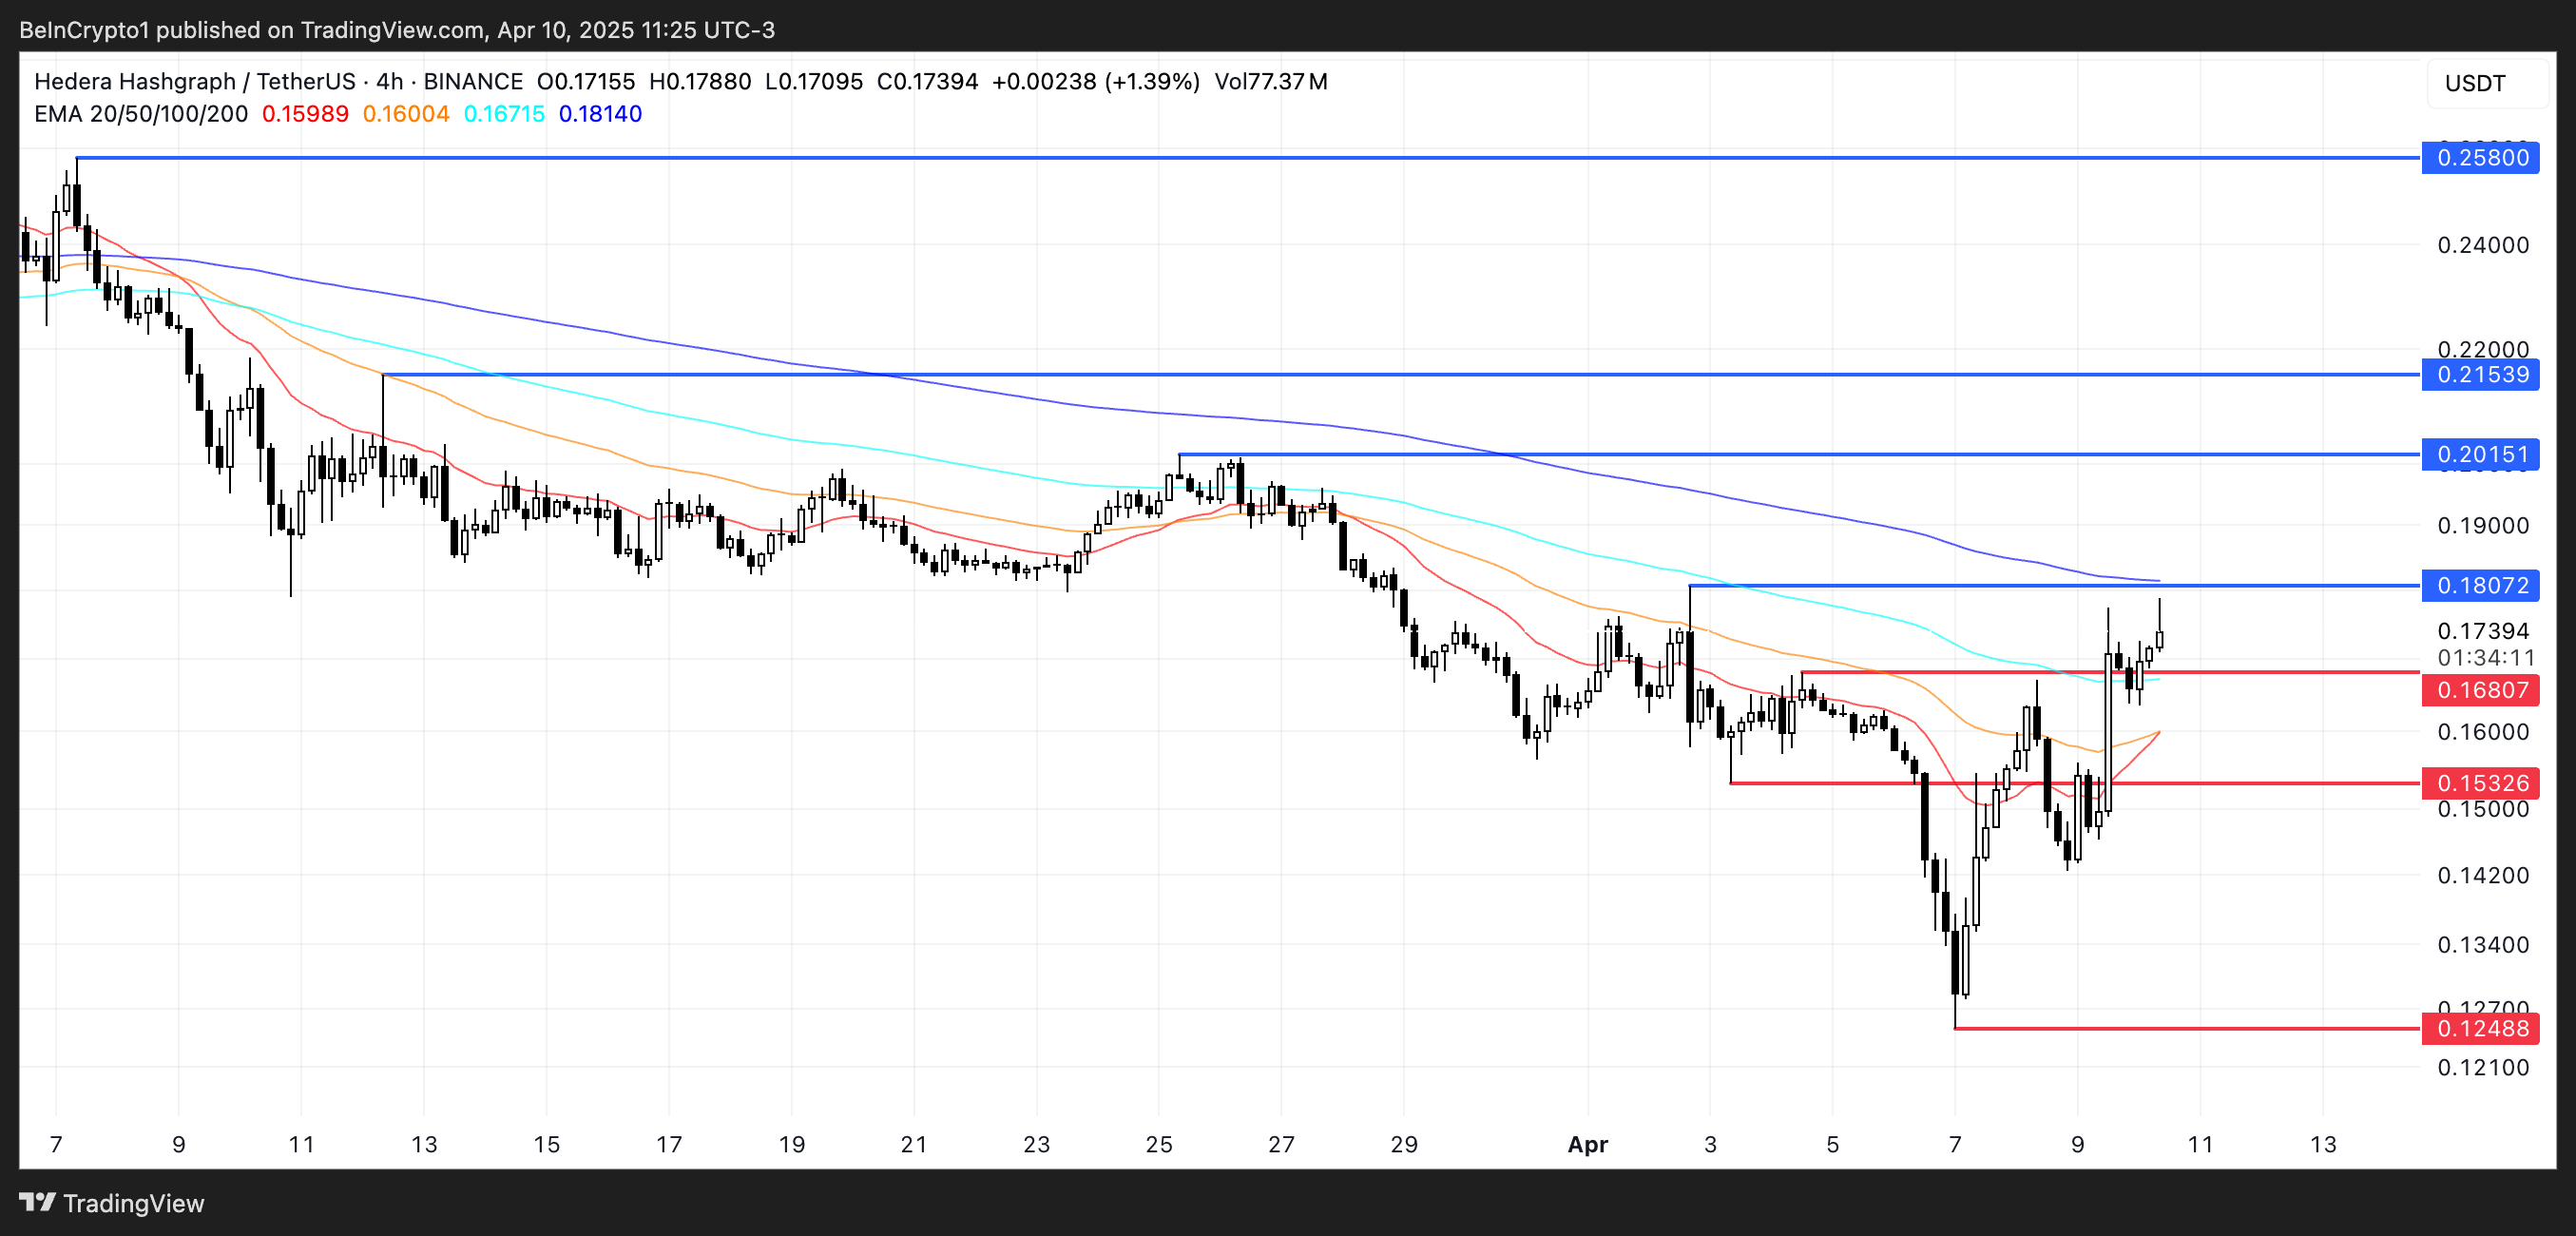
However, this bullish scenario hinges on a successful break above the immediate resistance. If HBAR fails to clear the $0.18 level, it could trigger a pullback toward the support at $0.168.
Losing that support would likely expose Hedera to further downside. The next key levels are $0.153 and possibly below $0.13 if selling pressure intensifies.
Disclaimer
In line with the Trust Project guidelines, this price analysis article is for informational purposes only and should not be considered financial or investment advice. BeInCrypto is committed to accurate, unbiased reporting, but market conditions are subject to change without notice. Always conduct your own research and consult with a professional before making any financial decisions. Please note that our Terms and Conditions, Privacy Policy, and Disclaimers have been updated.

Ethereum Price Climbs, But Key Indicators Still Flash Bearish

ADA Price Surge Signals a Potential Breakout

Bitcoin Holders are More Profitable Than Ethereum Since 2023

Is Donald Trump’s World Liberty Finance Behind The Crash To $1,400?

Hedera (HBAR) Jumps 14%—More Gains Ahead?

3 Bullish Altcoins Surging After Trump’s Tariff Pause

2.52 Million Altcoins Are Ruining Crypto’s Future

Animoca Brands Valuation Tanks 75% In Two Years, Here’s Why

Crypto exchange BingX hacked for $43 million

Are The Big Players Losing Interest?

Hong Kong’s Securities Association Tips Authorities On Crypto Self-Regulation

Coinbase cbBTC Set to go Live on Solana
2.52 Million Altcoins Are Ruining Crypto’s Future
Animoca Brands Valuation Tanks 75% In Two Years, Here’s Why
Crypto exchange BingX hacked for $43 million
Are The Big Players Losing Interest?
Hong Kong’s Securities Association Tips Authorities On Crypto Self-Regulation
Coinbase cbBTC Set to go Live on Solana
-
 Bitcoin22 hours ago
MicroStrategy Bitcoin Dump Rumors Circulate After SEC Filing
-

 Market22 hours ago
XRP Primed for a Comeback as Key Technical Signal Hints at Explosive Move
-

 Market20 hours ago
Solana (SOL) Drops 4% as Selling Pressure Intensifies
-

 Altcoin19 hours ago
Argentina Opens LIBRA Investigation, Top Officials May Be Implicated
-

 Market24 hours ago
FBI Ran Dark Web Money Laundering to Track Crypto Criminals
-

 Market18 hours ago
Bitcoin Rallies After Trump Pauses Tariff—Crypto Markets Cheer the Move
-

 Ethereum23 hours ago
Ethereum Traders Pulling Back? ETH’s Open Interest On Binance Sees Continued Decline
-

 Market23 hours ago
SEC Approves Ethereum ETF Options Trading After Delays