
Market
Why David Sacks Sold His Crypto Holdings Before Taking on the “Crypto Czar” Role

David Sacks, appointed by President Donald Trump as the “Crypto Czar” in late 2024, recently announced that he has sold his entire cryptocurrency portfolio.
Here’s how experts and the crypto community are reacting to this unexpected move.
3 Reasons Why David Sacks Sold His Entire Crypto Portfolio
In a recent tweet on X (formerly Twitter), the Trump administration’s “Crypto Czar” confirmed that he sold all of his personal crypto assets ahead of the administration’s official start in January 2025. Specifically, David Sacks’ cryptocurrency portfolio included Bitcoin (BTC), Ethereum (ETH), and Solana (SOL).
David Sacks’ decision to withdraw from the market is seen as a personal choice. The community had given significant attention to his appointment, expecting him to promote crypto-friendly policies, facilitate the establishment of a national Bitcoin reserve for the US government, and balance investor protection with industry growth.
However, his decision to sell all crypto holdings can be understood through the following three reasons.
The first reason could be avoiding conflicts of interest. By not owning any cryptocurrencies, Sacks ensures there are no conflicts between his personal interests and those of the US government.
Secondly, the move signals neutrality. As the leader of US cryptocurrency-related policies, David Sacks needs to maintain transparency and objectivity. Owning any crypto could raise suspicions of bias whenever he makes decisions impacting the market.
The third reason could be compliance with ethics regulations. Senior US government officials are often required to disclose their assets. In some cases, officials need to divest from sectors directly related to their duties. For Sacks, relinquishing his crypto holdings is a logical step to meet federal ethics standards.
Some X users also suggested that David Sacks still holds a large amount of crypto indirectly through his status as an investor in Bitwise Asset Management.

However, Sacks has responded to this issue, claiming that it is not true.
“This community note is a lie. I had a $74k position in the Bitwise ETF which I sold on January 22. I do not have “large indirect holdings.” I’ll provide an update at the end of the ethics process,” Sacks posted on X.
In summary, David Sacks’ sale of his entire crypto portfolio does not definitively signal a rejection of the industry. It could just be “normal administrative procedure” and does not reflect his negative views on Crypto.
Nevertheless, due to investors’ sensitive psychology, Bitcoin and some altcoin prices have shown noticeable volatility.
Disclaimer
In adherence to the Trust Project guidelines, BeInCrypto is committed to unbiased, transparent reporting. This news article aims to provide accurate, timely information. However, readers are advised to verify facts independently and consult with a professional before making any decisions based on this content. Please note that our Terms and Conditions, Privacy Policy, and Disclaimers have been updated.


Pi Network (PI) has seen a sharp decline of nearly 43% over the past four days after reaching levels close to $3. Despite the recent drop, technical indicators suggest that the downtrend may be losing momentum, with both the DMI and BBTrend showing signs of stabilization.
If bullish pressure returns, PI could attempt to break above key resistance levels, potentially setting the stage for a move toward $3. However, if selling pressure intensifies, PI could fall below $1.50 and test lower ranges.
Pi Network DMI Shows the Downtrend Is Losing Steam
Pi Network’s trend strength has sharply declined, as reflected in its Directional Movement Index (DMI).
The Average Directional Index (ADX), which measures the strength of a trend, dropped from 37.5 yesterday to 16, indicating that the prior downtrend has significantly weakened.
The ADX does not indicate direction but rather the intensity of a trend, with values above 25 suggesting a strong trend and anything below 20 pointing to weak or indecisive price action. With the ADX at 16, PI is currently in a phase where momentum is fading, suggesting that neither buyers nor sellers have firm control.
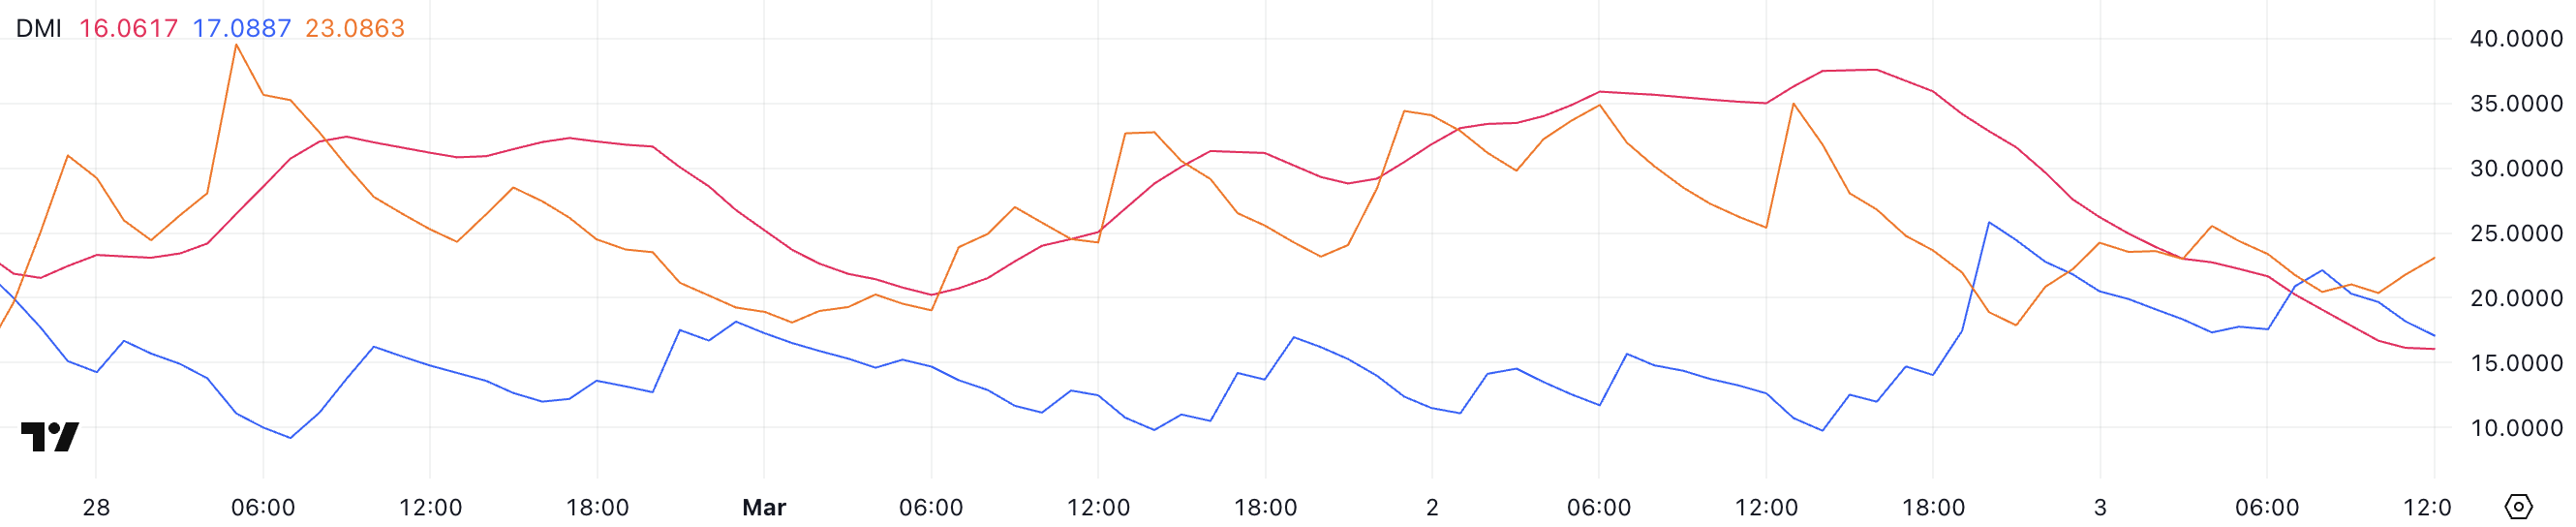
Alongside this, PI’s +DI (positive directional index) has declined from 25.8 to 17, signaling a weakening bullish force. In contrast, the -DI (negative directional index) has risen from 17.8 to 23, reflecting an increase in selling pressure.
This shift indicates that PI is still in a downtrend, though not a particularly strong one, as the ADX suggests low trend strength overall. If -DI continues to rise while ADX stays below 20, PI could remain in a sluggish downtrend rather than a steep decline.
However, if ADX starts climbing again alongside the -DI, selling pressure could intensify, leading to a sharper drop. Conversely, if buyers step in and push +DI back above -DI, PI could stabilize and potentially enter a consolidation phase.
PI BBTrend Is Still Negative, But Recovering From Recent Lows
Pi Network has been in a prolonged downtrend, as indicated by its BBTrend indicator, which has remained negative since February 28.
Yesterday, PI’s BBTrend hit a negative peak of -27.9, signaling intense selling pressure before recovering to its current level of -6.6. The BBTrend, derived from Bollinger Bands, is a volatility-based indicator that helps measure the strength and direction of a trend.
Readings above zero suggest a bullish trend, while negative values indicate bearish momentum. When BBTrend falls below -10, it often signals a heavily oversold condition, while a rise back toward neutral territory suggests a potential slowdown in selling pressure.
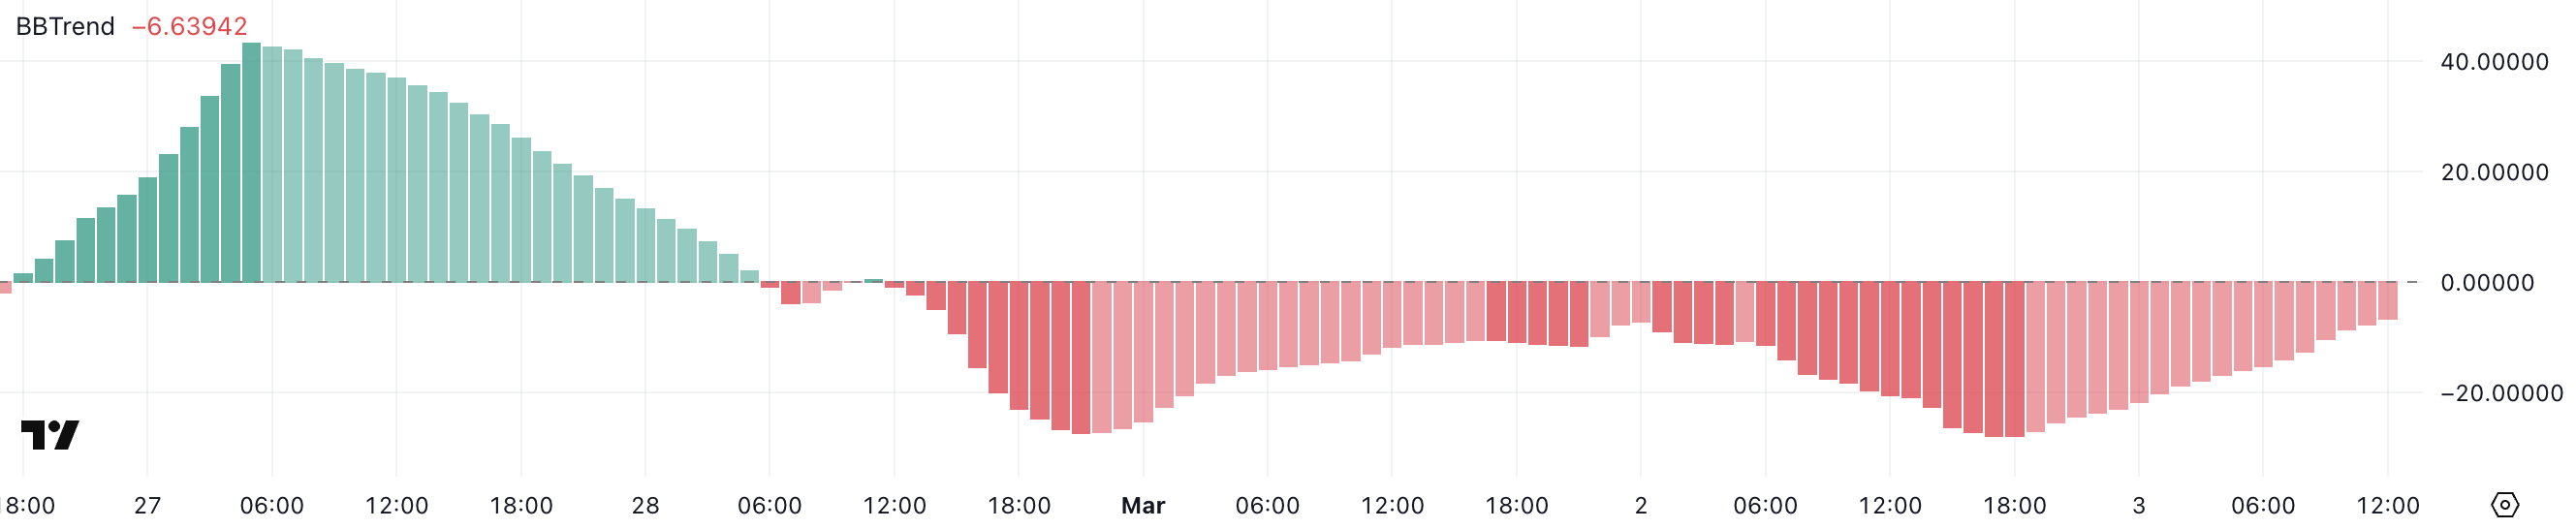
Although PI’s BBTrend is still negative at -6.6, it has improved significantly from yesterday’s extreme low, indicating that selling pressure is easing.
This suggests that the market could be stabilizing, though PI is not yet in bullish territory. If BBTrend continues rising and moves closer to zero, it could indicate a potential trend reversal or at least a period of consolidation before the next move.
However, if BBTrend turns back down and fails to recover, PI could face renewed downside pressure, making it crucial to watch whether the recent improvement sustains or fades.
Pi Network Could Rise To Test $3 In March
Pi Network has dropped nearly 43% over the past four days after reaching levels close to $3, signaling a sharp reversal from its recent highs, with an 18% decline one day ago when Vietnam authorities issued legal warnings.
If the trend shifts back to the upside, the first key resistance to watch is at $1.80. A breakout above this level could indicate renewed buying interest, potentially driving PI toward $2.35.
If bullish momentum strengthens and mirrors the surge from a few days ago, PI could rally further to $2.97, with a chance of breaking above $3 for the first time.
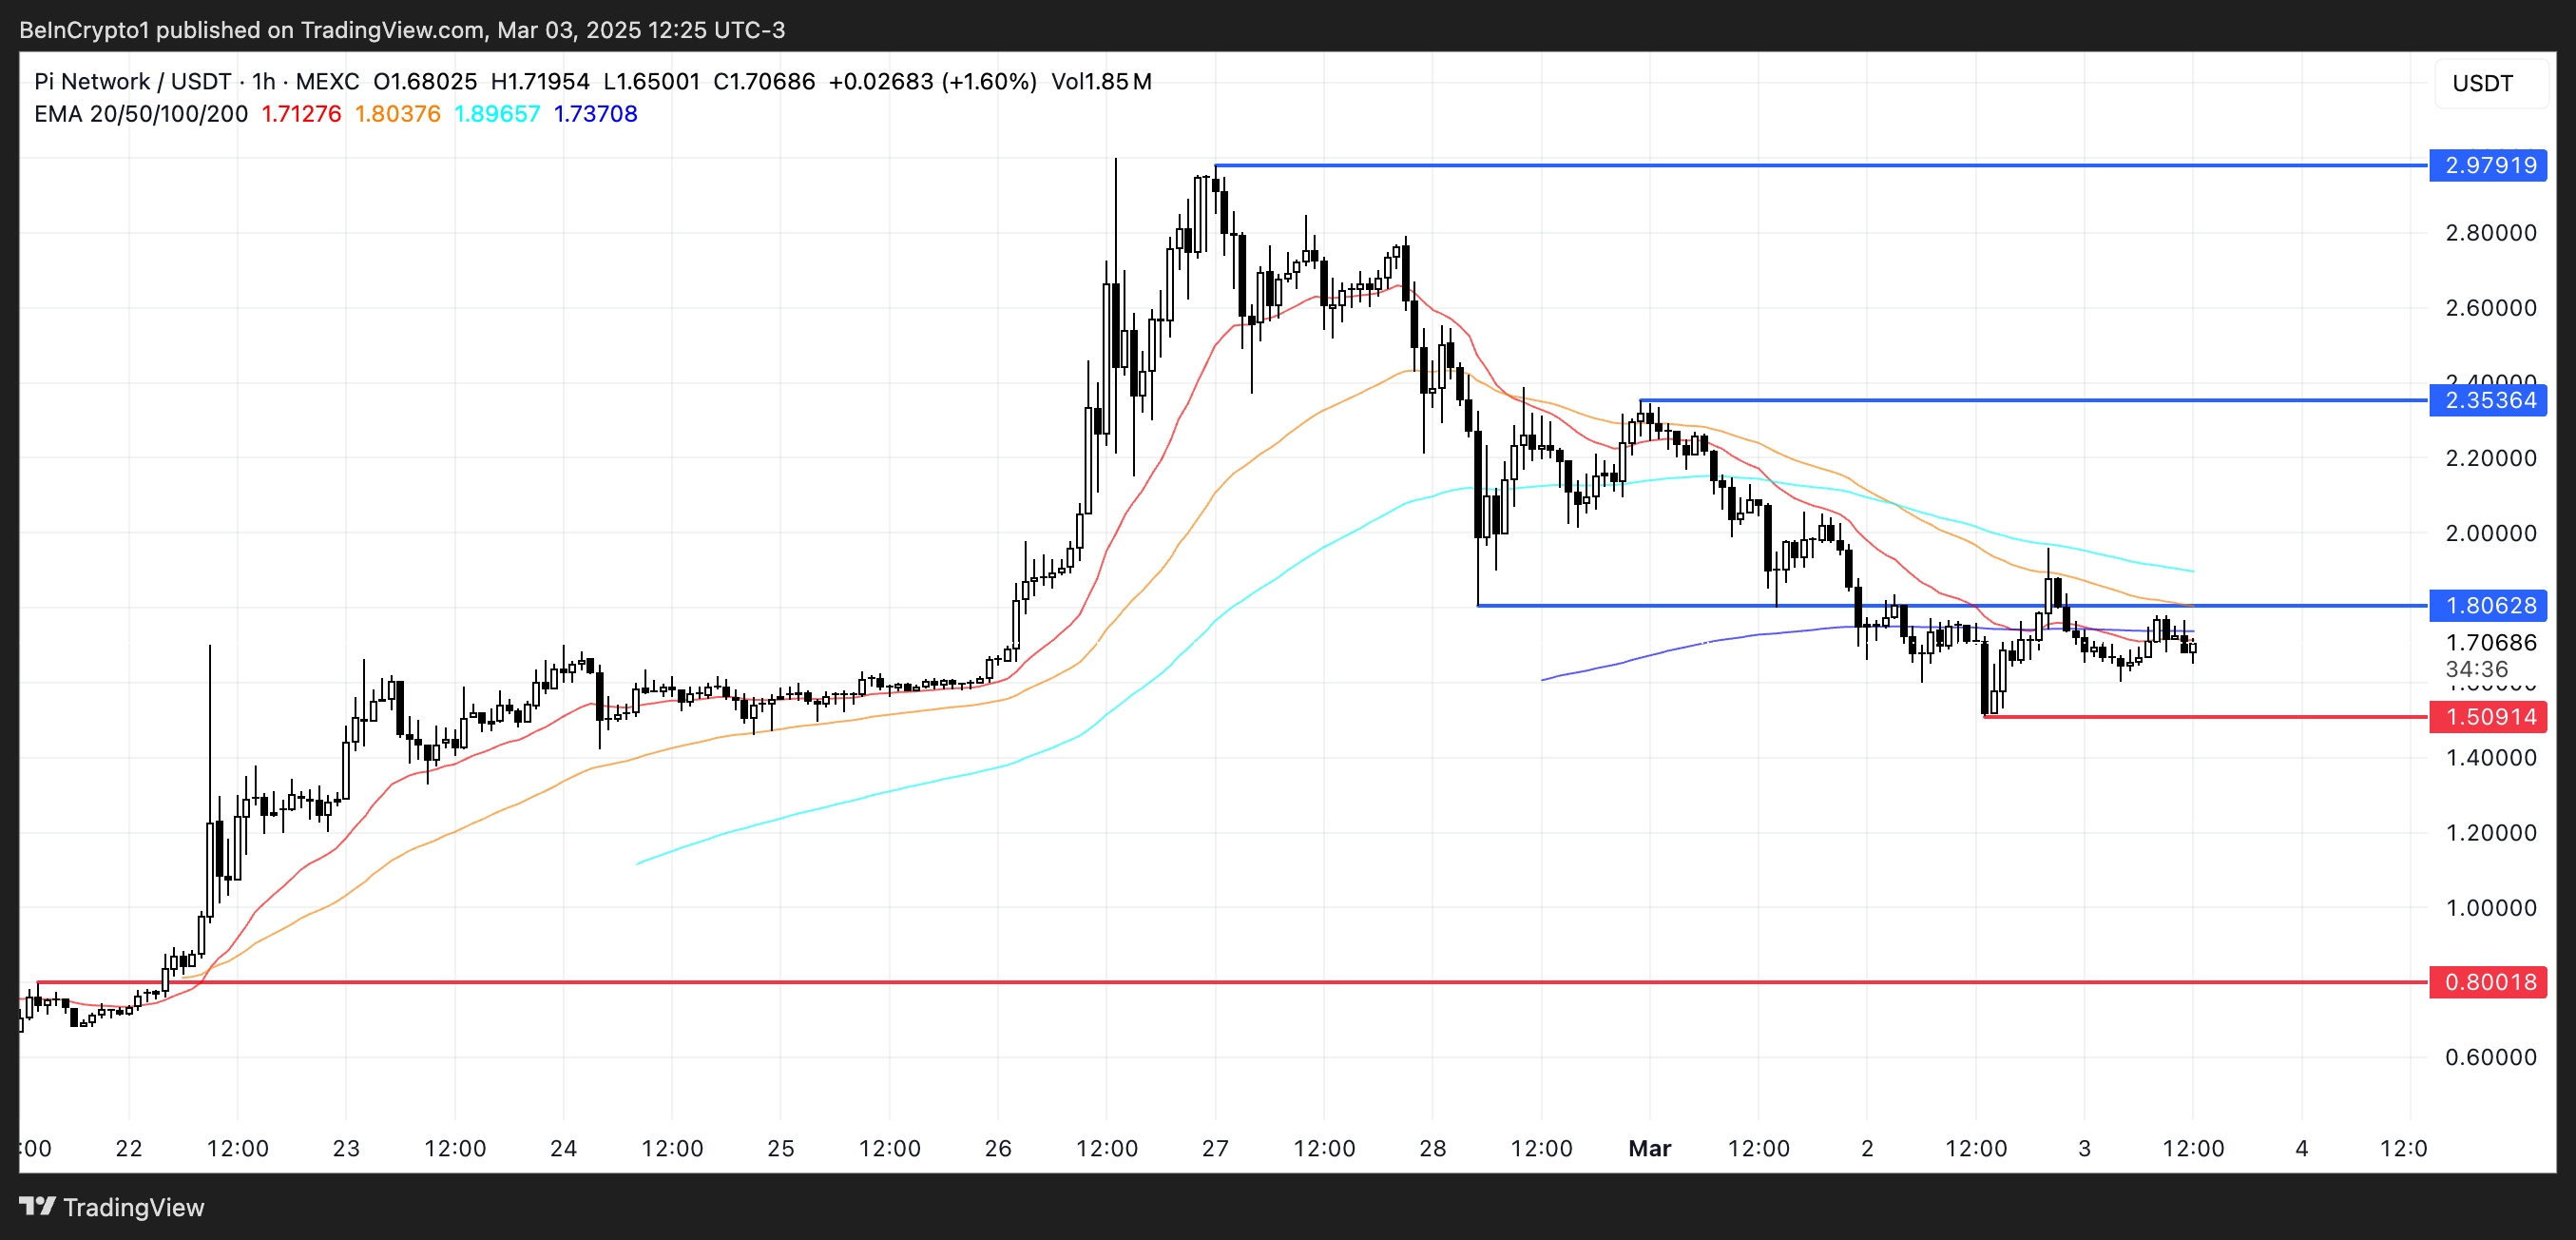
However, this scenario depends on whether buyers step in to regain control and push the price above these resistance levels.
On the downside, if selling pressure intensifies and the downtrend resumes, PI could test the $1.50 support level.
A break below this zone would expose PI to further declines, with $0.80 emerging as the next major support. Such a move would indicate that bearish momentum remains strong, possibly leading to an extended period of downside movement.
Disclaimer
In line with the Trust Project guidelines, this price analysis article is for informational purposes only and should not be considered financial or investment advice. BeInCrypto is committed to accurate, unbiased reporting, but market conditions are subject to change without notice. Always conduct your own research and consult with a professional before making any financial decisions. Please note that our Terms and Conditions, Privacy Policy, and Disclaimers have been updated.


Binance plans to delist Tether’s USDT to EU-based customers to comply with MiCA. European users will still be able to withdraw assets until midnight on March 31.
Most major exchanges delisted USDT as soon as MiCA went through, but sell-only transactions are still grandfathered in until the end of Q1 2025. Circle may have a chance to consolidate its EU market share even further.
Binance Delists Tether Due to MiCA
MiCA, the EU’s comprehensive new stablecoin legislation, is finally getting Coinbase to meet more of its requirements. Before the rollout, the exchange engaged in some proactive compliance, limiting unregulated stablecoins for EU users.
However, MiCA took effect in December, and Binance is only now agreeing to delist Tether’s USDT.
“We are making changes to the availability of non-MiCA compliant Stablecoins in the EEA to comply with regulatory requirements. Impacted assets are USDT, FDUSD, TUSD, USDP, DAI, AEUR, UST, USTC and PAXG. Binance will restrict the availability of Spot trading pairs with non-MiCA Compliant Stablecoins for EEA users,” the firm’s statement claimed.
Tether’s USDT is the world’s largest stablecoin, but MiCA requirements have caused it a lot of hassle. Most exchanges delisted the asset in December, causing a $2 billion drop in USDT’s market cap.
Binance, however, bucked the trend by still Tether products in the EU. It still allows users to sell their tokens, but that functionality is about to go away.
The announcement cites an EU guidance statement published in January. However, most of the prior delistings took place before the deadline, which is March 31st. Binance is pushing the clock as long as possible, and it will delist Tether’s USDT one minute before midnight on that day.
Although Tether claims that MiCA didn’t have a large long-term impact, the firm had made active preparations several months beforehand. At the moment, it’s unclear how much more pain this Binance delisting will cause Tether. If nothing else, it’s not a bullish development.
Meanwhile, it’s clear that Tether’s biggest competitor is set to take advantage of the EU market. Last July, Circle already predicted that its own stablecoin could take some of Tether’s EU market share after MiCA.
In December, it also made overt preparations to seize this new territory and compete with smaller stablecoin issuers like Ripple.
Ultimately, Binance’s delisting choice is another piece of bad news for Tether, which might be in an uncomfortable moment. Already, Coinbase announced it would delist USDT if the US government implemented MiCA-style stablecoin regulations.
The firm has consistently rejected an independent audit of its reserves, which would be an integral part of future compliance.
Disclaimer
In adherence to the Trust Project guidelines, BeInCrypto is committed to unbiased, transparent reporting. This news article aims to provide accurate, timely information. However, readers are advised to verify facts independently and consult with a professional before making any decisions based on this content. Please note that our Terms and Conditions, Privacy Policy, and Disclaimers have been updated.

Cardano (ADA) surged 60% yesterday after Donald Trump announced that ADA would be included in the US crypto reserve, pushing its price above $1.10. This massive rally fueled strong bullish momentum, with key indicators such as BBTrend and DMI confirming the strength of the uptrend.
However, the excitement appears to be fading, as ADA has since corrected below $1, with technical signals suggesting that selling pressure is increasing. As traders assess whether ADA can sustain its gains or enter a deeper retracement, key support and resistance levels will be crucial in determining the next move.
Cardano BBTrend Shows the Selling Pressure Is Getting Stronger
Cardano experienced a strong price surge after being officially included in the US crypto reserve. This sudden increase in demand pushed ADA’s BBTrend indicator from a deeply negative -14.5 to 7.1 within a few hours, signaling a shift in momentum.
The BBTrend, a volatility and trend-following indicator derived from Bollinger Bands, helps traders gauge the strength and direction of price movements.
When the BBTrend crosses above zero, it suggests a bullish trend, while a reading below zero indicates bearish momentum. Extreme values, such as below -10 or above 10, typically signal overextended moves that may soon correct.
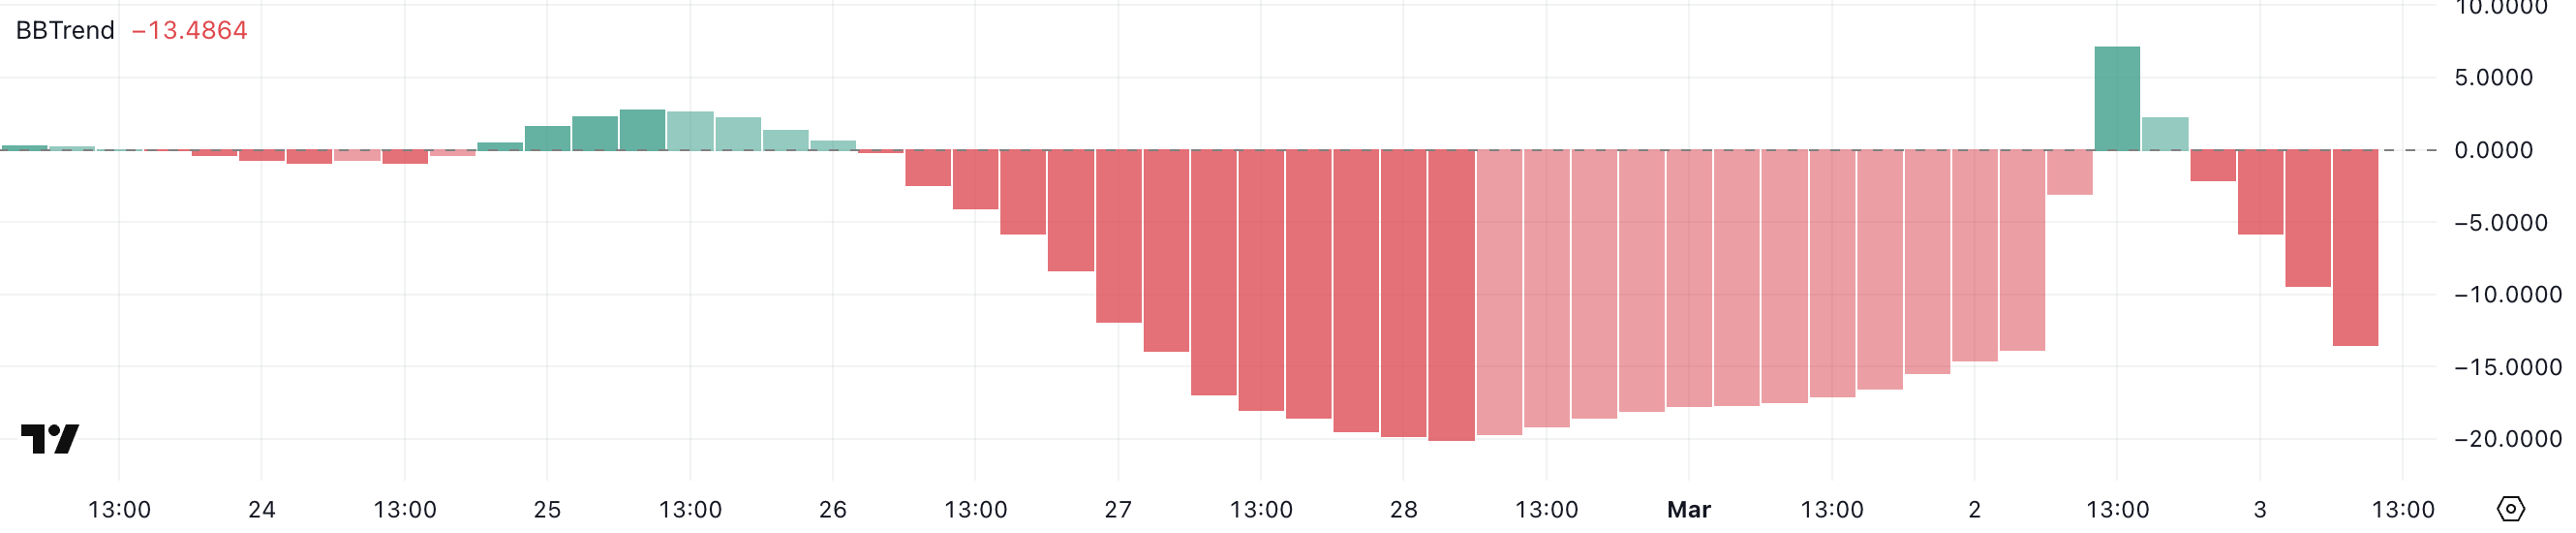
Following its peak at 7.1, ADA’s BBTrend has since reversed, plunging back to -13.4, suggesting that the initial excitement surrounding its inclusion in the US crypto reserve has faded.
Such a rapid decline indicates that bullish momentum has weakened significantly, and ADA could now be facing a period of retracement or consolidation.
A BBTrend reading this low typically aligns with strong selling pressure, which could mean further downside unless fresh buying interest emerges. If ADA fails to hold key support levels, its price may continue to slide, though a reversal in BBTrend back toward neutral territory would indicate stabilization.
ADA DMI Shows That Buyers Are Still In Control
Cardano has seen a significant increase in trend strength, as reflected in its Directional Movement Index (DMI). The Average Directional Index (ADX), which measures the strength of a trend, has surged from 28.3 to 43.7 following the announcement of ADA’s inclusion in the US crypto reserve.
A rising ADX above 25 suggests that a trend is gaining strength, while values above 40 typically indicate a strong and sustained movement, whether bullish or bearish.
The ADX does not indicate trend direction but rather its intensity, making it a key metric for assessing whether a move has the potential to continue or weaken.
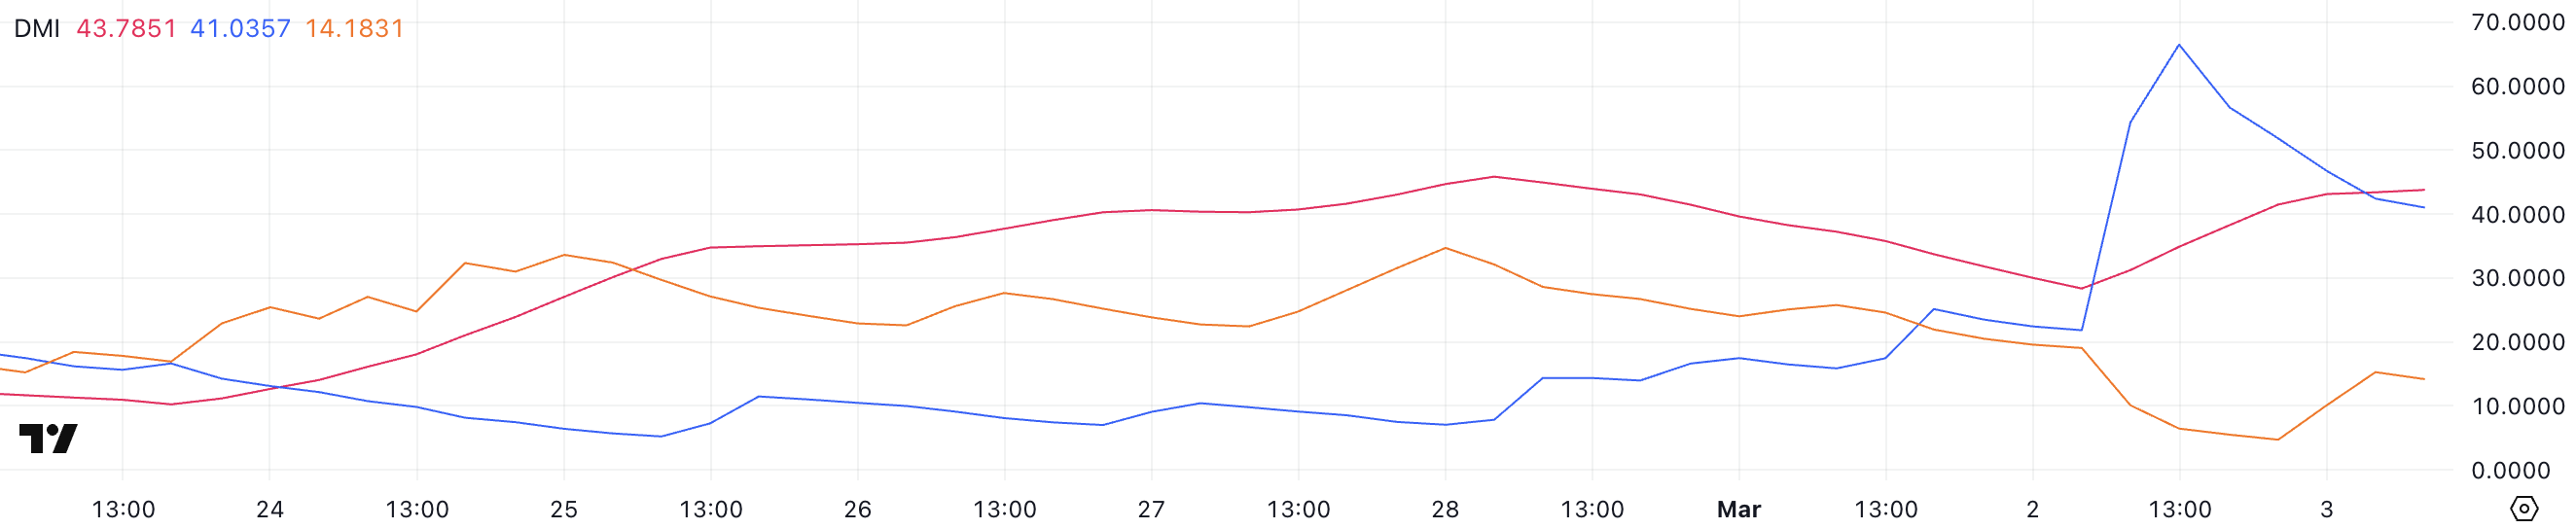
Alongside this, ADA’s +DI (positive directional index) has dropped from its high of 66.5 yesterday to 41, signaling that bullish momentum has cooled off. Meanwhile, the -DI (negative directional index) has climbed from 4.7 to 14.1, showing that sellers are starting to push back.
The combination of a high ADX with a falling +DI and rising -DI suggests that while the trend remains strong, bullish dominance is fading, and selling pressure is increasing. If this trend continues, ADA could face a deeper retracement or a shift toward consolidation unless buyers regain control.
Cardano Could Fall Below $0.80 Soon
Yesterday, Cardano’s price surged by a massive 60% following its inclusion in the US crypto reserve, propelling it above $1.10.
However, a correction has taken place in the last few hours, bringing ADA back to the $1 level as the initial buying frenzy fades.
The technical indicators DMI and BBTrend suggest that the uptrend may be losing momentum, raising the possibility of a deeper retracement. If ADA fails to maintain its current levels and selling pressure intensifies, it could test the $0.90 support level.
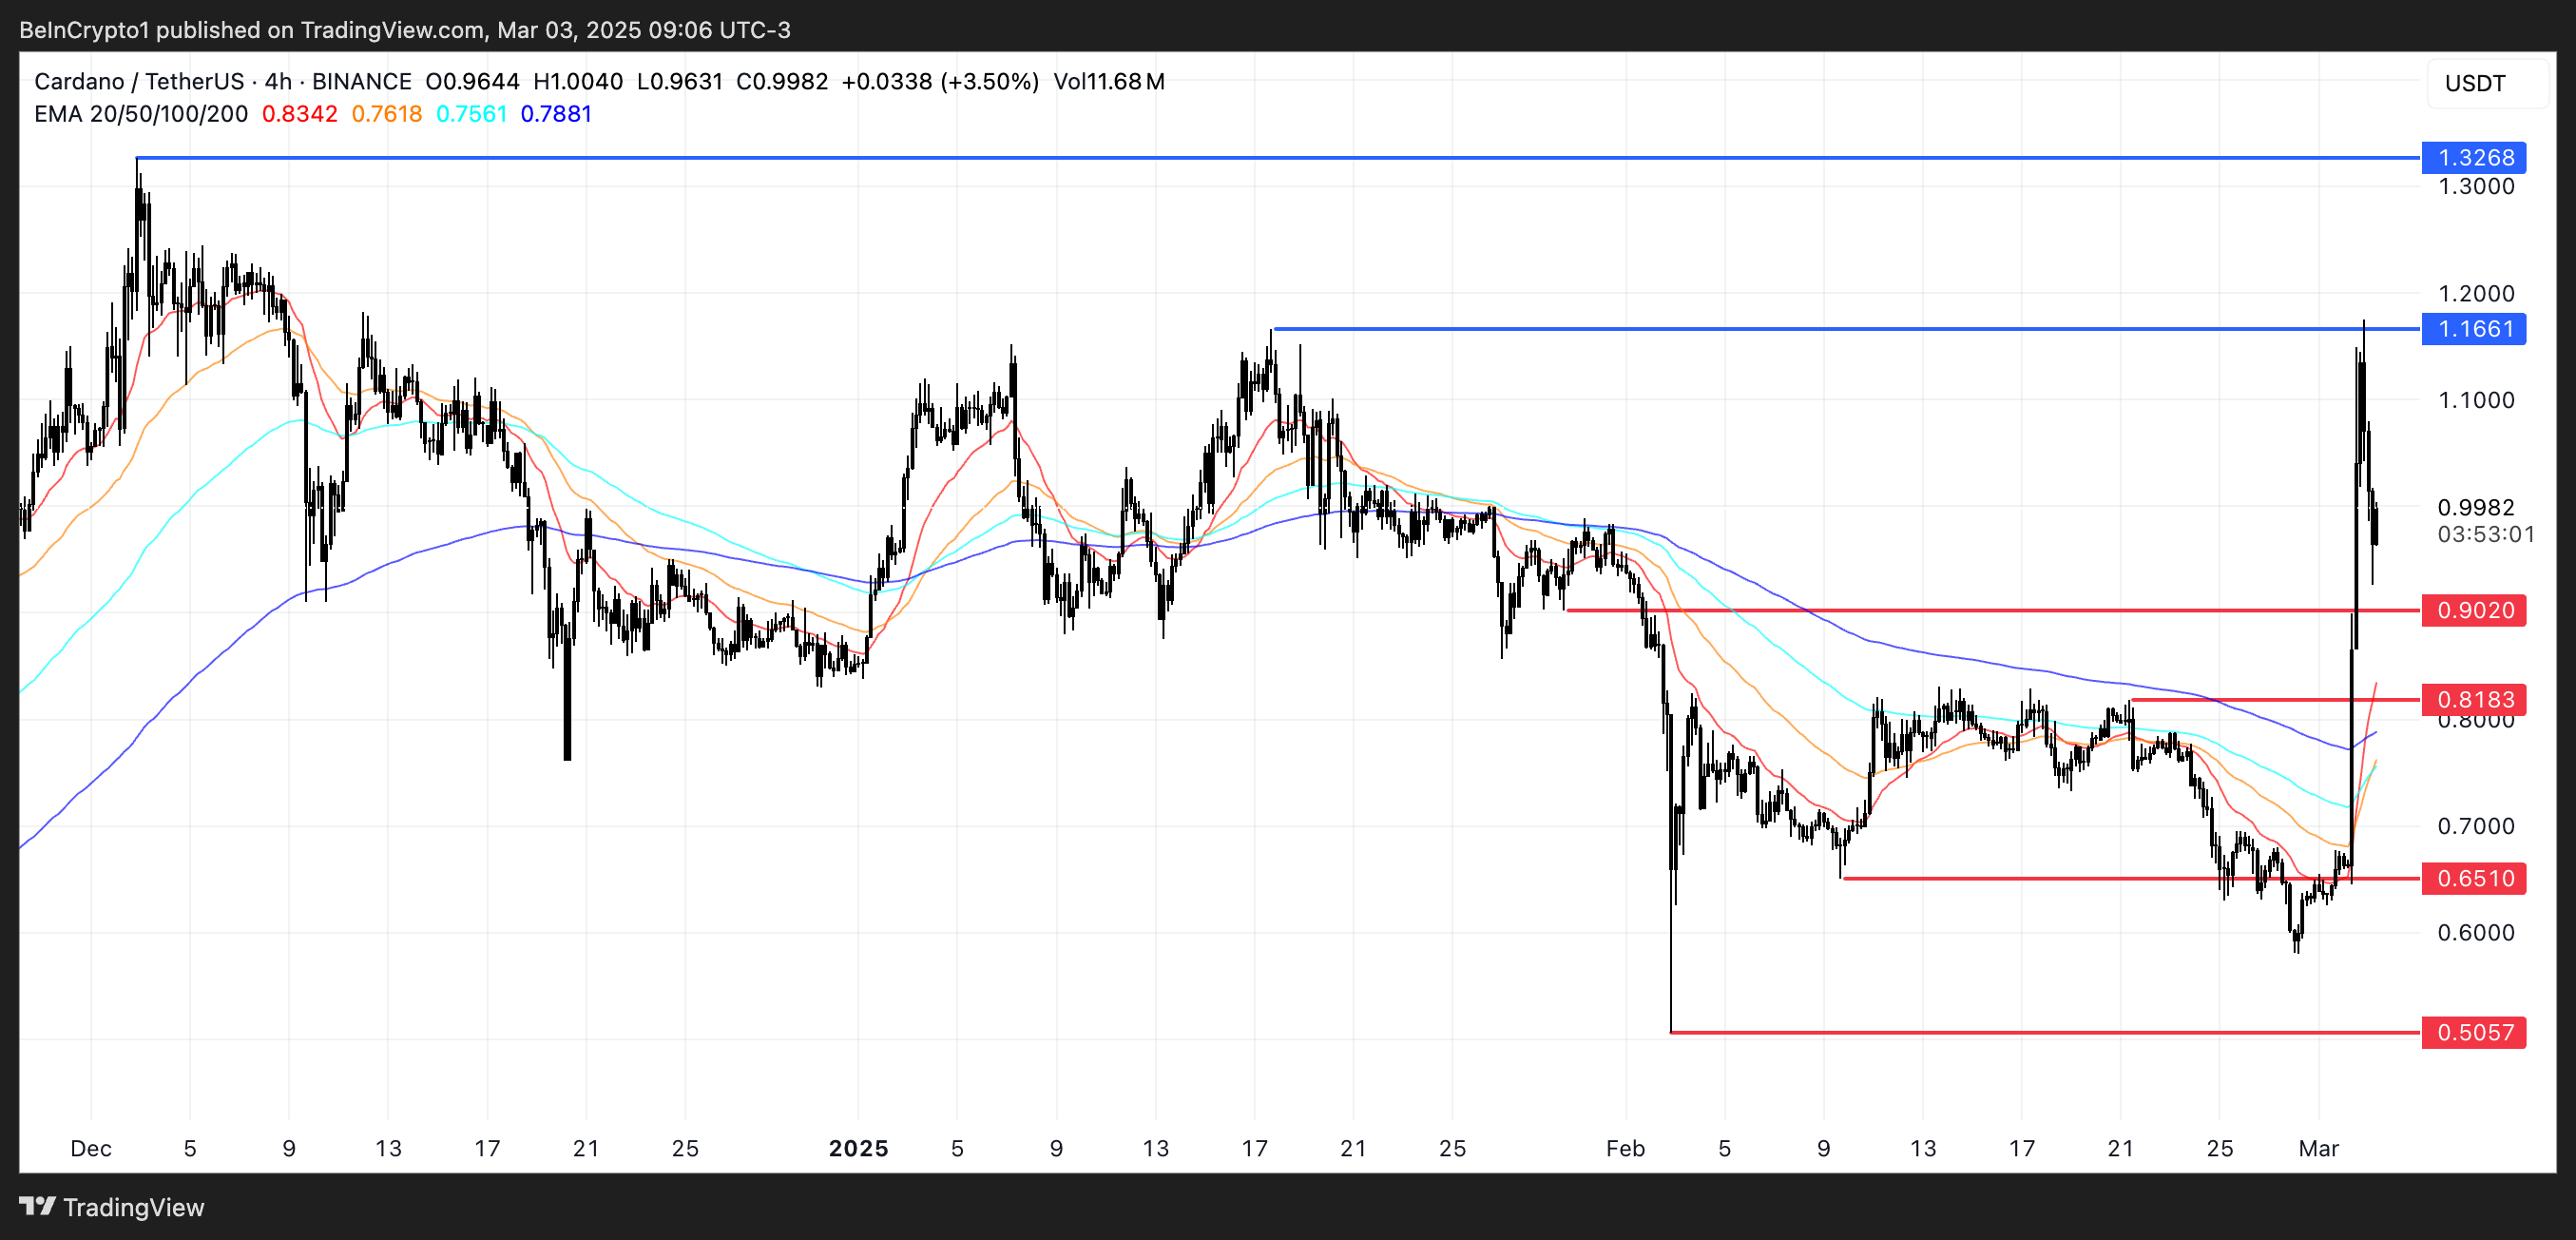
A breakdown below this could open the door for further declines to $0.81 and $0.65, with a strong downtrend potentially driving ADA as low as $0.50.
On the other hand, if bullish momentum reignites, Cardano price could make another push higher, testing the $1.16 resistance level.
A breakout above this zone would indicate renewed strength, potentially driving the price up to $1.32, which would mark its highest level since early December 2024.
Whether ADA sustains its upward trajectory or continues its pullback will depend on how traders react to the recent price surge and whether fresh buying interest can outweigh the emerging selling pressure.
Disclaimer
In line with the Trust Project guidelines, this price analysis article is for informational purposes only and should not be considered financial or investment advice. BeInCrypto is committed to accurate, unbiased reporting, but market conditions are subject to change without notice. Always conduct your own research and consult with a professional before making any financial decisions. Please note that our Terms and Conditions, Privacy Policy, and Disclaimers have been updated.

Pi Network Price Drops 43%

US SEC Commissioner Hester Pierce Unveils Crypto Task Force Members

Solana Price Selloff Ahead as FTX Estate Receives $430M SOL?

Binance to Delist Tether’s USDT to Meet MiCA Compliance
Bitcoin Drops 10% As Fed Warns of Covid-Level Recession
XRP Price Forms Triangle Pattern As Bulls Target $3 Breakout

2.52 Million Altcoins Are Ruining Crypto’s Future

Animoca Brands Valuation Tanks 75% In Two Years, Here’s Why

Crypto exchange BingX hacked for $43 million

Are The Big Players Losing Interest?

Hong Kong’s Securities Association Tips Authorities On Crypto Self-Regulation

Coinbase cbBTC Set to go Live on Solana
2.52 Million Altcoins Are Ruining Crypto’s Future
Animoca Brands Valuation Tanks 75% In Two Years, Here’s Why
Crypto exchange BingX hacked for $43 million
Are The Big Players Losing Interest?
Hong Kong’s Securities Association Tips Authorities On Crypto Self-Regulation
Coinbase cbBTC Set to go Live on Solana
-

 Market20 hours ago
Ethereum Price Breaks Out—10% Surge Sparks Bullish Momentum
-

 Altcoin18 hours ago
BTC & Altcoins Pump Hard Amid Trump’s Crypto Reserve Backing
-

 Market19 hours ago
XRP Price Explodes 30%—Can The Momentum Continue?
-

 Bitcoin18 hours ago
Trump’s US Crypto Reserve: Why Experts Are Divided
-
 Market16 hours ago
Why Traders Might Get It Wrong
-
 Altcoin16 hours ago
Pepe Coin Whale Shifts Focus To This Crypto; Sells 262B PEPE
-
 Altcoin23 hours ago
Lawyer Reveals Likely Reason For Delay In Settling Ripple SEC Case
-

 Market17 hours ago
Cardano (ADA) Rockets Over 60%, Crushing Bears in a Stunning Rally!