
Ethereum
Ethereum Retraces To Critical Monthly Demand Level – Can ETH Hold Selling Pressure?

Ethereum has experienced a massive drop, losing over 27% of its value in less than five days as the market faces extreme fear and uncertainty. The rapid sell-off has fueled speculation that a bear market could be on the horizon, with many analysts calling for further downside in the coming months.
Related Reading
However, despite the overwhelming bearish sentiment, there is still a chance for Ethereum to recover as the price is now testing a crucial demand level. If bulls manage to hold this area, ETH could stage a strong rebound and shift momentum back in favor of buyers.
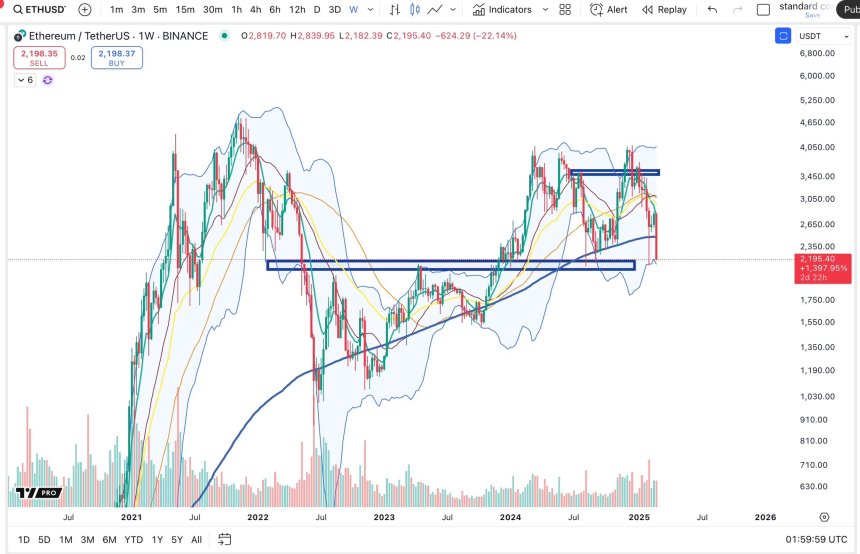
Top analyst BigCheds shared a technical analysis on X, noting that ETH is reapproaching a critical monthly demand level, which could define Ethereum’s next major move. Historically, price reactions at this level have led to either a strong bounce or further capitulation, making the current market conditions a pivotal moment for Ethereum’s long-term trajectory.
The next few days will be crucial as Ethereum attempts to stabilize and reclaim key price levels. If buyers step in aggressively, ETH could start a recovery rally, but failure to hold support may lead to further downside risks.
Ethereum Struggles Below $2,200
Ethereum is trading below $2,200, struggling to regain momentum after a severe market-wide correction. The altcoin sector continues to bleed, and ETH has now lost nearly 50% of its value since peaking at $4,100 in mid-December. Bulls face a critical test as they must defend key demand levels to prevent further selling pressure and attract strong buying interest.
Related Reading
The situation is highly volatile, with market sentiment shifting toward extreme fear. Investors worry that Ethereum could continue its decline if bulls fail to hold support and initiate a meaningful recovery. Many analysts remain cautious, warning that ETH could enter a prolonged consolidation phase if it fails to regain lost ground.
BigChed’s insights on X highlight that Ethereum is now re-approaching a key high-timeframe demand zone of around $2,000. According to Cheds, this is a must-hold level—losing this zone could trigger a deeper correction, while a strong defense could pave the way for a potential recovery rally.
The next few days will be crucial for Ethereum. If bulls manage to reclaim $2,200 and push toward $2,500, a reversal could take place. However, failure to hold $2,000 could see ETH drop further, potentially testing lower demand zones in the coming weeks.
Price Testing Demand – Can Bulls Regain Control?
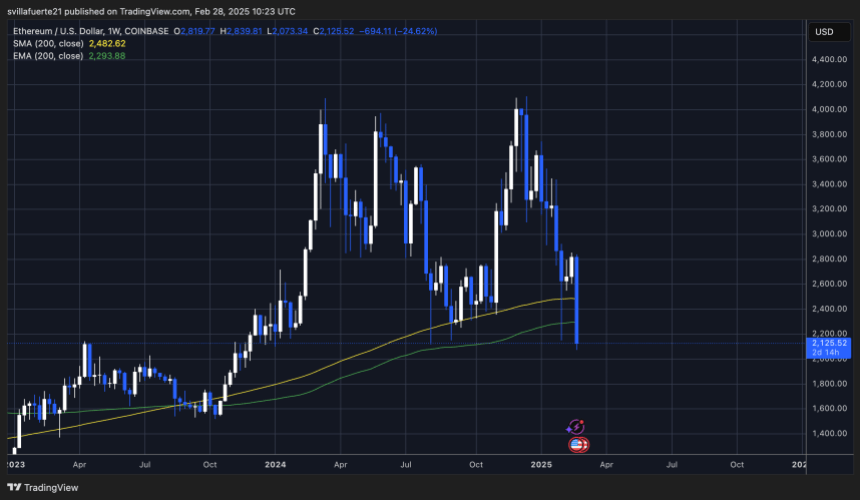
Ethereum is trading at $2,120 after enduring days of massive selling pressure that pushed the price to its lowest level in months. ETH is currently holding above a high-timeframe demand level around $2,000, a crucial zone that must be defended to avoid further downside. However, sentiment remains fragile, and if Ethereum fails to hold this level, it could trigger a dramatic sell-off leading to even lower prices.
Bulls face an urgent challenge to regain control of price action. The $2,200 level now acts as the first key resistance, and a breakout above this mark would be the first step toward stabilization. Beyond that, ETH must push above $2,500 as soon as possible to confirm a potential trend reversal and signal the start of a recovery rally.
Related Reading
If bulls fail to hold the $2,000 support, Ethereum could face increased volatility and a steep decline, potentially testing lower demand zones. The next few trading sessions will be critical, as ETH’s ability to stay above key levels will determine whether the market stabilizes or enters a deeper correction phase in the coming weeks.
Featured image from Dall-E, chart from TradingView


Ethereum co-founder Vitalik Buterin has again made the news with a big donation to a Swiss project called Zuitzerland. Isla, a Web3 researcher developing the project, received the 274 ETH, equivalent to around $500,000, from Buterin, according to reports. The donation was identified by Onchain Lens, a blockchain monitoring site that tracks fund transfers.
This step is not surprising to anyone who has known about Buterin’s charitable activities and experimental associations. Zuitzerland is said to be a product of Buterin’s previous Zuzalu experiment, whose purpose was to unite like-minded people and engage into proposals on technology, longevity, and decentralized regimes.
Ethereum Donation: What Is Zuitzerland?
The Zuitzerland initiative is based on the ideas launched in the Zuzalu experiment, a short-term community project initiated by Buterin between March and May 2023, in Montenegro. Zuzalu assembled about 200 participants who worked and lived together for two months. They exchanged ideas and teamed up on projects together in workshops, discussions, and social gatherings.
Just in: Vitalik (@VitalikButerin) has sent 274.1 $ETH ($500k), as a grant or donation to a contract deployed by @0xisla, who is building @zuitzerland.
Vitalik’s Address: 0xd8da6bf26964af9d7eed9e03e53415d37aa96045
Contract Address: 0x69649512c97c630c4f06a21e09e71f0362ca74ec… pic.twitter.com/NusZDSp7tn
— Onchain Lens (@OnchainLens) April 1, 2025
Zuitzerland pushes this concept further by hosting residencies, hackathons, and citywide events for those with common interests. The platform emphasizes the development of collaboration between “thinkers and builders.” Although Buterin is not among the founders of the project, he is mentioned as a speaker and curator on its official site, indicating his support and engagement.

Funding Through Token Sales
Buterin’s contribution was partly financed by selling tokens he had earlier received as gifts from other crypto projects. According to on-chain statistics, Buterin sold 5,000 Dohrnii (DHN) tokens for $93,882 and 2 trillion LEDOG (DOG) tokens for $16,569 on March 31, 2025. The proceeds from these sales were aggregated and then sent as 274 ETH to Isla.
ETHUSD trading at $1,873 on the daily chart: TradingView.com
This is not the first time that Buterin has sold tokens gifted to him for a cause. In 2022, he sold some Shiba Inu (SHIB) tokens gifted to him in order to donate to an Indian COVID-19 relief fund. Buterin has also publicly urged token issuers to give directly to charities instead of donating tokens to him.
A History Of Token Donations
Dohrnii Labs, the developers of the DHN token, had sent 10,000 tokens to Buterin in January 2025. Likewise, LEDOG’s developers sent 10 trillion DOG tokens to him in August 2024. Although these tokens are usually given as a token of appreciation, they are also a marketing strategy for visibility. Buterin has been selling these tokens gradually over time, using the funds for donations and other things.
As of now, Buterin still retains 2 trillion DOG tokens, as per data on the blockchain. Nevertheless, his actions reveal a distinct orientation towards leveraging such assets to help initiatives such as Zuitzerland, which align with his belief in decentralized governance and innovation led by community.
Featured image from Gemini Imagen, chart from TradingView
Editorial Process for bitcoinist is centered on delivering thoroughly researched, accurate, and unbiased content. We uphold strict sourcing standards, and each page undergoes diligent review by our team of top technology experts and seasoned editors. This process ensures the integrity, relevance, and value of our content for our readers.

Reason to trust
![]()
Strict editorial policy that focuses on accuracy, relevance, and impartiality
Created by industry experts and meticulously reviewed
The highest standards in reporting and publishing
Strict editorial policy that focuses on accuracy, relevance, and impartiality
Morbi pretium leo et nisl aliquam mollis. Quisque arcu lorem, ultricies quis pellentesque nec, ullamcorper eu odio.
As Ethereum (ETH) continues to experience a significant price downturn, recording a 17% drop over the past month, key resistance levels have emerged as critical points for the second-largest cryptocurrency. Analysts suggest that these levels could ignite a potential trend reversal if reclaimed.
Ethereum Faces Potential Decline To $1,155
In a recent update shared on social media platform X (formerly Twitter), crypto analyst Ali Martinez highlighted two pivotal price points for Ethereum’s immediate future.
The first, set at $2,100, is seen as a necessary threshold for initiating a new upward trend. However, the $2,300 mark is regarded as a “more decisive” level that Ethereum must breach to confirm a bullish reversal.
Related Reading
Martinez’s analysis, based on the one-day chart seen below, indicates that if Ethereum fails to reclaim these levels, it may lead to a further decline.

The next target points to watch would be $1,600 and $1,155, levels that could indicate a new downtrend. Such a decline would represent additional losses of 12% and over 37%, respectively, marking a troubling continuation of Ethereum’s worst first quarter in its history.
In another post, the analyst also pointed out that the Ethereum price is facing a significant resistance wall between $2,200 and $2,580. On-chain data from the analytics firm IntoTheBlock reveals that approximately 12.43 million investors have bought about 66.18 million ETH within this price range.
A breakout above these levels could potentially generate bullish momentum for the cryptocurrency. However, bullish catalysts that could trigger a move above these levels remain scarce among experts.
ETH’s Largest Accumulation Zone Under Threat
Market intelligence firm Glassnode has indicated that ETH’s Cost Basis Distribution shows limited support near current prices. Weekly data suggests that addresses with a cost basis around $1,800 have not re-engaged. Many investors are reportedly selling at a loss, further adding to the current price uncertainty.
On March 28, several clusters of approximately 250,000 ETH with cost bases between $2,000 and $2,050 effectively vanished, indicating that some higher-cost holders are attempting to average down their positions.
However, Glassnode asserts that the overall Ethereum accumulation zone appears limited at current price levels, raising questions about future stabilization for the second largest cryptocurrency.
Related Reading
The largest accumulation zone below the current market price now sits at $1,537, where nearly 994,000 ETH was acquired. If the downtrend continues, this level is expected to serve as structural support in the near term, potentially providing a buffer against further declines.
ETH is currently trading at $1,830, down 12% for the week.
Featured image from DALL-E, chart from TradingView.com

A quant has revealed how Ethereum (ETH) saw a death cross in this indicator shortly before bearish momentum took the asset in full force.
Ethereum Formed A Death Cross In Funding Rates Earlier
In a CryptoQuant Quicktake post, an analyst has shared a chart for the Funding Rates of Ethereum. The “Funding Rates” refers to a metric that keeps track of the amount of periodic fee that traders on the derivatives market are exchanging between each other right now.
When the value of this indicator is positive, it means the long contract holders are paying a premium to the short investors in order to hold onto their positions. Such a trend suggests a bullish sentiment is shared by the majority of the derivatives traders.
On the other hand, the metric being under the zero mark implies a bearish mentality is dominant in the sector, as short holders are overwhelming the long ones.
Now, here is the chart for the Ethereum Funding Rates posted by the quant, which shows the trend in the 50-day and 200-day simple moving averages (SMAs) of the indicator over the last couple of years:

Looks like these two lines saw a crossover earlier in the year | Source: CryptoQuant
As displayed in the above graph, the 50-day SMA of the Ethereum Funding Rates crossed under the 200-day SMA in January of this year. This suggests that the optimism in the market witnessed a shift.
From the graph, it’s visible that since the crossover in the two SMAs of the indicator has emerged, the ETH price has been sharply moving down. The trend isn’t unique to the asset, as the wider cryptocurrency sector has also seen a similar pattern, with investors becoming risk-averse.
In the first half of last year, the Funding Rates observed the same type of crossover, and then, the Ethereum price followed up with a period of bearish action.
It wasn’t until the reverse crossover happened, with the 50-day SMA finding a break above the 200-day SMA, that bullish momentum returned in the cryptocurrency market. The same pattern was also seen back in 2023.
It’s possible that for constructive price action to return for Ethereum and other assets, a bullish crossover in the Funding Rates may once again have to take place. “When the speculators return and start using their greedy leverage, the crypto bull market will begin,” notes the analyst.
When this would happen, however, is anyone’s guess, as the 50-day and 200-day SMAs of the indicator are currently quite far apart. In 2024, the lines took many months before they crossed back, so it’s possible that it will take some time for the crossover to occur now as well.
ETH Price
Ethereum is moving to end the month of March on a red note as its price has fallen to the $1,800 level, after seeing a decline of almost 14% in the past week.
The trend in the ETH price over the last five days | Source: ETHUSDT on TradingView
Featured image from Dall-E, CryptoQuant.com, chart from TradingView.com
Editorial Process for bitcoinist is centered on delivering thoroughly researched, accurate, and unbiased content. We uphold strict sourcing standards, and each page undergoes diligent review by our team of top technology experts and seasoned editors. This process ensures the integrity, relevance, and value of our content for our readers.

Hill Rejects Interest-Bearing Stablecoins Despite Armstrong’s Wish

How Did UPCX Lose $70 Million in a UPC Hack?

Ethereum Struggles to Break Out as Bear Trend Fades

XRP Price to $27? Expert Predicts Exact Timeline for the Next Massive Surge

Binance Megadrop Launches KernelDAO
Wintermute Sells ACT Tokens Due To Binance Limit Changes

2.52 Million Altcoins Are Ruining Crypto’s Future

Animoca Brands Valuation Tanks 75% In Two Years, Here’s Why

Crypto exchange BingX hacked for $43 million

Are The Big Players Losing Interest?

Hong Kong’s Securities Association Tips Authorities On Crypto Self-Regulation

Coinbase cbBTC Set to go Live on Solana
2.52 Million Altcoins Are Ruining Crypto’s Future
Animoca Brands Valuation Tanks 75% In Two Years, Here’s Why
Crypto exchange BingX hacked for $43 million
Are The Big Players Losing Interest?
Hong Kong’s Securities Association Tips Authorities On Crypto Self-Regulation
Coinbase cbBTC Set to go Live on Solana
-

 Market23 hours ago
Coinbase Tries to Resume Lawsuit Against the FDIC
-
 Altcoin23 hours ago
Charles Hoskinson Reveals How Cardano Will Boost Bitcoin’s Adoption
-

 Market22 hours ago
Hedera (HBAR) Bears Dominate, HBAR Eyes Key $0.15 Level
-

 Market24 hours ago
BlackRock’s Larry Fink Thinks Crypto Could Harm The Dollar
-

 Altcoin24 hours ago
Ethereum Bitcoin Ratio Drops to Record Low, What Next for ETH?
-

 Market21 hours ago
This is Why PumpSwap Brings Pump.fun To the Next Level
-

 Market20 hours ago
Cardano (ADA) Whales Hit 2-Year Low as Key Support Retested
-
 Altcoin15 hours ago
A Make or Break Situation As Ripple Crypto Flirts Around $2