
Market
The Altcoins Trending Today—ONDO, TIA, and KAITO

As the broader crypto market continues its decline today, some altcoins have stood out, gaining attraction from traders and investors alike.
Among today’s trending assets are Ondo (ONDO), Celestia (TIA), and KAITO (KAITO), each of which has defied the broader downturn with sizable gains.
Ondo (ONDO)
The Real-world asset (RWA) token ONDO is one of today’s most searched assets. It currently trades at $0.98, with a 2% price uptick in the past 24 hours.
Following an extended period of decline, readings from ONDO’s Relative Strength Index (RSI) suggest that the altcoin might be poised for a bullish rebound. At press time, this momentum indicator is in a downtrend at 31.70.
An asset’s RSI measures its overbought and oversold market conditions. It ranges between 0 and 100, with values above 70 indicating that the asset is overbought and due for a decline.
On the other hand, values under 30 indicate that the asset is oversold and may witness a rebound. At 31.70, ONDO’s RSI signals that the token is nearly oversold and could experience a positive price correction if new demand enters the market.
ONDO’s price could climb above $1 to trade at $1.23 in this case.
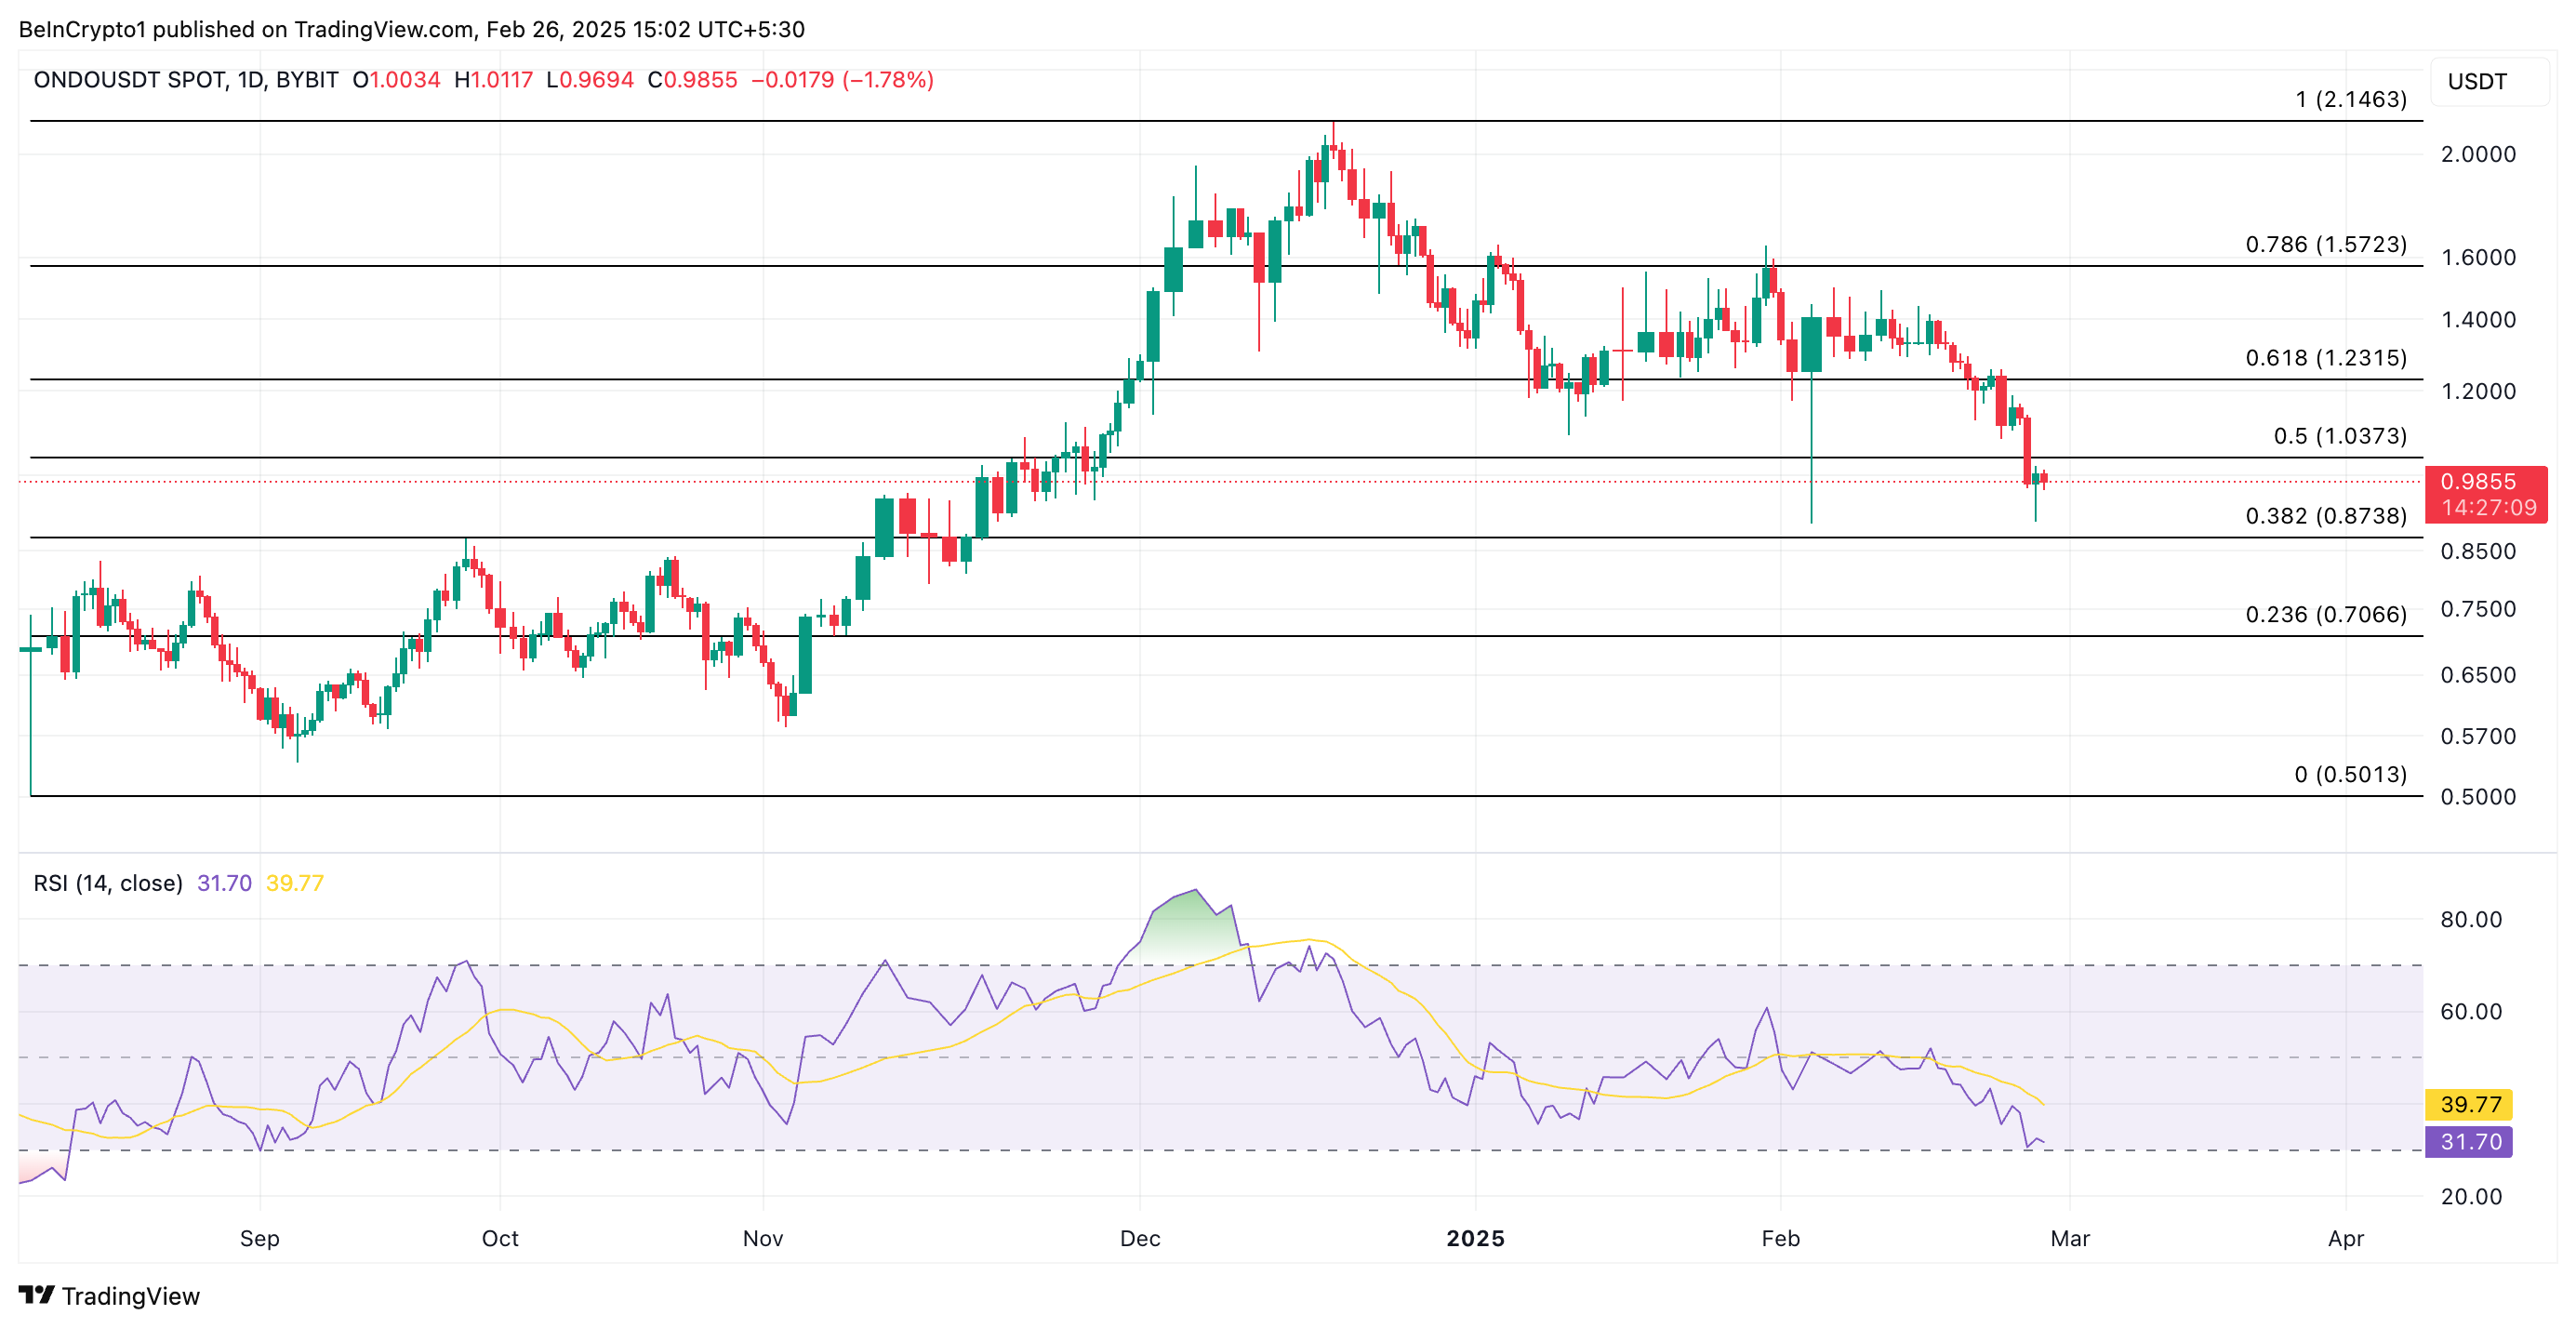
However, ONDO’s price could fall to $0.87 if the decline continues.
Celestia (TIA)
TIA, the native coin of the modular blockchain network Celestia, is another altcoin trending today. It has also bucked the broader market downturn to record 21% gains over the past 24 hours.
Its positive Balance of Power (BoP) reflects the high demand for the altcoin among spot market participants. As of this writing, it is at 0.70.
An asset’s BoP compares the strength of its buyers and sellers by analyzing price movements within a given period. When its value is positive, it indicates that buyers are dominating the market, signaling strong bullish momentum and potential for further price gains.
If TIA maintains its rally, its price could reach $6.78.
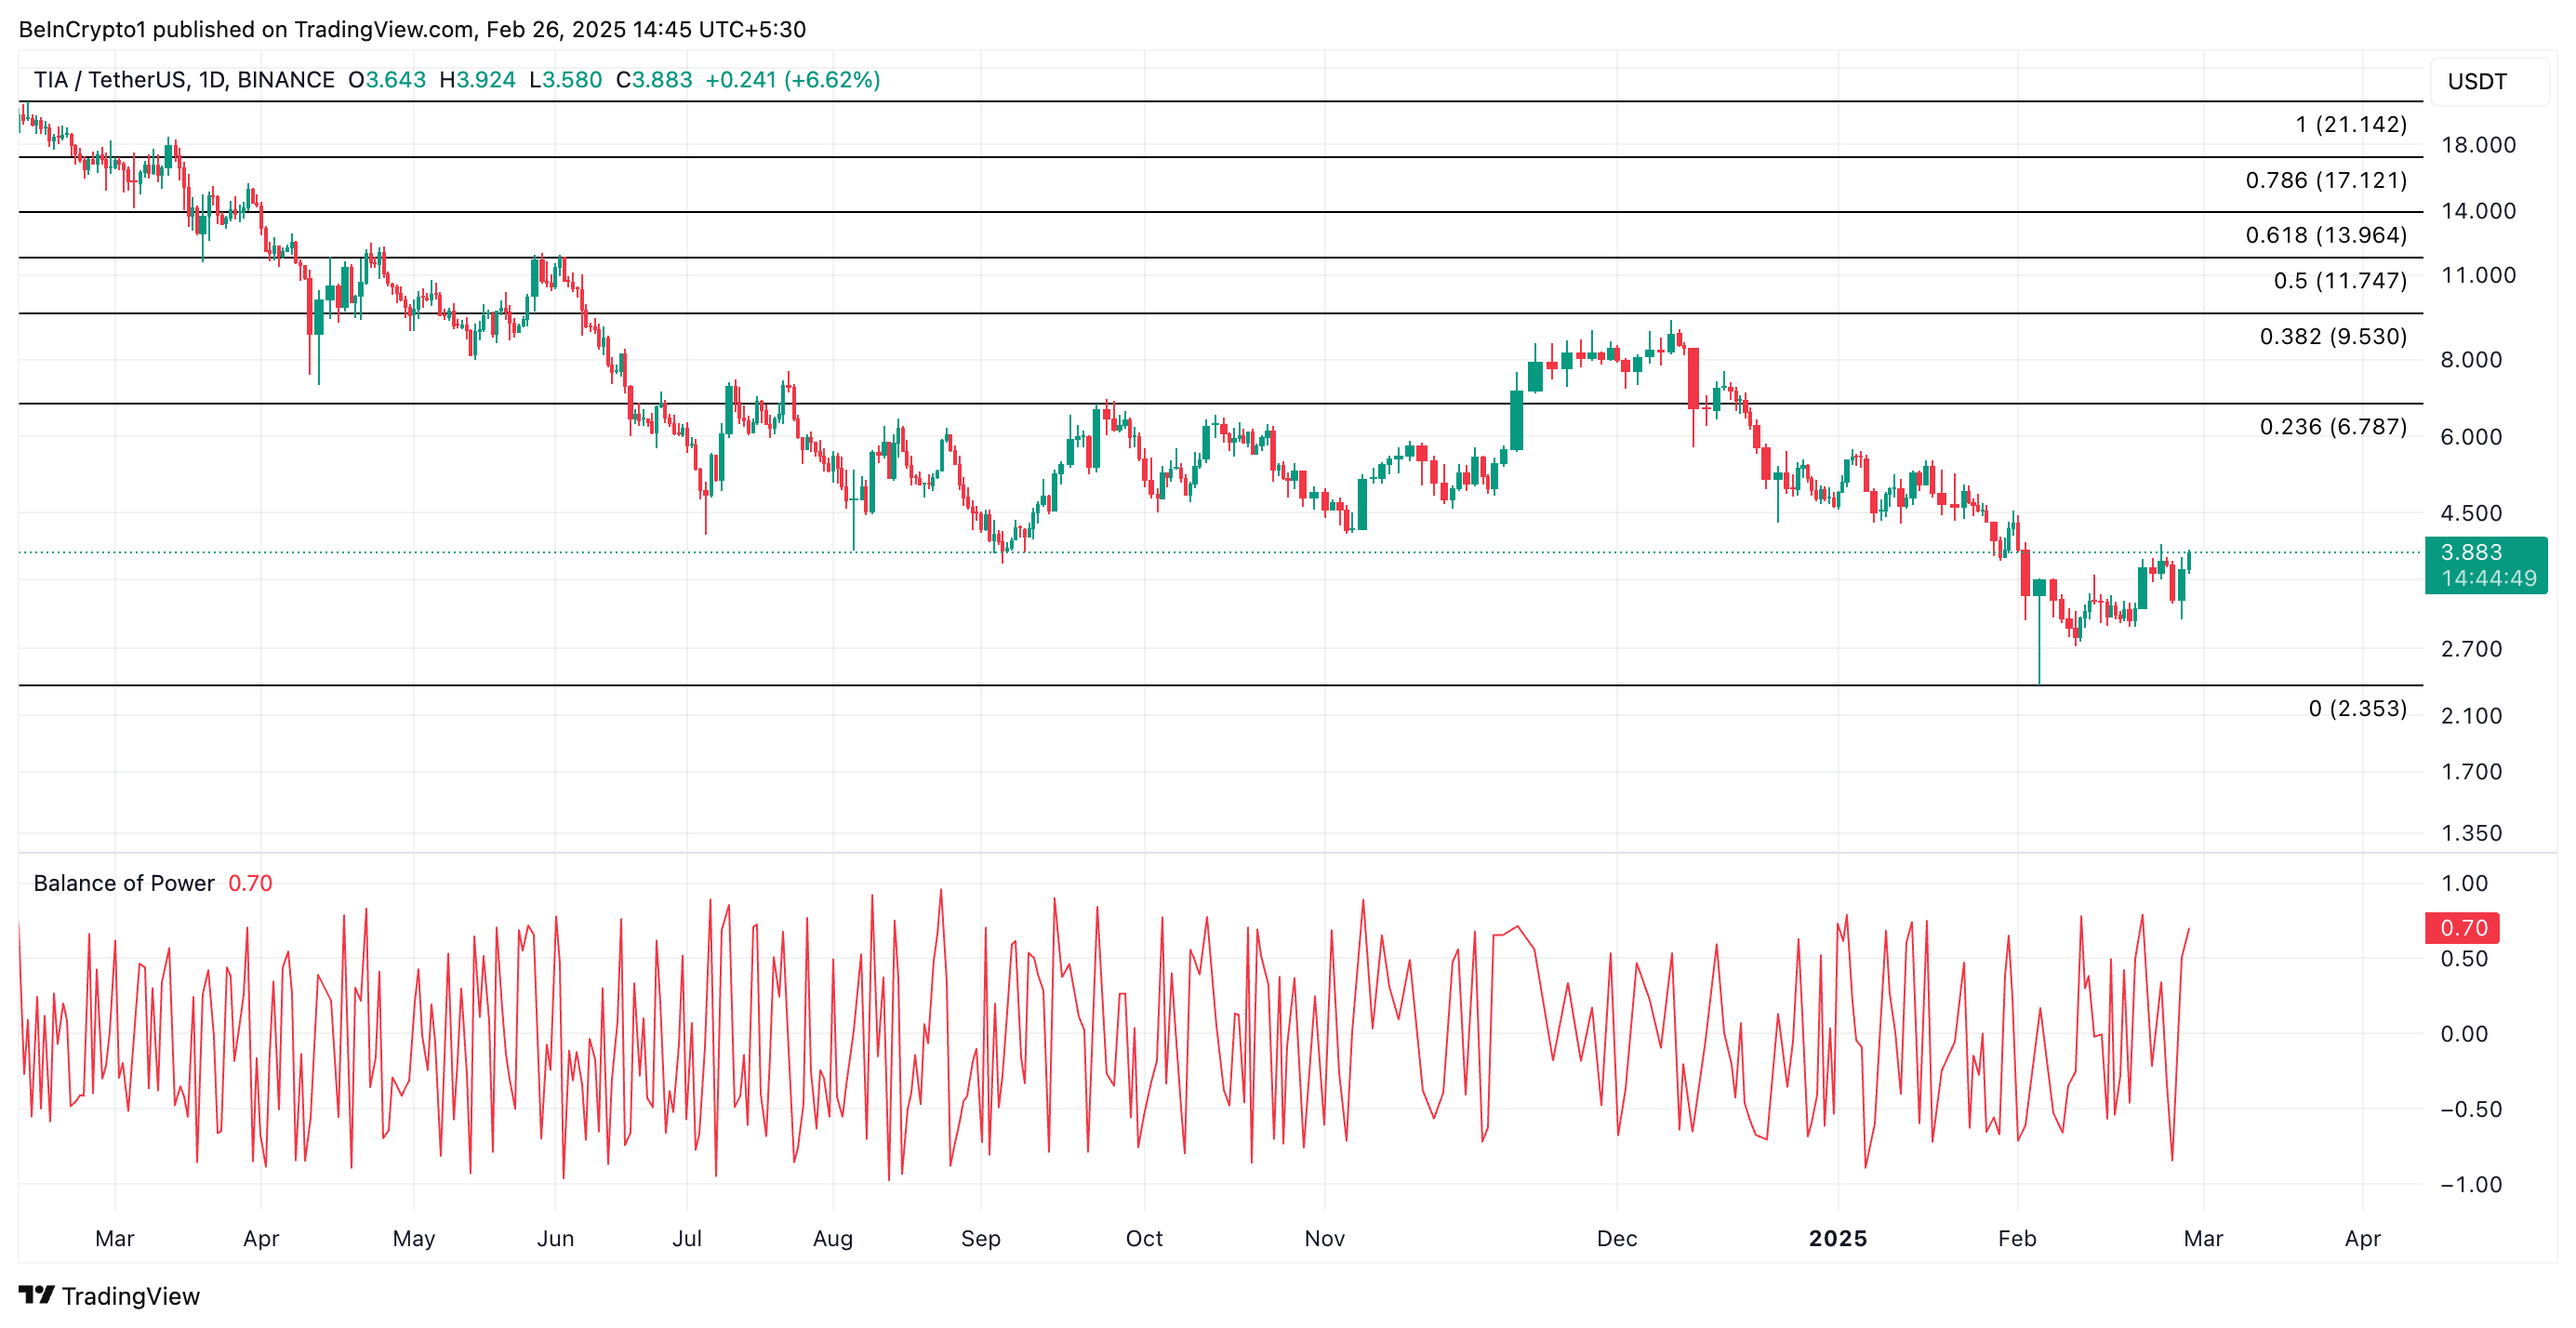
On the flip side, a decline in demand could push TIA to its year-to-date low of $2.35.
KAITO (KAITO)
The newly launched AI token KAITO is a trending altcoin today. Despite the general market decline, its price has risen 7% in the past 24 hours.
Its Aroon Up Line, assessed on an hourly chart, confirms the strength of KAITO’s uptrend. As of this writing, it is at 100%.
The Aroon Indicator measures an asset’s trend strength and identifies potential reversal points. When the Aroon Up line is at 100%, it signals that the asset has recently hit a new high and suggests a strong uptrend with bullish momentum. If KAITO maintains its rally, it could revisit its all-time high of $2.10.
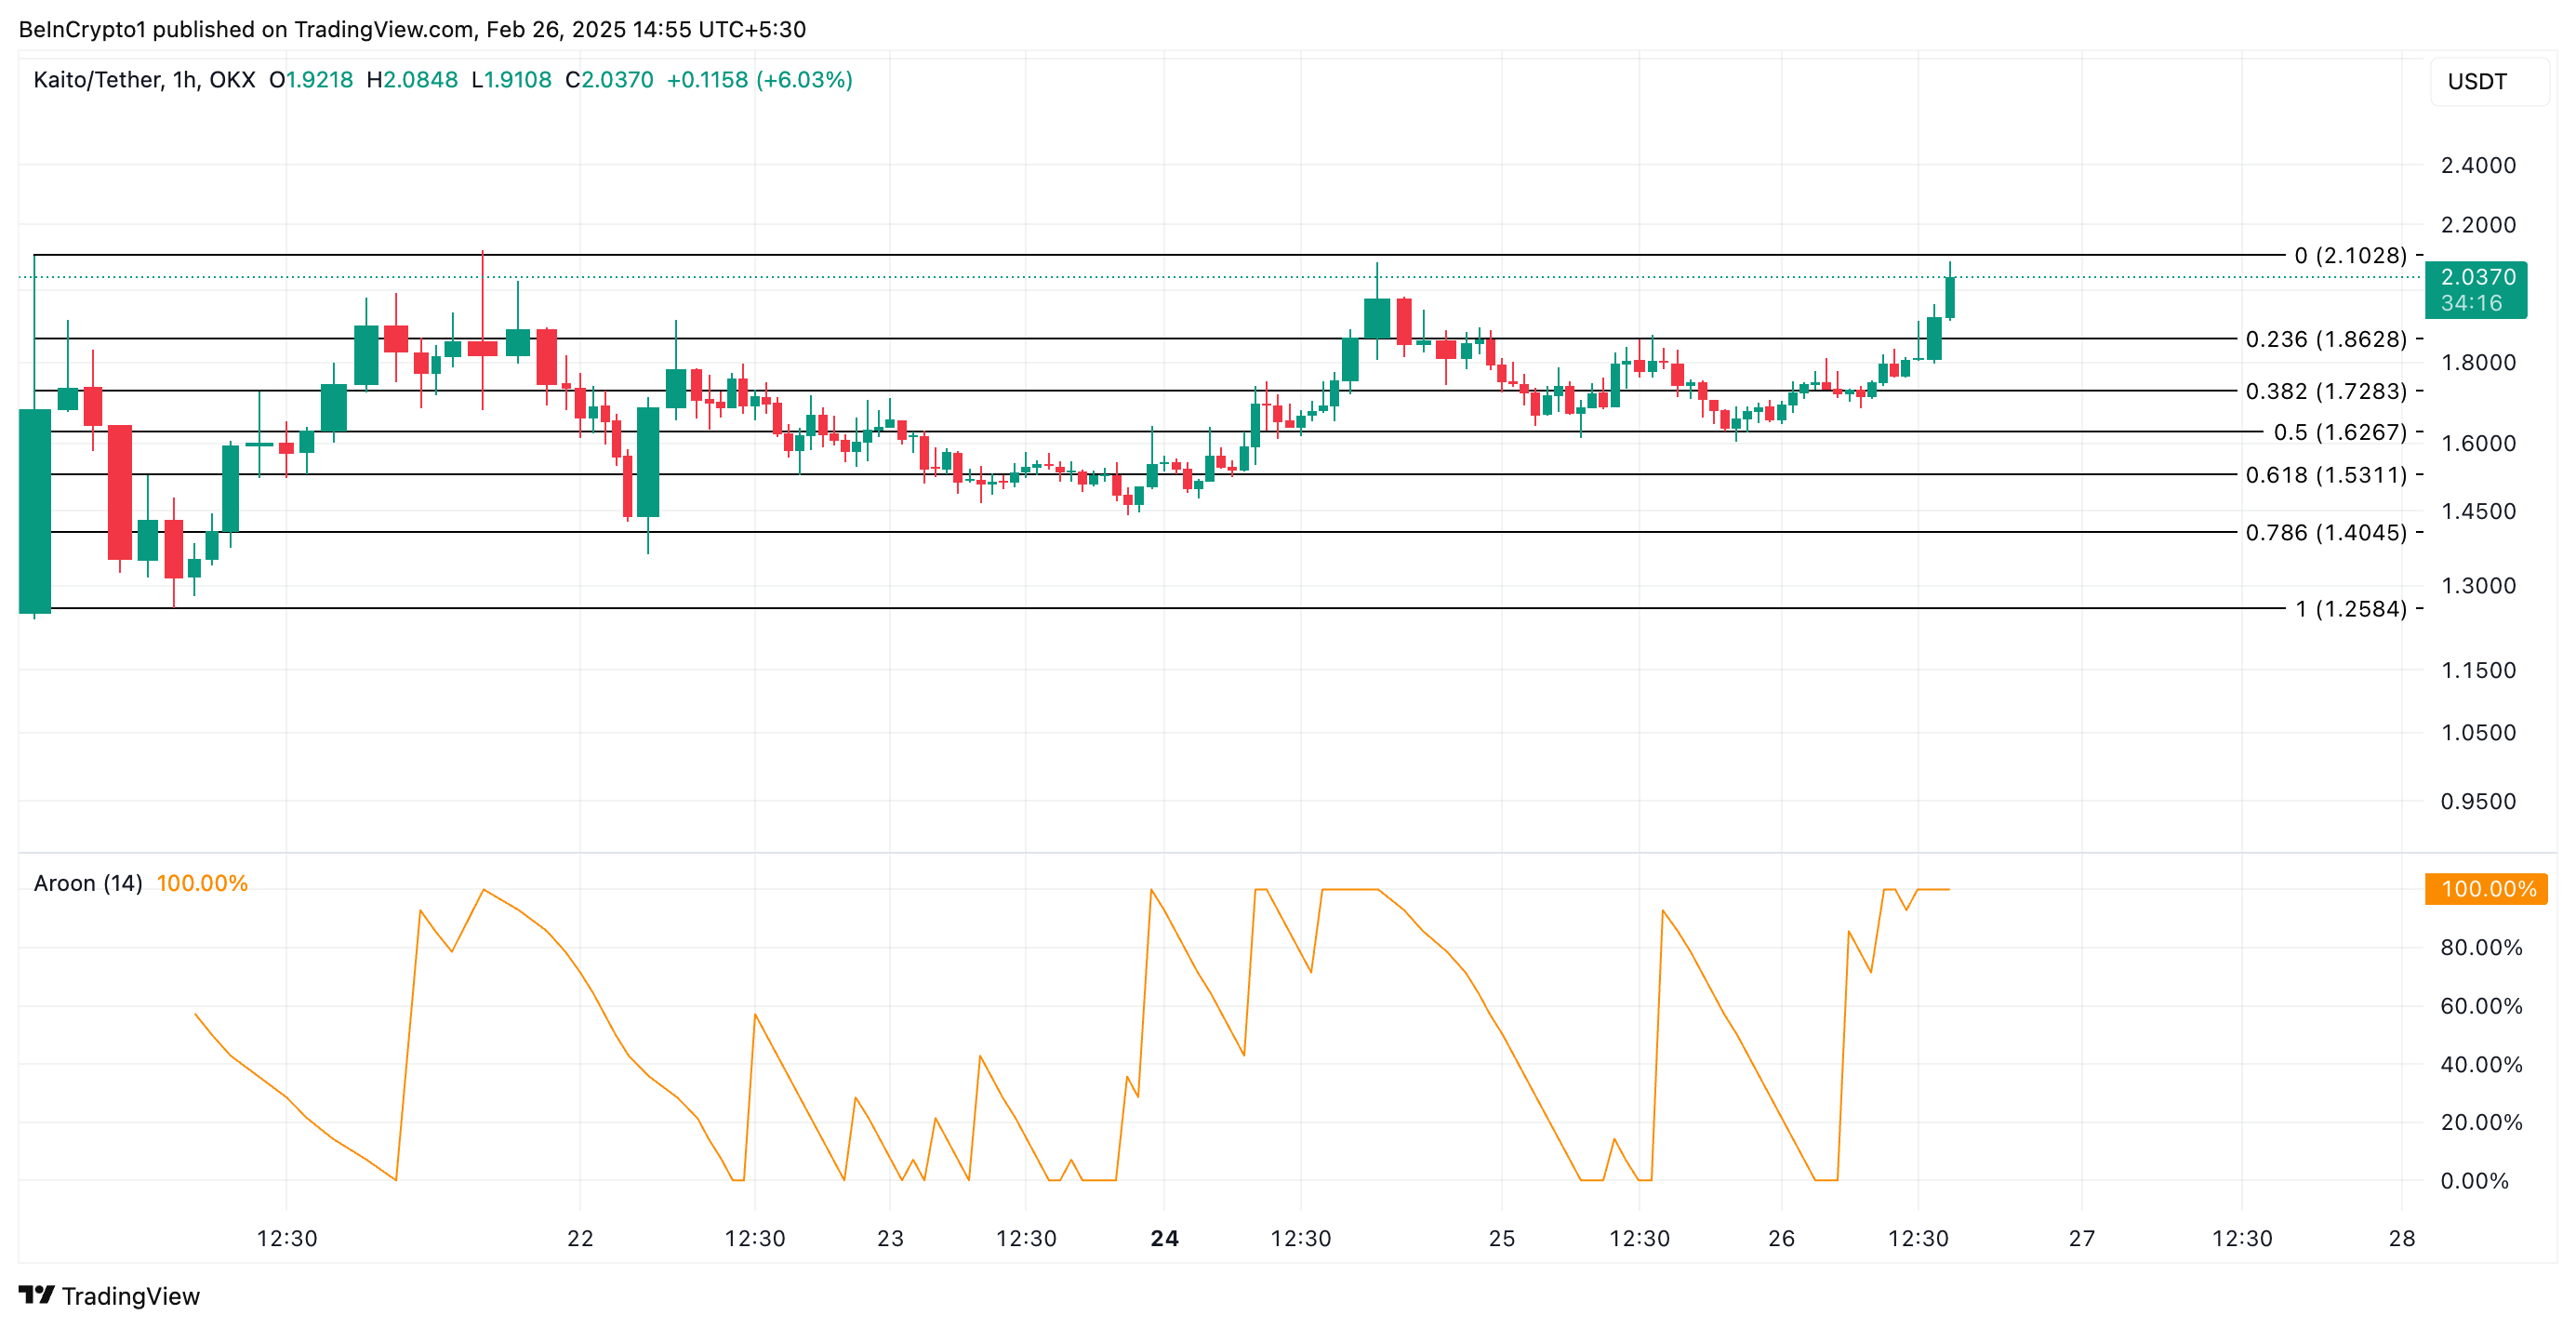
Conversely, a dip in buying pressure could cause its price to drop to $1.82.
Disclaimer
In line with the Trust Project guidelines, this price analysis article is for informational purposes only and should not be considered financial or investment advice. BeInCrypto is committed to accurate, unbiased reporting, but market conditions are subject to change without notice. Always conduct your own research and consult with a professional before making any financial decisions. Please note that our Terms and Conditions, Privacy Policy, and Disclaimers have been updated.


Solana (SOL) continues to show strength across multiple fronts, maintaining a bullish structure on its Ichimoku Cloud chart while gaining momentum in key market metrics. The BBTrend indicator has turned higher again, signaling renewed buying pressure after a brief cooldown.
On-chain activity remains strong, with Solana leading all blockchains in DEX volume and dominating fee generation thanks to the explosive growth of meme coins and launchpad activity. With SOL now trading above a key resistance level, the path is open for further upside—though a loss of momentum could still trigger a retest of lower supports.
Solana Maintains Bullish Structure, but Momentum Faces Key Test
On Solana’s Ichimoku Cloud chart, the price is currently above the Kijun-sen (red base line) but has dipped below the Tenkan-sen (blue conversion line), signaling weakening short-term momentum.
The flattening Tenkan-sen and price behavior suggest possible consolidation or the early stages of a pullback. Still, with the price holding above the Kijun-sen, medium-term support remains intact.
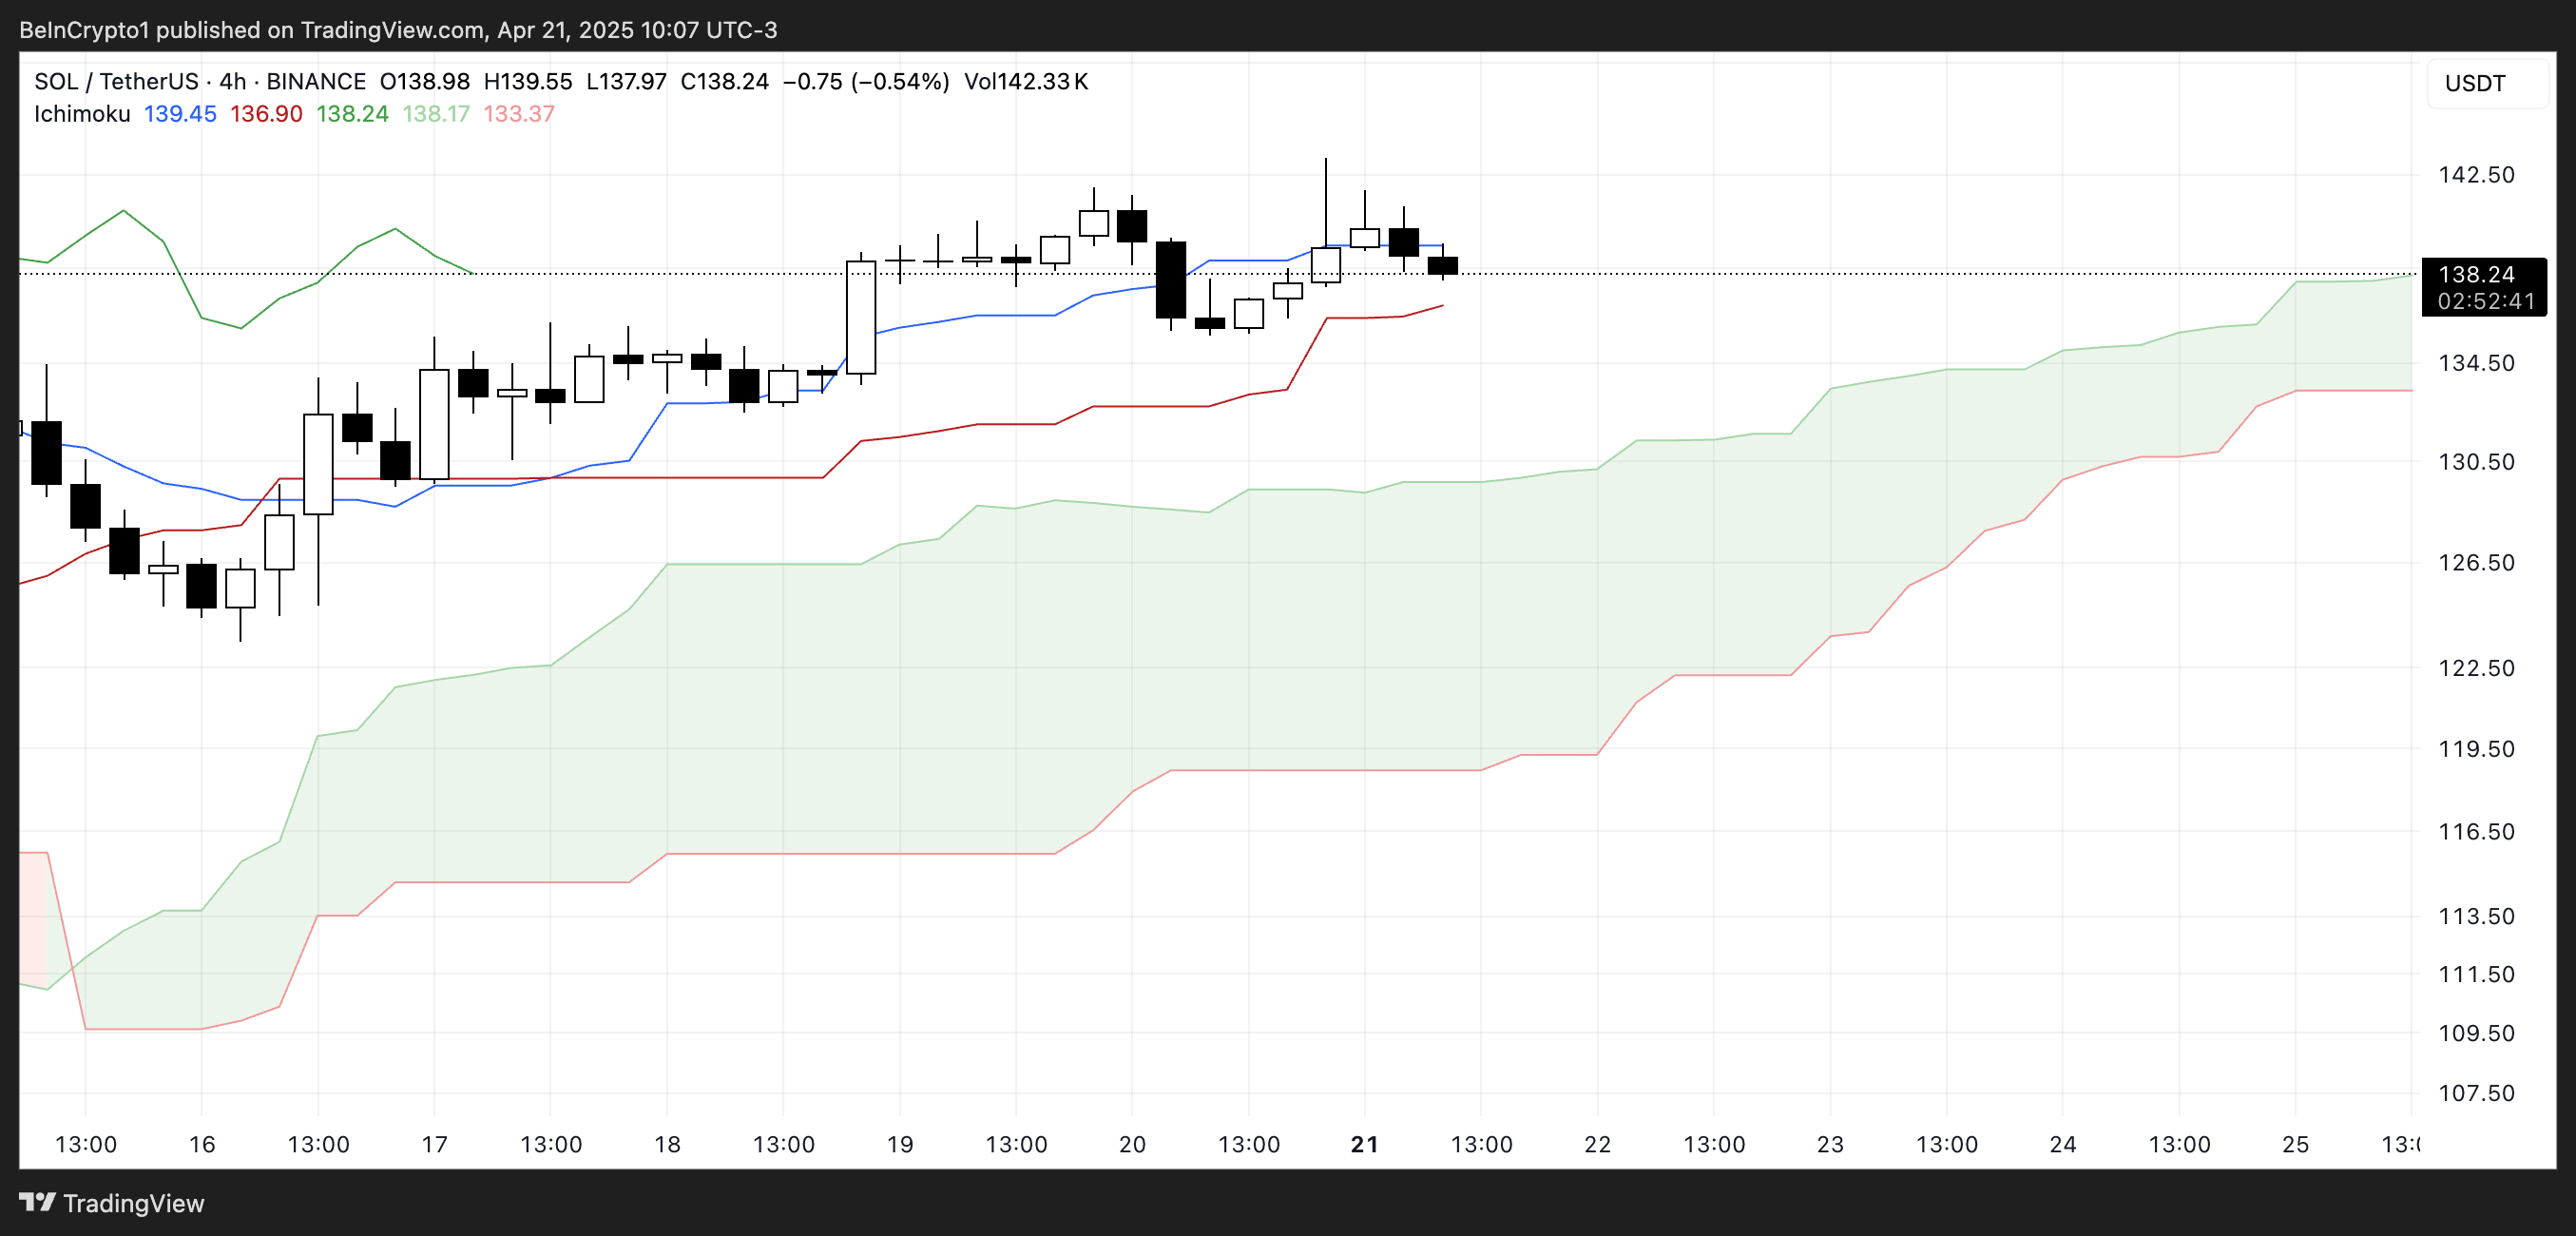
The overall Ichimoku structure remains bullish, with a thick, rising cloud and leading span A well above span B—indicating strong underlying support.
If Solana finds support at the Kijun-sen and climbs back above the Tenkan-sen, the uptrend could regain strength; otherwise, a test of the cloud’s upper boundary may follow.

Meanwhile, Solana’s BBTrend is currently at 6, extending nearly ten days in positive territory after peaking at 17.5 on April 14. The recent increase from 4.26 to 6 suggests renewed bullish momentum following a brief cooldown.
BBTrend, or Bollinger Band Trend, tracks the strength of price movement based on Bollinger Band expansion.
Positive values like the current one point to an active uptrend, and if the BBTrend continues to rise, it could signal stronger momentum and potential for another upward move.
Solana Dominates DEX Volume and Fee Generation as Meme Coins Drive Ecosystem Growth
Solana has once again claimed the top spot among all chains in DEX volume, recording $15.15 billion over the past seven days. The combined total of Ethereum, BNB, Base, and Arbitrum reached $22.7 billion.

In the last 24 hours alone, Solana saw $1.67 billion in volume, largely fueled by its booming meme coin ecosystem and the ongoing launchpad battle between PumpFun and Raydium. Adding to this good momentum, Solana recently surpassed Ethereum in Staking Market Cap.

When it comes to application fees, Solana’s momentum is just as clear. Four of the top ten fee-generating apps over the past week—PumpFun, Jupiter, Jito, and Meteora—are Solana-focused.
Pump leads the pack with nearly $18 million in fees alone.
Solana Breaks Key Resistance as Uptrend Targets Higher Levels, but Risks Remain
Solana has finally broken above its key resistance at $136, flipping it into a new support level that was successfully tested just yesterday.
Its EMA lines remain aligned in a bullish setup, suggesting the uptrend is still intact.
If this momentum continues, SOL price could aim for the next resistance zones at $147 and $152—levels that, if breached, open the door to a potential move toward $179.
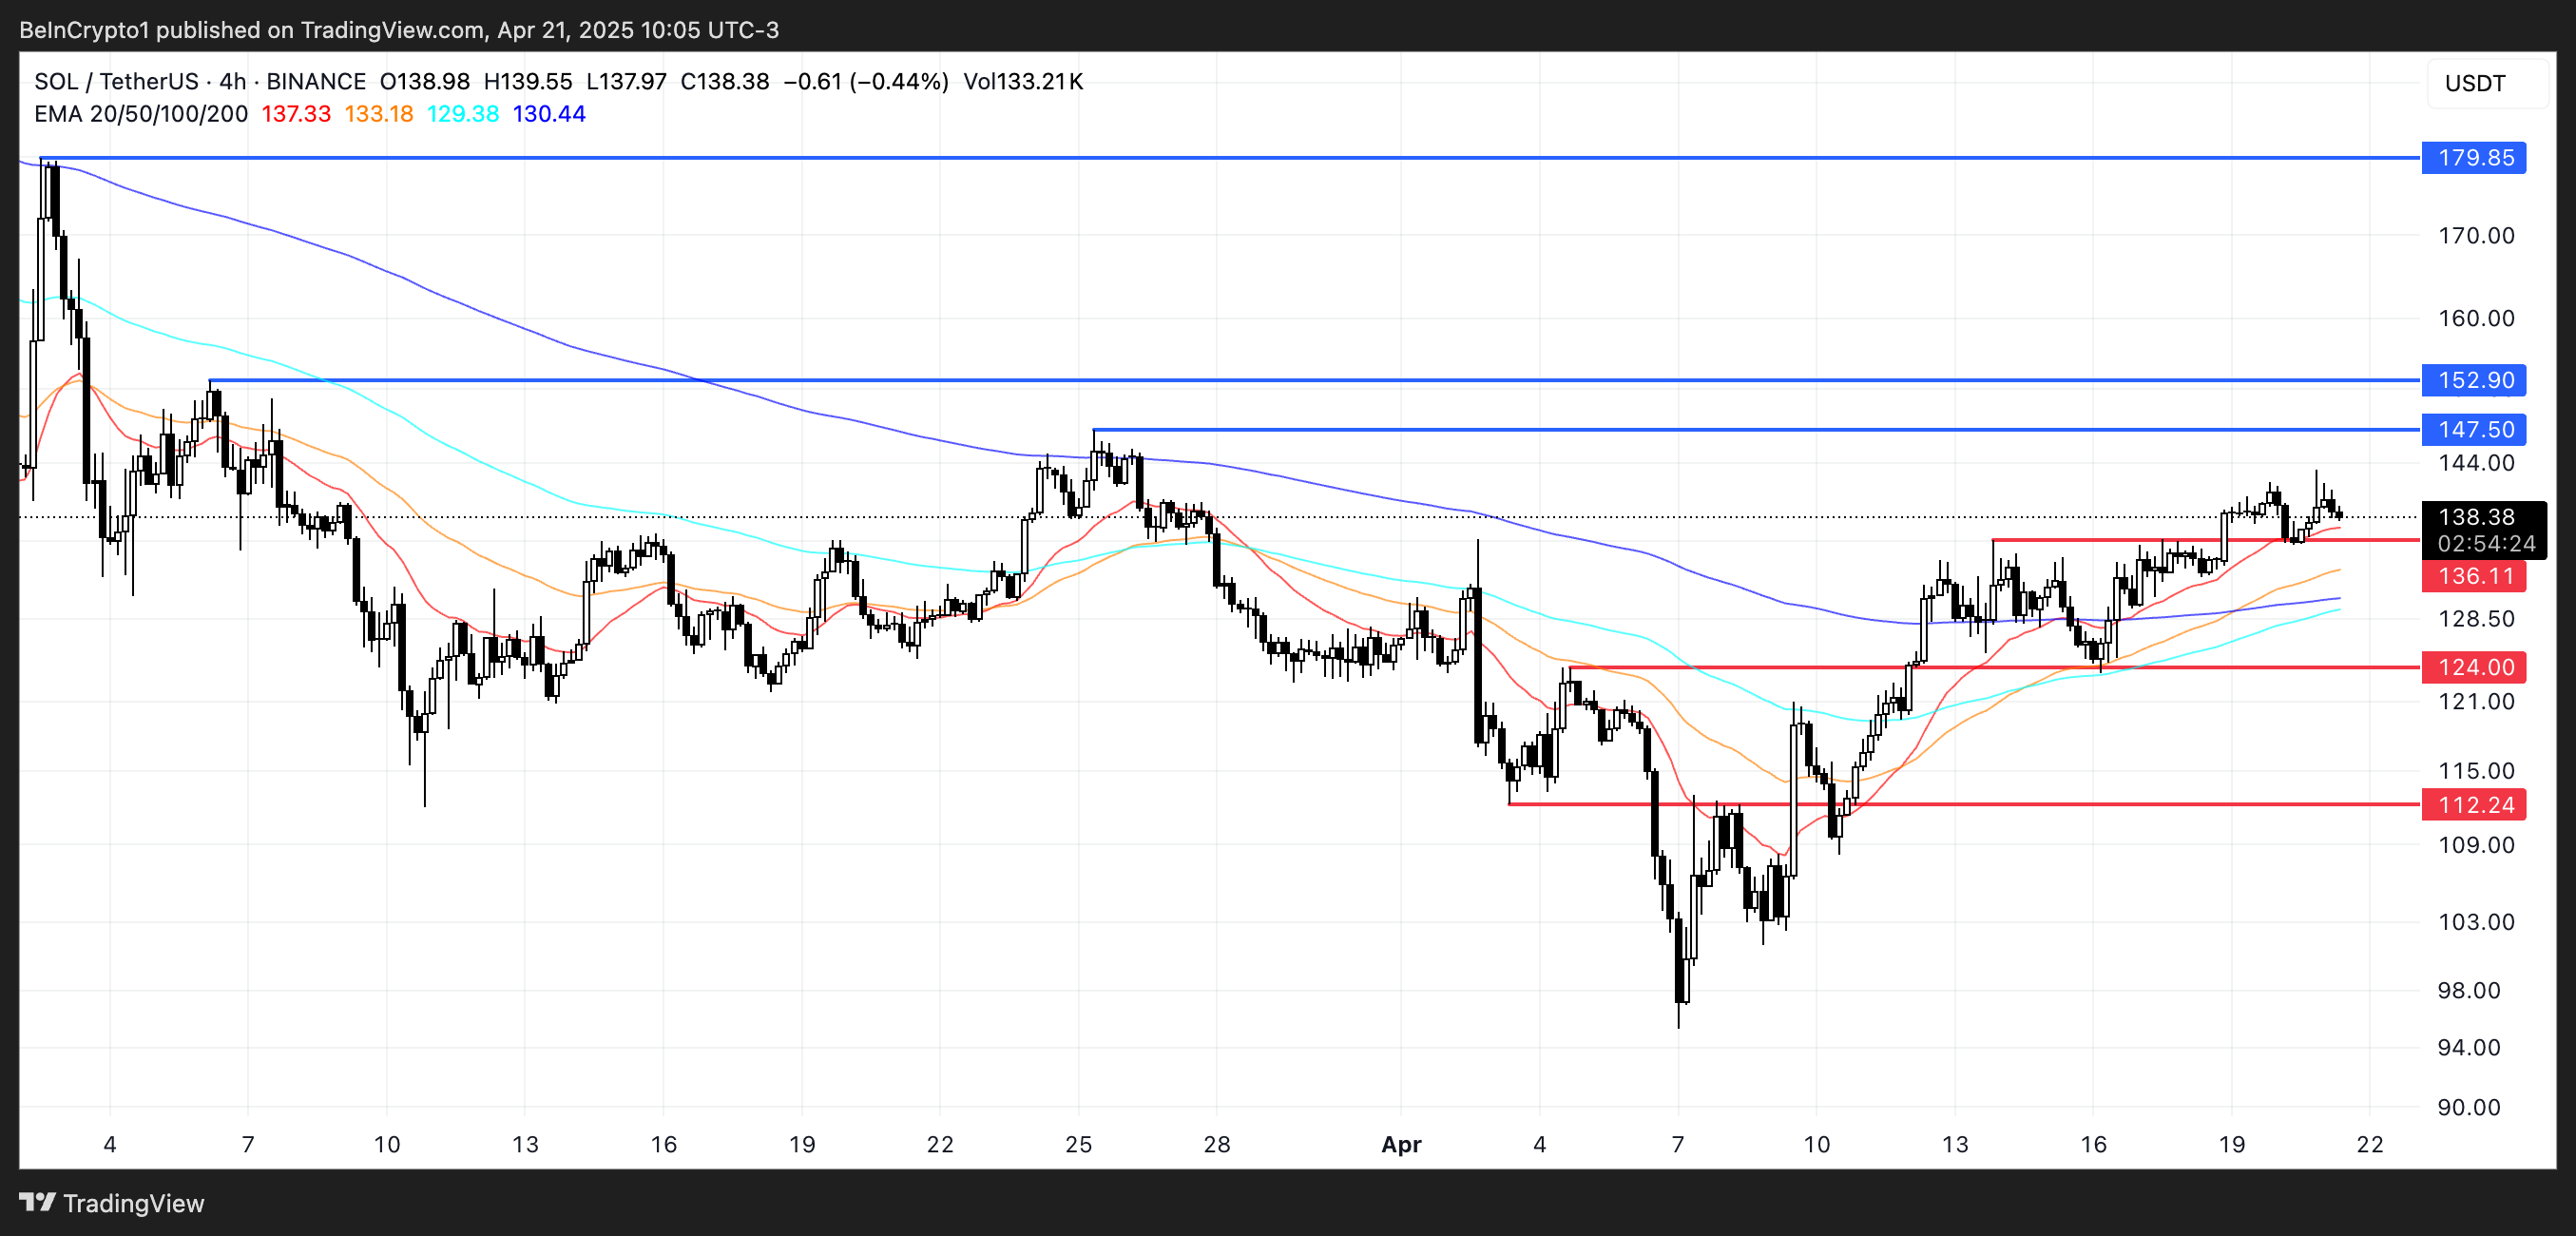
The current structure favors buyers, with higher lows and strong support reinforcing the trend.
However, if momentum fades, a retest of the $136 support is likely.
A breakdown below that level could shift sentiment, exposing Solana to deeper pullbacks toward $124 and even $112.
Disclaimer
In line with the Trust Project guidelines, this price analysis article is for informational purposes only and should not be considered financial or investment advice. BeInCrypto is committed to accurate, unbiased reporting, but market conditions are subject to change without notice. Always conduct your own research and consult with a professional before making any financial decisions. Please note that our Terms and Conditions, Privacy Policy, and Disclaimers have been updated.

According to a new report, 15 firms and individuals from the crypto industry donated more than $100,000 to President Trump’s Inauguration, totaling over $85 million.
Almost all of these companies apparently received direct or indirect benefits from Trump’s administration. This includes dropped legal proceedings, lucrative business partnerships, participation in Trump’s Crypto Summit, and more.
Crypto Industry Went All-In on Trump’s Inauguration
Since promising to bring friendlier regulations on the campaign trail, Donald Trump attracted a reputation as the Crypto President.
Trump’s Inauguration festivities included a “Crypto Ball,” and several prominent firms made donations for these events. Today, a report has compiled all crypto-related contributions of over $100,000, revealing some interesting facts.

Since taking office, President Trump and his family have been allegedly involved in prominent crypto controversies, and these donations may be linked to several of them.
For example, eight of the donors, Coinbase, Crypto.com, Uniswap, Yuga Labs, Kraken, Ripple, Robinhood, and Consensys, had SEC investigations or lawsuits against them closed since Trump’s term began.
The commission might have dropped its probe against these companies anyway due to its changing stance on crypto enforcement. However, being in the President’s good books likely helped the process.
Further Alleged Benefits for Donors
In other words, nearly half the firms that made donations to Trump’s Inauguration have seen their legal problems cleared up quickly. This isn’t the only regulation-related benefit they allegedly received.
Circle, for example, recently made an IPO after openly stating that Trump’s Presidency made it possible. Galaxy Digital received SEC approval for a major reorganization, a key step for a NASDAQ listing.
Other donors, such as Crypto.com and ONDO, got more direct financial partnerships with businesses associated with the Trump family.
Previously, Ripple’s CEO, Brad Garlinghouse, anticipated a crypto bull market under Trump. Also, XRP, Solana, and Cardano were all unexpectedly included in the US Crypto Reserve announcement.
All three of these companies made major donations to Trump’s Inauguration.
It seems that most of the firms involved got at least some sort of noticeable benefit from these donations. Donors like Multicoin and Paradigm received invitations to Trump’s Crypto Summit, while much more prominent groups like the Ethereum Foundation got snubbed.
Meanwhile, various industry KOLs and community members have already alleged major corruption in Trump’s crypto connections.
While some allegations might lack substantial proof, the crypto space has changed dramatically under the new administration, for both good and bad.
Disclaimer
In adherence to the Trust Project guidelines, BeInCrypto is committed to unbiased, transparent reporting. This news article aims to provide accurate, timely information. However, readers are advised to verify facts independently and consult with a professional before making any decisions based on this content. Please note that our Terms and Conditions, Privacy Policy, and Disclaimers have been updated.
Reason to trust
![]()
Strict editorial policy that focuses on accuracy, relevance, and impartiality
Created by industry experts and meticulously reviewed
The highest standards in reporting and publishing
Strict editorial policy that focuses on accuracy, relevance, and impartiality
Morbi pretium leo et nisl aliquam mollis. Quisque arcu lorem, ultricies quis pellentesque nec, ullamcorper eu odio.
In a surprising move within the crypto market, XRP has surpassed Ethereum (ETH) in a key valuation metric: Fully Diluted Market Capitalization (FDMC). While Ethereum has been in a downtrend this bull cycle, XRP’s performance over the last six months has been nothing short of impressive, leading to it quietly overtaking the world’s second-largest cryptocurrency by market capitalization.
XRP Flips Ethereum In FDMC
Edward Farina, a crypto analyst and outspoken XRP supporter, took to X (formerly Twitter) on April 18 to announce that XRP has officially overtaken Ethereum in terms of Fully Diluted Market Capitalization. The FDMC represents the total potential value of a cryptocurrency if all of its tokens were in circulation.
Related Reading
This metric is usually calculated by multiplying a cryptocurrency’s current price by its maximum token supply. This contrasts with the more commonly referenced market capitalization metric, which only factors in circulating supply.
At the time of his post, Farina reported that XRP’s FDMC had reached $208.4 billion, surpassing Ethereum’s $192.5 billion by approximately $15.9 billion. This marks over six consecutive months of XRP outperforming Ethereum in terms of projected value, signaling a potential shift in altcoin dominance between the two leading cryptocurrencies.
Despite XRP’s FDMC milestone, it’s worth noting that Ethereum’s current market capitalization remains significantly higher. As of writing, ETH’s market cap is estimated at $199.14 billion, compared to XRP’s $124.3 billion, reflecting a difference of around $74.84 billion.
The key reason for this discrepancy between XRP’s market capitalization and FDMC lies in its unique token structure. A significant portion of XRP’s supply is held in escrow, meaning those tokens are not yet available in the open market. While they do not count toward the circulating supply, they are included in its Fully Diluted Market Capitalization.
The implication behind this distinction remains clear: if all of XRP’s tokens in escrow were unlocked and circulated today, its market value could exceed that of Ethereum. As the altcoin steadily gains momentum in valuation metrics and investor interest, it could pose a significant challenge to Ethereum’s position as the number one altcoin and second-largest cryptocurrency.
Bollinger Bands Signal Major Move In The Altcoin Price
The XRP price could be gearing up for a significant move upward as technical chart indicators point toward rising volatility. A recent analysis of the 4-hour chart by crypto analyst Ali Martínez shows Bollinger Bands tightening — a classic signal that often precedes a breakout.
Related Reading
Currently trading near the midline of the bands after a bounce from the lower support zone, XRP is now consolidating within a narrow range. The “squeeze” pattern reflects reduced volatility. While the target of the proposed price move remains uncertain, Martinez is confident that its next breakout is just around the corner.
Featured image from Unsplash, chart from Tradingview.com

Solana Leads Blockchain Metrics as SOL Momentum Builds

Crypto Firms Donated $85 million in Trump’s Inauguration

Ethereum to Emphasize Layer-1 Efficiency and UX in Upcoming Protocol Upgrades

XRP Surpasses Ethereum In This Major Metric After Outperforming For 6 Months

PumpFun Moves $13M SOL To Kraken as Solana Price Consolidates, What Next?

Cardano (ADA) Jumps 4% as Bullish Signals Emerge

2.52 Million Altcoins Are Ruining Crypto’s Future

Animoca Brands Valuation Tanks 75% In Two Years, Here’s Why

Crypto exchange BingX hacked for $43 million

Are The Big Players Losing Interest?

Hong Kong’s Securities Association Tips Authorities On Crypto Self-Regulation

Coinbase cbBTC Set to go Live on Solana
2.52 Million Altcoins Are Ruining Crypto’s Future
Animoca Brands Valuation Tanks 75% In Two Years, Here’s Why
Crypto exchange BingX hacked for $43 million
Are The Big Players Losing Interest?
Hong Kong’s Securities Association Tips Authorities On Crypto Self-Regulation
Coinbase cbBTC Set to go Live on Solana
-
 Bitcoin20 hours ago
US Economic Indicators to Watch & Potential Impact on Bitcoin
-
 Altcoin18 hours ago
Expert Reveals Why BlackRock Hasn’t Pushed for an XRP ETF
-

 Market23 hours ago
Bitcoin Price Breakout In Progress—Momentum Builds Above Resistance
-

 Market20 hours ago
Vitalik Buterin Proposes to Replace EVM with RISC-V
-

 Altcoin23 hours ago
Expert Says Solana Price To $2,000 Is Within Reach, Here’s How
-

 Market21 hours ago
Solana Rallies Past Bitcoin—Momentum Tilts In Favor of SOL
-
 Altcoin12 hours ago
Will Cardano Price Break Out Soon? Triangle Pattern Hints at 27% ADA Surge
-

 Market19 hours ago
XRP Bulls Defend $2.00—Is a Fresh Price Surge Loading?