
Market
Pi Network Stabilizes, But Unverified Market Cap Fuels Concerns

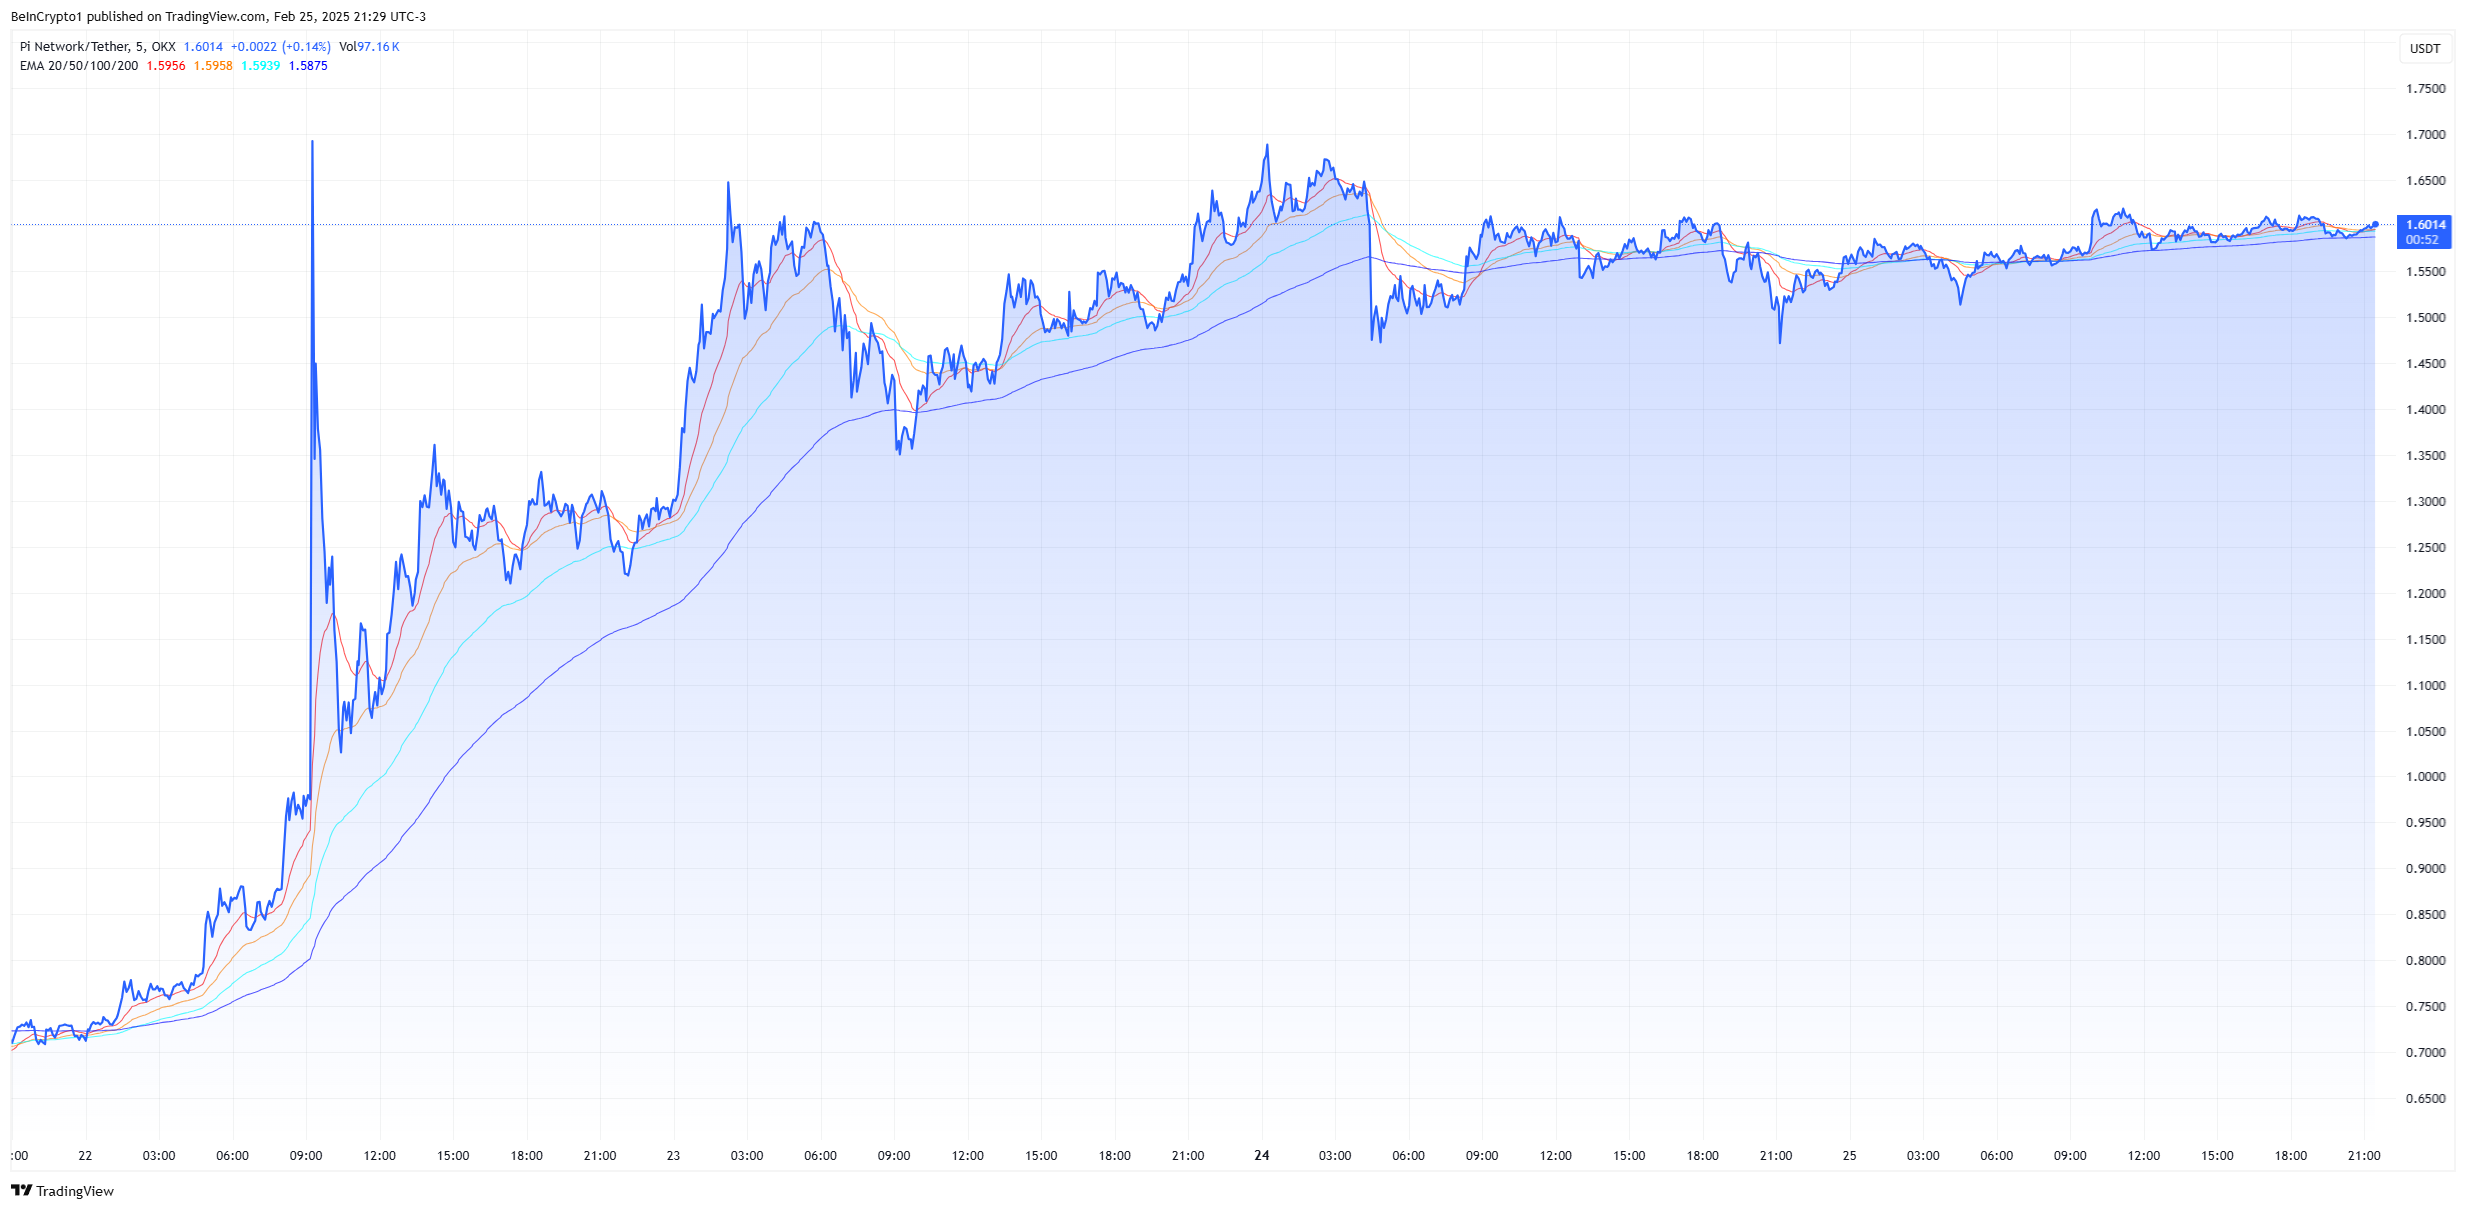
Pi Network’s token price finally stabilized after a market correction, staying steady despite broader volatility. The token’s daily trading volume also reached $500 million.
PI is also experiencing high inflation, and its market cap claims remain unverified.
Pi Network Shows Stability
Pi Network, a blockchain project that’s taken the crypto space by storm, is having an eventful few days. Binance updated the results of its recent community vote to list the token, confirming that the proposal had 86% support. However, its listing decision is still pending.
Despite broader concerns about a possible bear market, the altcoin is stabilizing after a brief market correction.
As March 14 (Pi Day) approaches, some fans are anticipating a major announcement from developers. The project’s official X account surpassed Ethereum’s follower total and is currently the fourth-most-followed crypto account on the website.
Of course, the recent Pi airdrop was the most valuable airdrop in history at $12.6 billion, so making an even bigger announcement would be difficult.
Over the last five days, 200 million Pi tokens have been put into circulation. This translates to an inflation rate of 0.634% per day and 231.41% per year, which are extremely high.
Also, CoinMarketCap data shows that PI’s market cap has exceeded $10 billion, which places it among the top 15 cryptocurrencies in the market. Yet, the platform has not updated its ranking, potentially because the market cap is self-reported and not independently verified.
“Pi Network is currently ranked at 3157 on CoinMarketCap due to its unverified market cap and circulating supply. But if the self-reported supply is accurate, Pi would have over a $10 billion market cap, placing it at 11-12,” wrote poular influencer Zoe.
Nonetheless, these claimed numbers are still unverified, and Pi Network has some harsh critics. Ben Zhou, CEO of Bybit, loudly called the project a scam, reminding his followers that the Chinese government regards the project as an outright pyramid scheme.
CoinMarketCap is apparently reluctant to list the token as a top contender at this early stage. Other major data tracking platforms like CoinGecko omitted the token’s market cap.
In short, the recent news cycle about the Pi Network has been very chaotic. Its supporters continue to build up the project’s international notoriety, but critics wonder if the whole enterprise is a bubble.
Disclaimer
In adherence to the Trust Project guidelines, BeInCrypto is committed to unbiased, transparent reporting. This news article aims to provide accurate, timely information. However, readers are advised to verify facts independently and consult with a professional before making any decisions based on this content. Please note that our Terms and Conditions, Privacy Policy, and Disclaimers have been updated.


Bitcoin (BTC) is testing investor sentiment again as it hovers in a precarious position, teasing the possibility of a prolonged bear cycle.
Amid market uncertainty, analysts and traders are weighing in on the crypto market’s current state, debating whether the recent downturn is a signal of further losses or a setup for a major rebound.
Analysts Weigh Crypto Market Recovery
Julio Moreno, head of research at CryptoQuant, noted that on Wednesday, Bitcoin holders realized the largest single-day loss since August 2024, totaling a staggering $1.7 billion. This significant sell-off suggests widespread panic among traders, with many choosing to cut their losses as Bitcoin dipped below key support levels.
“Bitcoin holders realized today the largest loss since August 2024: $1.7 billion,” noted Moreno.
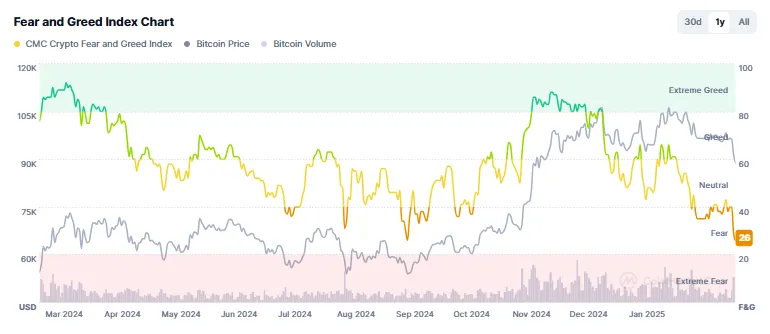
Meanwhile, market analyst Miles Deutscher highlighted that the Crypto Fear and Greed Index, a widely followed sentiment indicator, has plunged to its lowest since October 2024. In his opinion, however, extreme fear in the market could be a precursor to a price reversal, indicating that Bitcoin might be approaching a critical turning point.
“People are finally getting nervous again. Believe it or not, that’s exactly what we need to eventually form a bottom,” he explained.
In another observation, Deutscher pointed out that BTC exchange inflows hit their highest level of the year amid the recent market turmoil. This suggests that traders rushed to liquidate their holdings as Bitcoin dipped below the $90,000 mark.
However, he also speculated that such panic-driven selling could set the stage for an unexpected bounce, potentially catching those who sold off guard.
Mark Cullen, an analyst at AlphaBTC, weighed in on the situation, highlighting the role of market makers in stabilizing the price. According to Cullen, a Binance exchange market maker stepped in to prevent a deeper crash, recognizing that a further decline could trigger a widespread capitulation event.
“They know Bitcoin breaking any lower will cause a crypto market-wide crash and customers leaving with burnt fingers,” he stated.
Despite the intervention, Cullen remains cautious, suggesting that a temporary bounce may occur before the next leg down. While he does not expect an immediate crash, he did not rule out another drop to the $87,000 range to establish a higher low before a potential recovery.
M2 Money Supply Model Predicts Bitcoin Surge in March
Some analysts are eyeing March 2025 for a potential bullish turn. Colin Talks Crypto, a well-known crypto analyst, pointed to the strong correlation between Bitcoin’s price movements and the global M2 money supply.
His model suggests that Bitcoin’s price often reacts to changes in liquidity with a lag of approximately 46 days. According to the model, Bitcoin is expected to see a significant upward move around March 7, 2025, though this timeline could shift earlier based on recent trends.
The decreasing lag time between M2 movements and Bitcoin’s response suggests that increased global liquidity could soon boost BTC prices. While the correlation is imperfect, it has historically been a strong directional signal for Bitcoin’s price trends.
“It’s an uncanny correlation and it’s too close, in my opinion, to be coincidence,” the analyst quipped.
If the M2 Money Supply model holds, Bitcoin could be set for a recovery in early March. However, volatility remains the dominant theme in the short term, and traders should brace for potential bounces as macroeconomic factors influence institutional sentiment.
“… the price needs to recover above $96,000-$100,000, which will confirm the market’s readiness for new growth. If the pressure persists, the market may enter a phase of a deeper correction,” StealthEx CEO Maria Carola shared with BeInCrypto.
Adding to the bearish pressure, Bitcoin ETFs have recorded substantial net outflows. As BeInCrypto reported, Institutional investors, who played a major role in Bitcoin’s rally to new highs, appear to be pulling funds out of the market, raising concerns about further downside risk.
“This process [institutional redemptions] puts significant pressure on the BTC rate since issuers are forced to sell the asset to cover withdrawal requests,” MEXC COO Tracy Jin told BeInCrypto.
Disclaimer
In adherence to the Trust Project guidelines, BeInCrypto is committed to unbiased, transparent reporting. This news article aims to provide accurate, timely information. However, readers are advised to verify facts independently and consult with a professional before making any decisions based on this content. Please note that our Terms and Conditions, Privacy Policy, and Disclaimers have been updated.

Ethereum has recently struggled to maintain upward momentum after failing to break above the $2,800 resistance. The altcoin king’s price experienced a steep decline due to broader market bearish conditions, causing it to fall below $2,500.
Despite the downturn, Ethereum investors have remained confident, seizing the opportunity to accumulate at lower price levels.
Ethereum Investors See An Opportunity
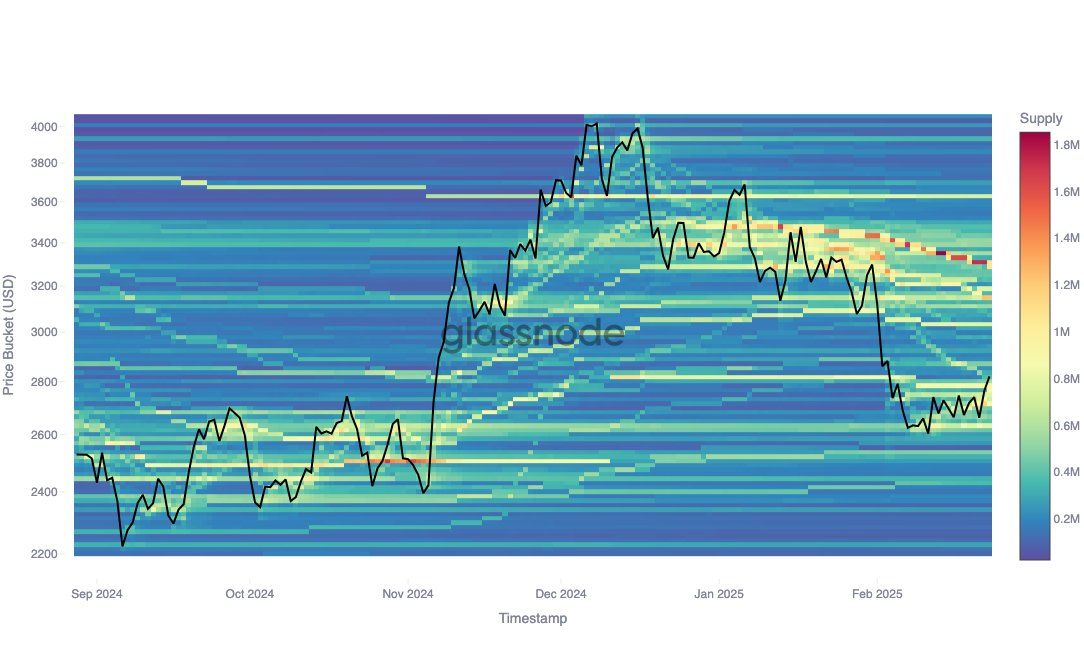
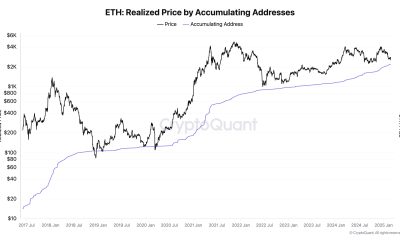
Ethereum’s market sentiment reveals investor conviction through the Cost Basis Distribution (CBD) data. According to Glassnode, the CBD shows that investors have consistently accumulated Ethereum even as the price dropped. Multiple cost bases are moving lower, indicating that market participants are taking advantage of the price dip.
The data reveals significant support at $2,632, with 786,660 ETH being acquired at this level, and resistance at $3,149, where 1.22 million ETH has been accumulated. This support and resistance range is crucial for Ethereum’s price stability, as it reflects where large groups of investors are buying or selling. As Ethereum’s price continues to trade within these zones, the market remains cautiously optimistic.
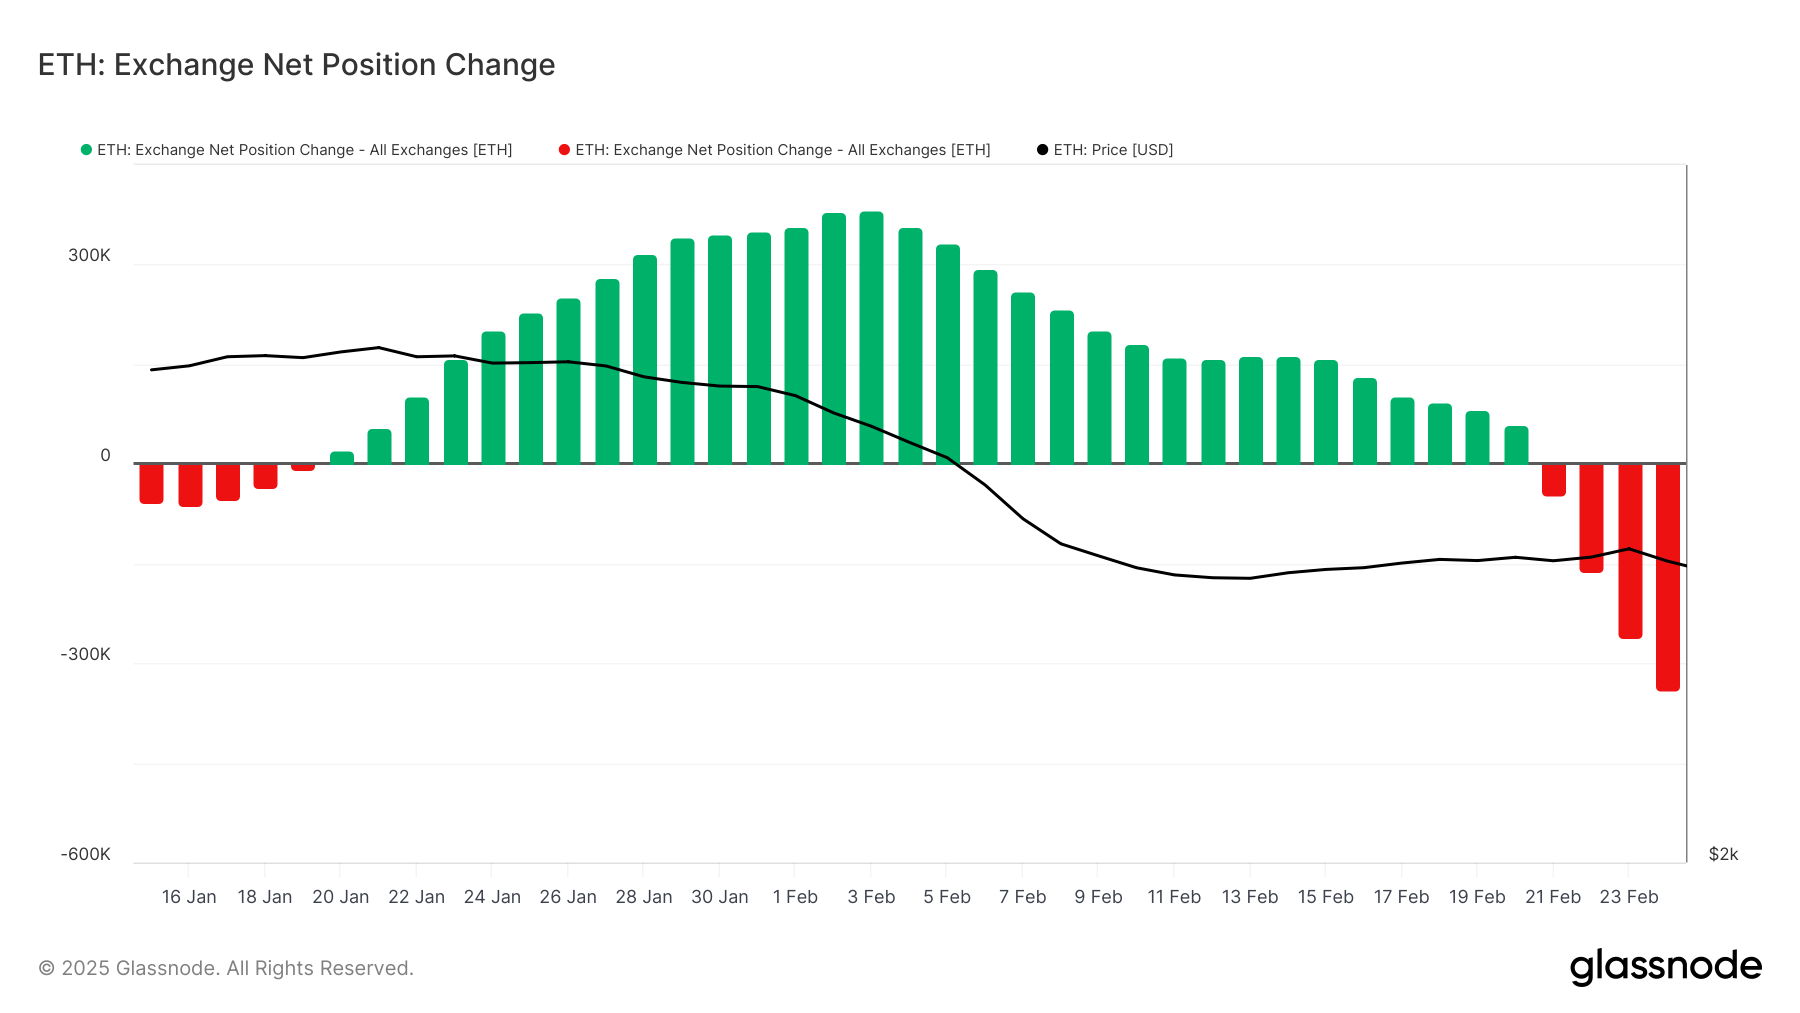
Ethereum’s macro momentum remains solid despite recent price declines. Ethereum’s exchange net position change shows a notable shift, with 178,500 ETH flowing out of exchanges over the last 48 hours.
This indicates that investors are moving their holdings off exchanges, possibly to hold long-term in anticipation of future gains. The outflows amount to roughly $444 million, signaling strong investor confidence in Ethereum’s recovery once the bearish trend subsides.
ETH Price Needs To Break This Pattern
Ethereum’s price currently sits at $2,486, marking an 11% drop over the past 48 hours. This decline follows a failed attempt to break above the $2,793 resistance, keeping Ethereum in a near 3-month-long downtrend. However, despite being below $2,500, Ethereum’s future price action shows potential for recovery.
The altcoin could see a rebound if it successfully flips the $2,654 level into support. If Ethereum manages to reclaim this level, it could potentially break above $2,793 again, aiming for the psychological $3,000 mark.
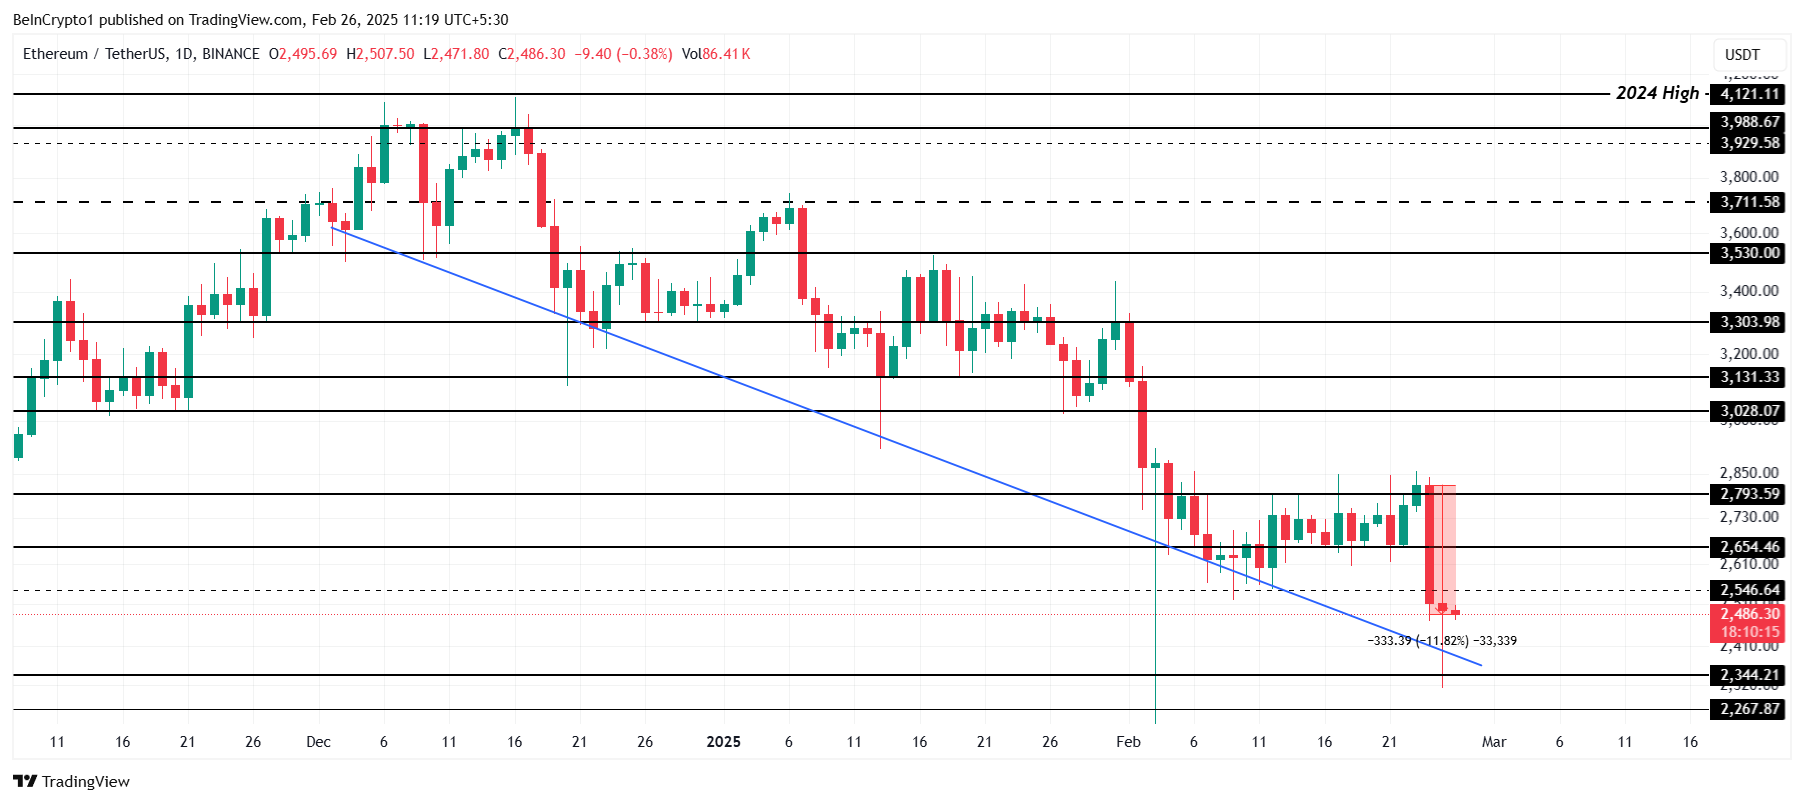
However, if Ethereum fails to reclaim $2,654 and struggles under the weight of continued market bearishness, the price could dip further to $2,344. Such a scenario would extend losses and possibly invalidate the current bullish outlook, leaving investors awaiting clearer signs of a price reversal.
Disclaimer
In line with the Trust Project guidelines, this price analysis article is for informational purposes only and should not be considered financial or investment advice. BeInCrypto is committed to accurate, unbiased reporting, but market conditions are subject to change without notice. Always conduct your own research and consult with a professional before making any financial decisions. Please note that our Terms and Conditions, Privacy Policy, and Disclaimers have been updated.

Bitcoin price started a fresh decline below the $90,000 support. BTC must stay above the $86,000 zone to avoid more losses in the near term.
- Bitcoin started a fresh decline from the $95,500 zone.
- The price is trading below $90,000 and the 100 hourly Simple moving average.
- There is a short-term triangle forming with resistance at $89,000 on the hourly chart of the BTC/USD pair (data feed from Kraken).
- The pair could start another decline if it fails to stay above the $90,000 zone.
Bitcoin Price Dips Sharply
Bitcoin price failed to stay above the $95,500 level and started a fresh decline. BTC declined heavily below the $93,200 and $92,200 support levels.
The price even dived below the $90,000 level. It tested the $86,000 zone. A low was formed at $86,000 and the price is now consolidating losses. It is back above the $88,500 level and the 23.6% Fib retracement level of the downward move from the $96,482 swing high to the $86,000 low.
Bitcoin price is now trading below $91,200 and the 100 hourly Simple moving average. On the upside, immediate resistance is near the $89,000 level. There is also a short-term triangle forming with resistance at $89,000 on the hourly chart of the BTC/USD pair.
The first key resistance is near the $90,000 level. The next key resistance could be $91,250 or the 50% Fib retracement level of the downward move from the $96,482 swing high to the $86,000 low.

A close above the $91,250 resistance might send the price further higher. In the stated case, the price could rise and test the $93,500 resistance level. Any more gains might send the price toward the $95,000 level or even $96,400.
Another Decline In BTC?
If Bitcoin fails to rise above the $90,000 resistance zone, it could start a fresh decline. Immediate support on the downside is near the $88,000 level. The first major support is near the $87,250 level.
The next support is now near the $86,000 zone. Any more losses might send the price toward the $85,000 support in the near term. The main support sits at $83,200.
Technical indicators:
Hourly MACD – The MACD is now losing pace in the bearish zone.
Hourly RSI (Relative Strength Index) – The RSI for BTC/USD is now below the 50 level.
Major Support Levels – $88,000, followed by $86,000.
Major Resistance Levels – $90,000 and $91,250.
Crypto Market Recovery: Analysts Weigh In

Could Strategy (MSTR) Be Pressured to Sell $43 Billion in Bitcoin?

Dogecoin Whales Offload 312M DOGE Amid Market Turmoil, What Lies Ahead?

Ethereum Investors Accumulate As Price Falls Below $2,500

Bitcoin Price Takes a Hit—Is This Just the Beginning?

Ethereum Tests “Make Or Break” Level, But Altseason Hopes Stay Alive – Details

2.52 Million Altcoins Are Ruining Crypto’s Future

Animoca Brands Valuation Tanks 75% In Two Years, Here’s Why

Crypto exchange BingX hacked for $43 million

Are The Big Players Losing Interest?

Hong Kong’s Securities Association Tips Authorities On Crypto Self-Regulation

Coinbase cbBTC Set to go Live on Solana
2.52 Million Altcoins Are Ruining Crypto’s Future
Animoca Brands Valuation Tanks 75% In Two Years, Here’s Why
Crypto exchange BingX hacked for $43 million
Are The Big Players Losing Interest?
Hong Kong’s Securities Association Tips Authorities On Crypto Self-Regulation
Coinbase cbBTC Set to go Live on Solana
-

 Bitcoin23 hours ago
Bitcoin ร่วงหนัก! Saylor ยังซื้อเพิ่ม เชื่อมั่นระยะยาว
-

 Market15 hours ago
Latest crypto crash leaves Bitcoin Pepe unscathed
-

 Market24 hours ago
LINK Sudden Breakdown Sparks Fears Of Collapse To $12.5 Support Zone
-
 Altcoin24 hours ago
Will US SEC Approve Grayscale’s XRP ETF This Week?
-
 Ethereum23 hours ago
Time To Turn Bullish On Ethereum? CryptoQuant CEO Thinks So
-

 Market23 hours ago
Pi Coin Price Aims for New All-Time Highs Even as Bears Weigh In
-
 Altcoin23 hours ago
Nasdaq Submits Filing To List Grayscale Polkadot ETF, DOT Price To $34?
-
 Altcoin17 hours ago
Cardano Price Could Drop To $0.53 Unless This Happens