
Market
What It Means for BTC’s Price

The leading coin, Bitcoin, has been trading within a narrow range since the beginning of February. It has struggled to break out of consolidation as both buying and selling pressures remain subdued.
On-chain data suggests that this period of sideways movement could persist due to weakening activity on the Bitcoin network.
Bitcoin Could Face Prolonged Sideways Movement as Network Activity Drops
According to a recent report by pseudonymous CryptoQuant analyst Avocado_onchain, Bitcoin network activity has been steadily declining, contributing to BTC’s recent narrow price movements. If this continues, “we must consider the possibility of another prolonged consolidation phase, similar to what began in March 2024,” the analyst says.
One such data Avocado considers is the number of daily active wallet addresses on the Bitcoin network. According to CryptoQuant’s data, when observed using a 30-day small moving average (SMA), the daily count of addresses that have completed at least one BTC transaction has plummeted by 2% since February 1.
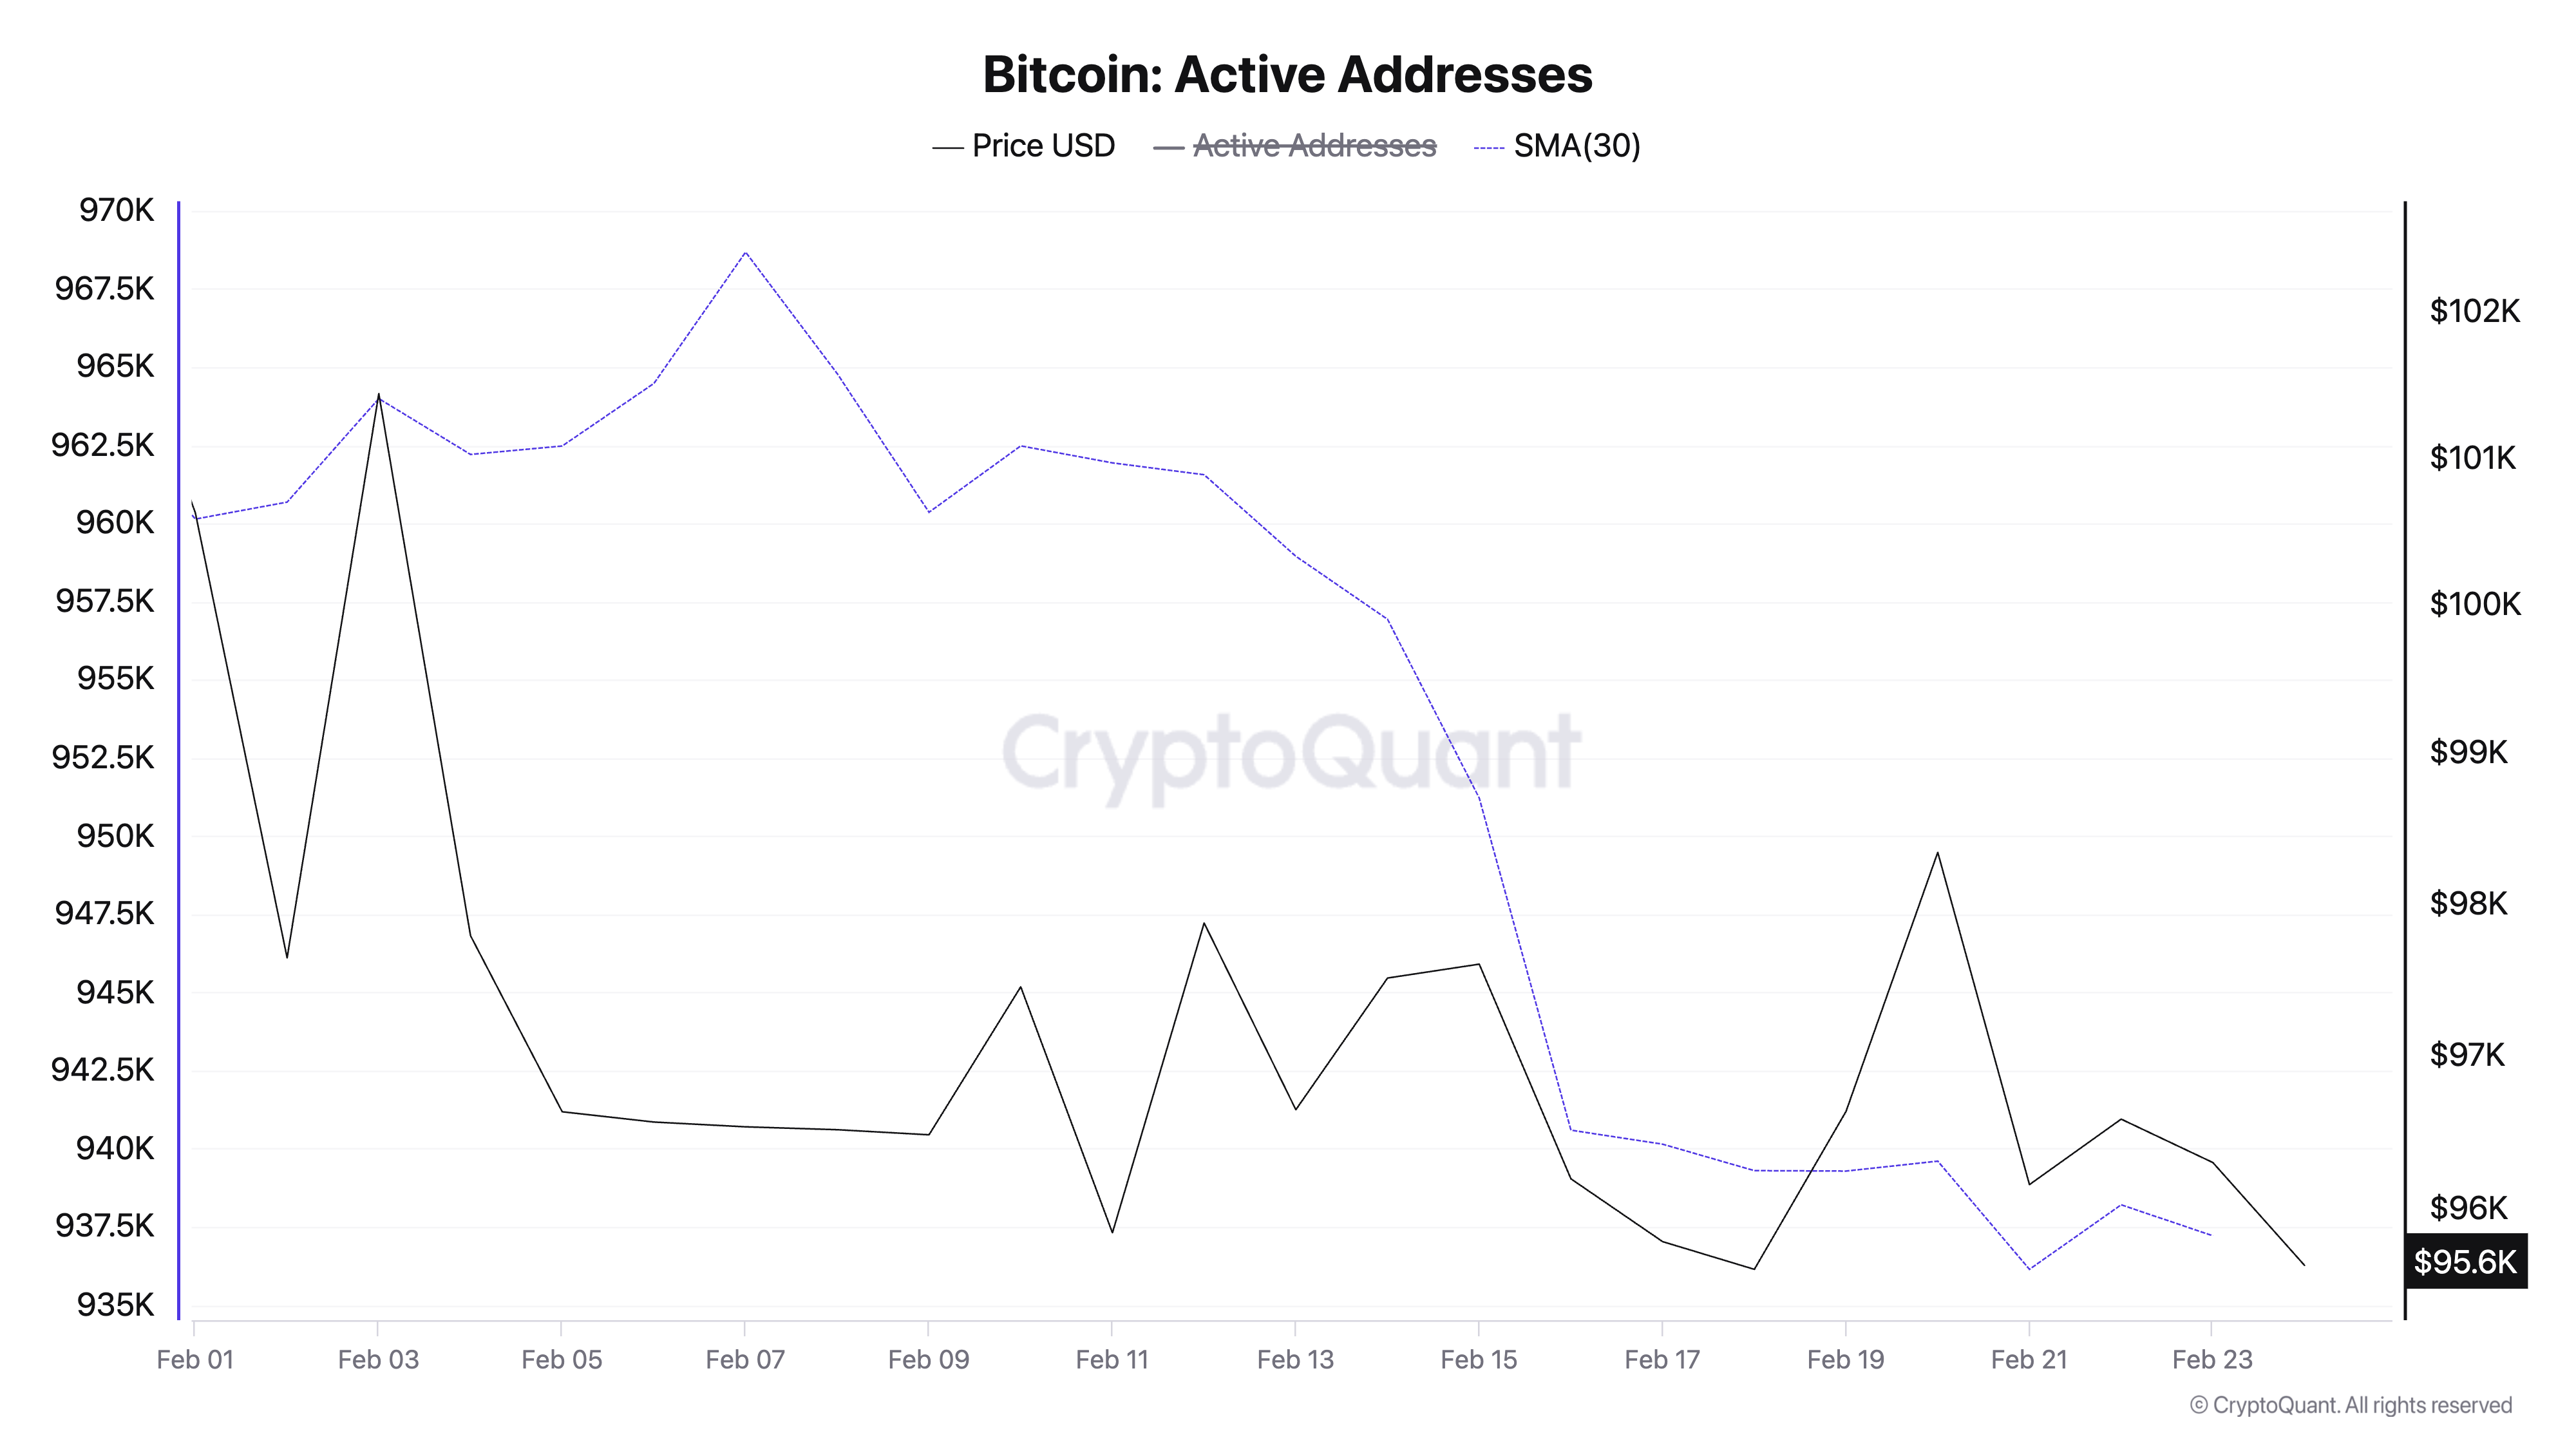
A decline in active daily wallets on the Bitcoin network signals reduced user demand. This can contribute to downward price pressure on the coin, as decreased network activity typically aligns with lower buying interest.
In addition, Avocado reports that “the number of UTXOs is also decreasing, with the magnitude of the decline similar to the correction period in September 2023.”
Unspent Transaction Output (UTXO) tracks the amount of Bitcoin left after a transaction, which can be used as input for future transactions. It represents the available balance that can be spent on the network. When the number of UTXOs declines, fewer new coins are being distributed or moved, suggesting reduced transaction activity. This indicates a period of consolidation, where investors are holding rather than spending their coins.
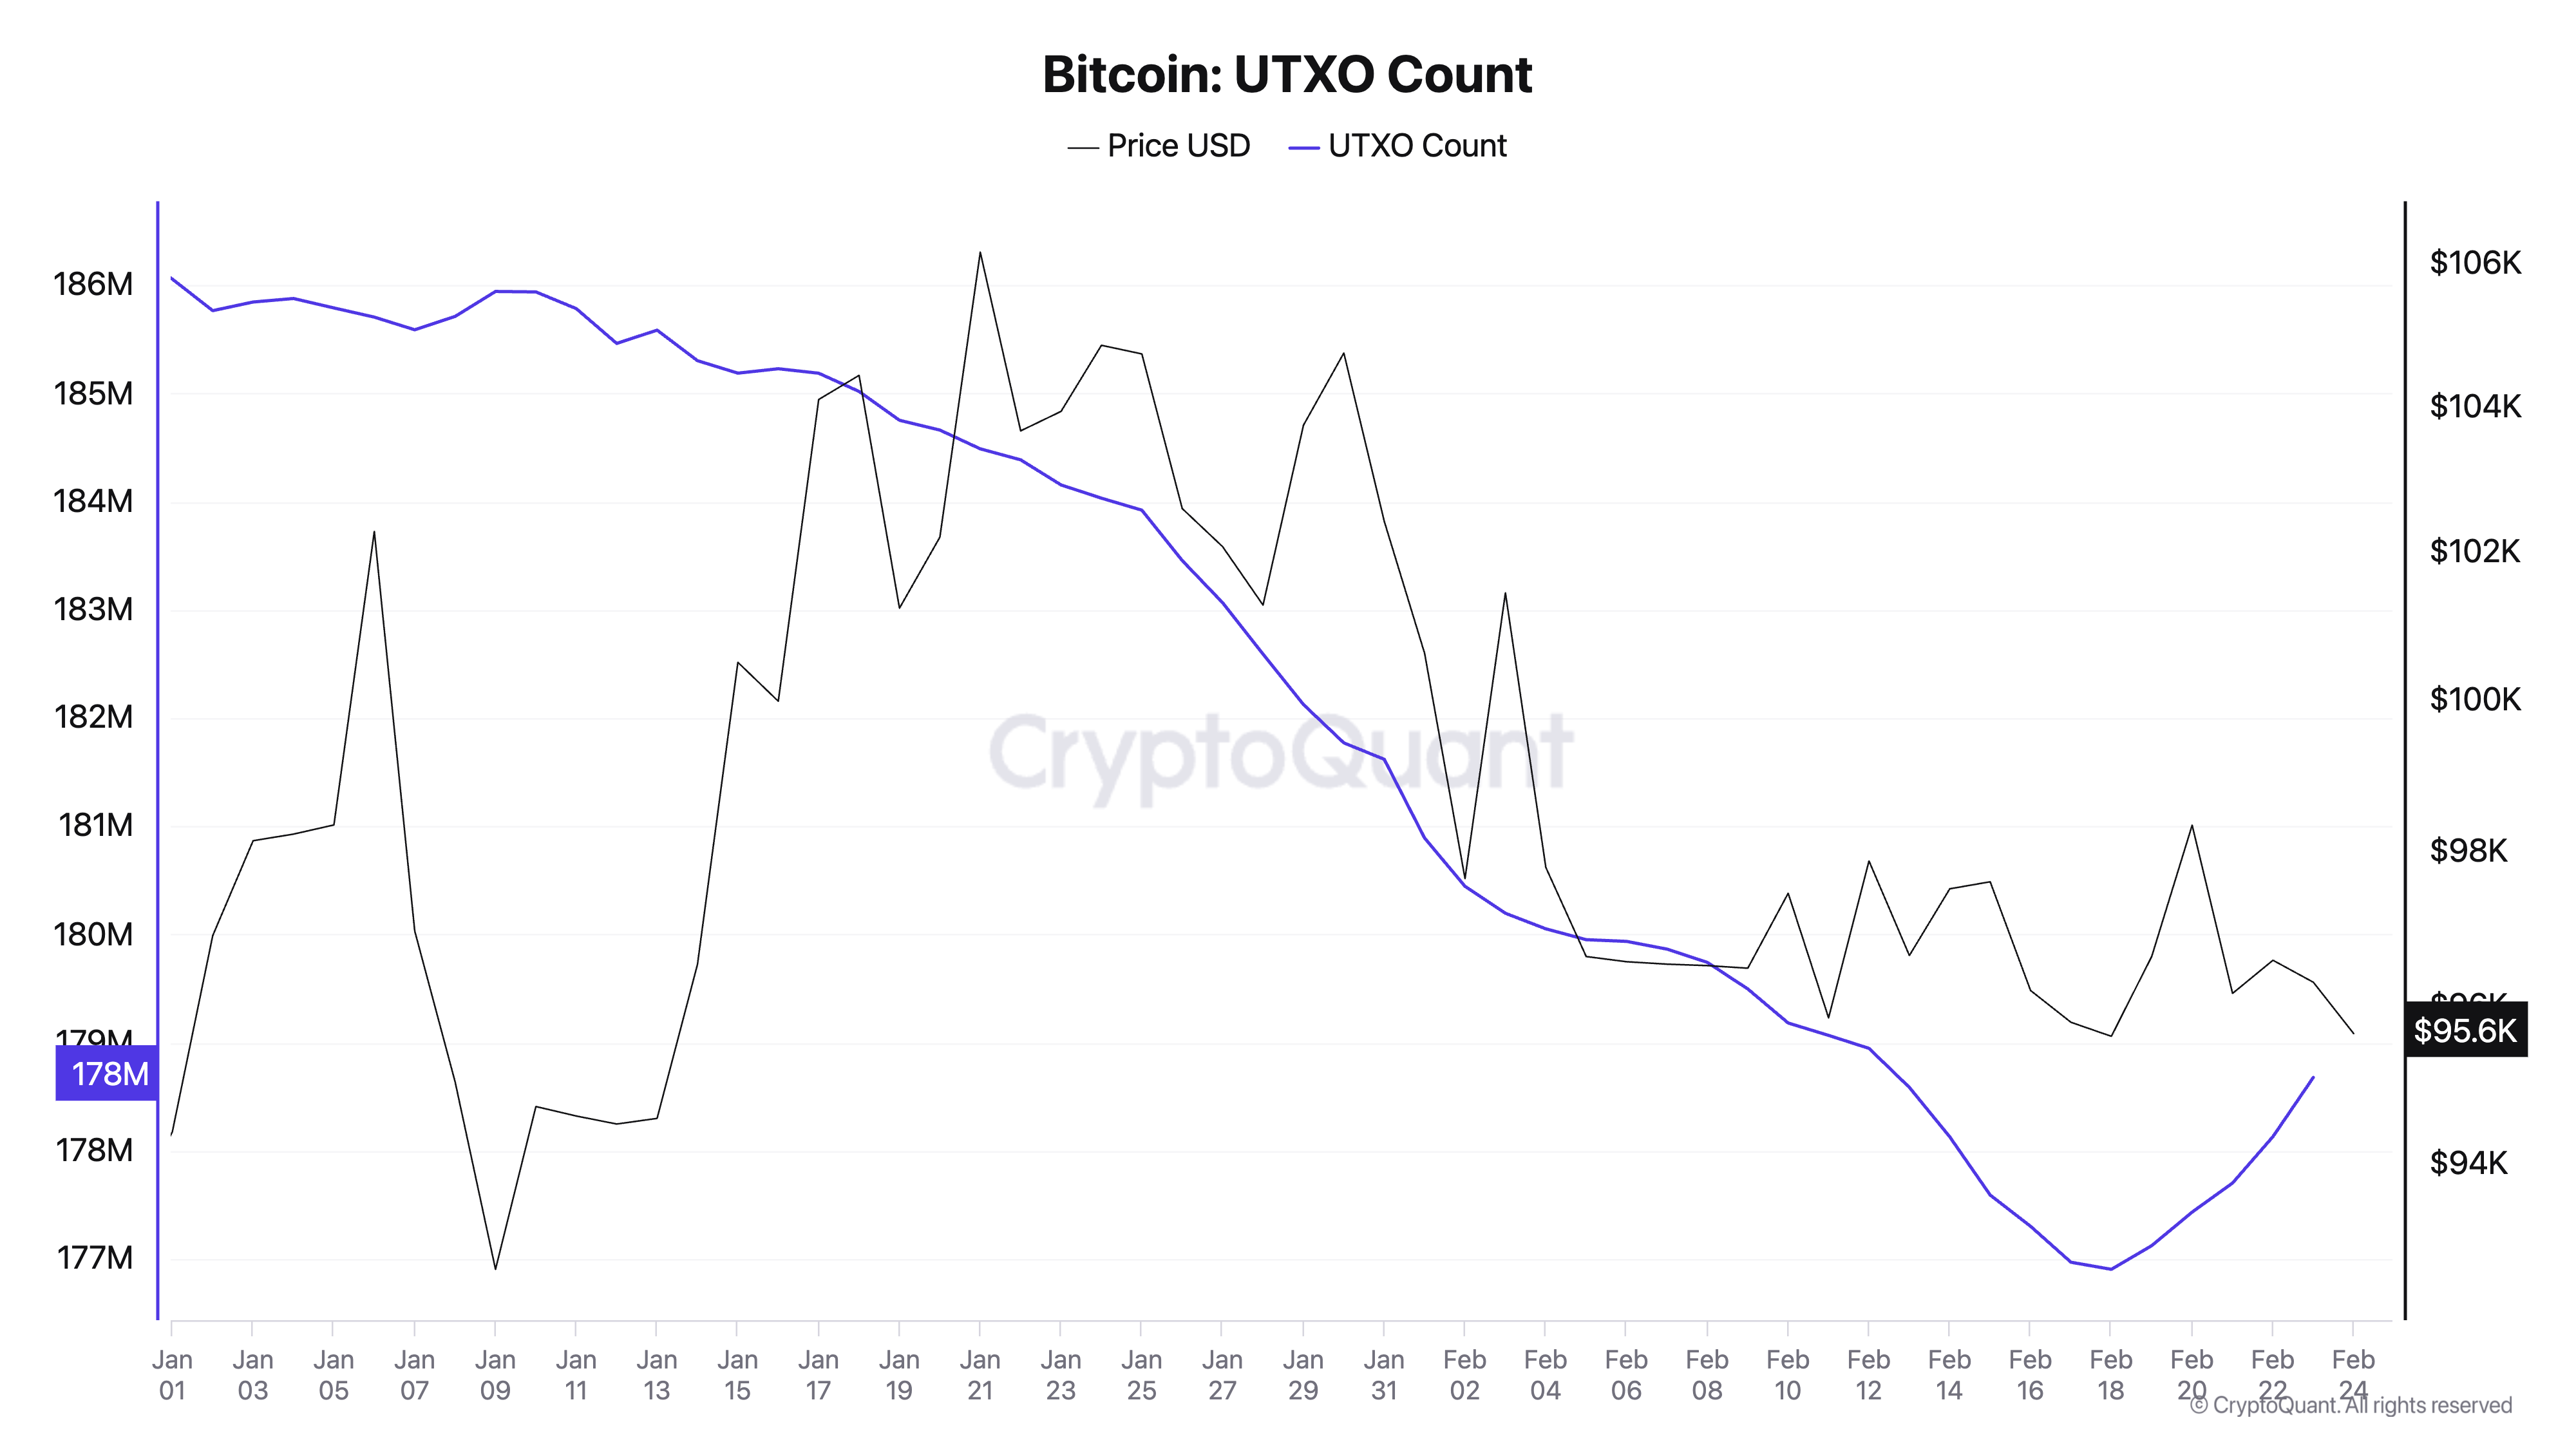
“If this trend continues, we could see signs of investor exodus similar to the market cycle peak of 2017. However, a simple decline in UTXOs alone is not enough to confirm the end of the current cycle, as other indicators still suggest a bullish outlook,” Avocado writes.
Bitcoin Hovers Near Key Support—Will It Hold or Break Lower?
As of this writing, BTC trades near the support line of its horizontal channel at $95,527. If the Bitcoin network activity wanes, further affecting the demand for the king coin, its price could break below this level. In this scenario, BTC could drop to $92,325.
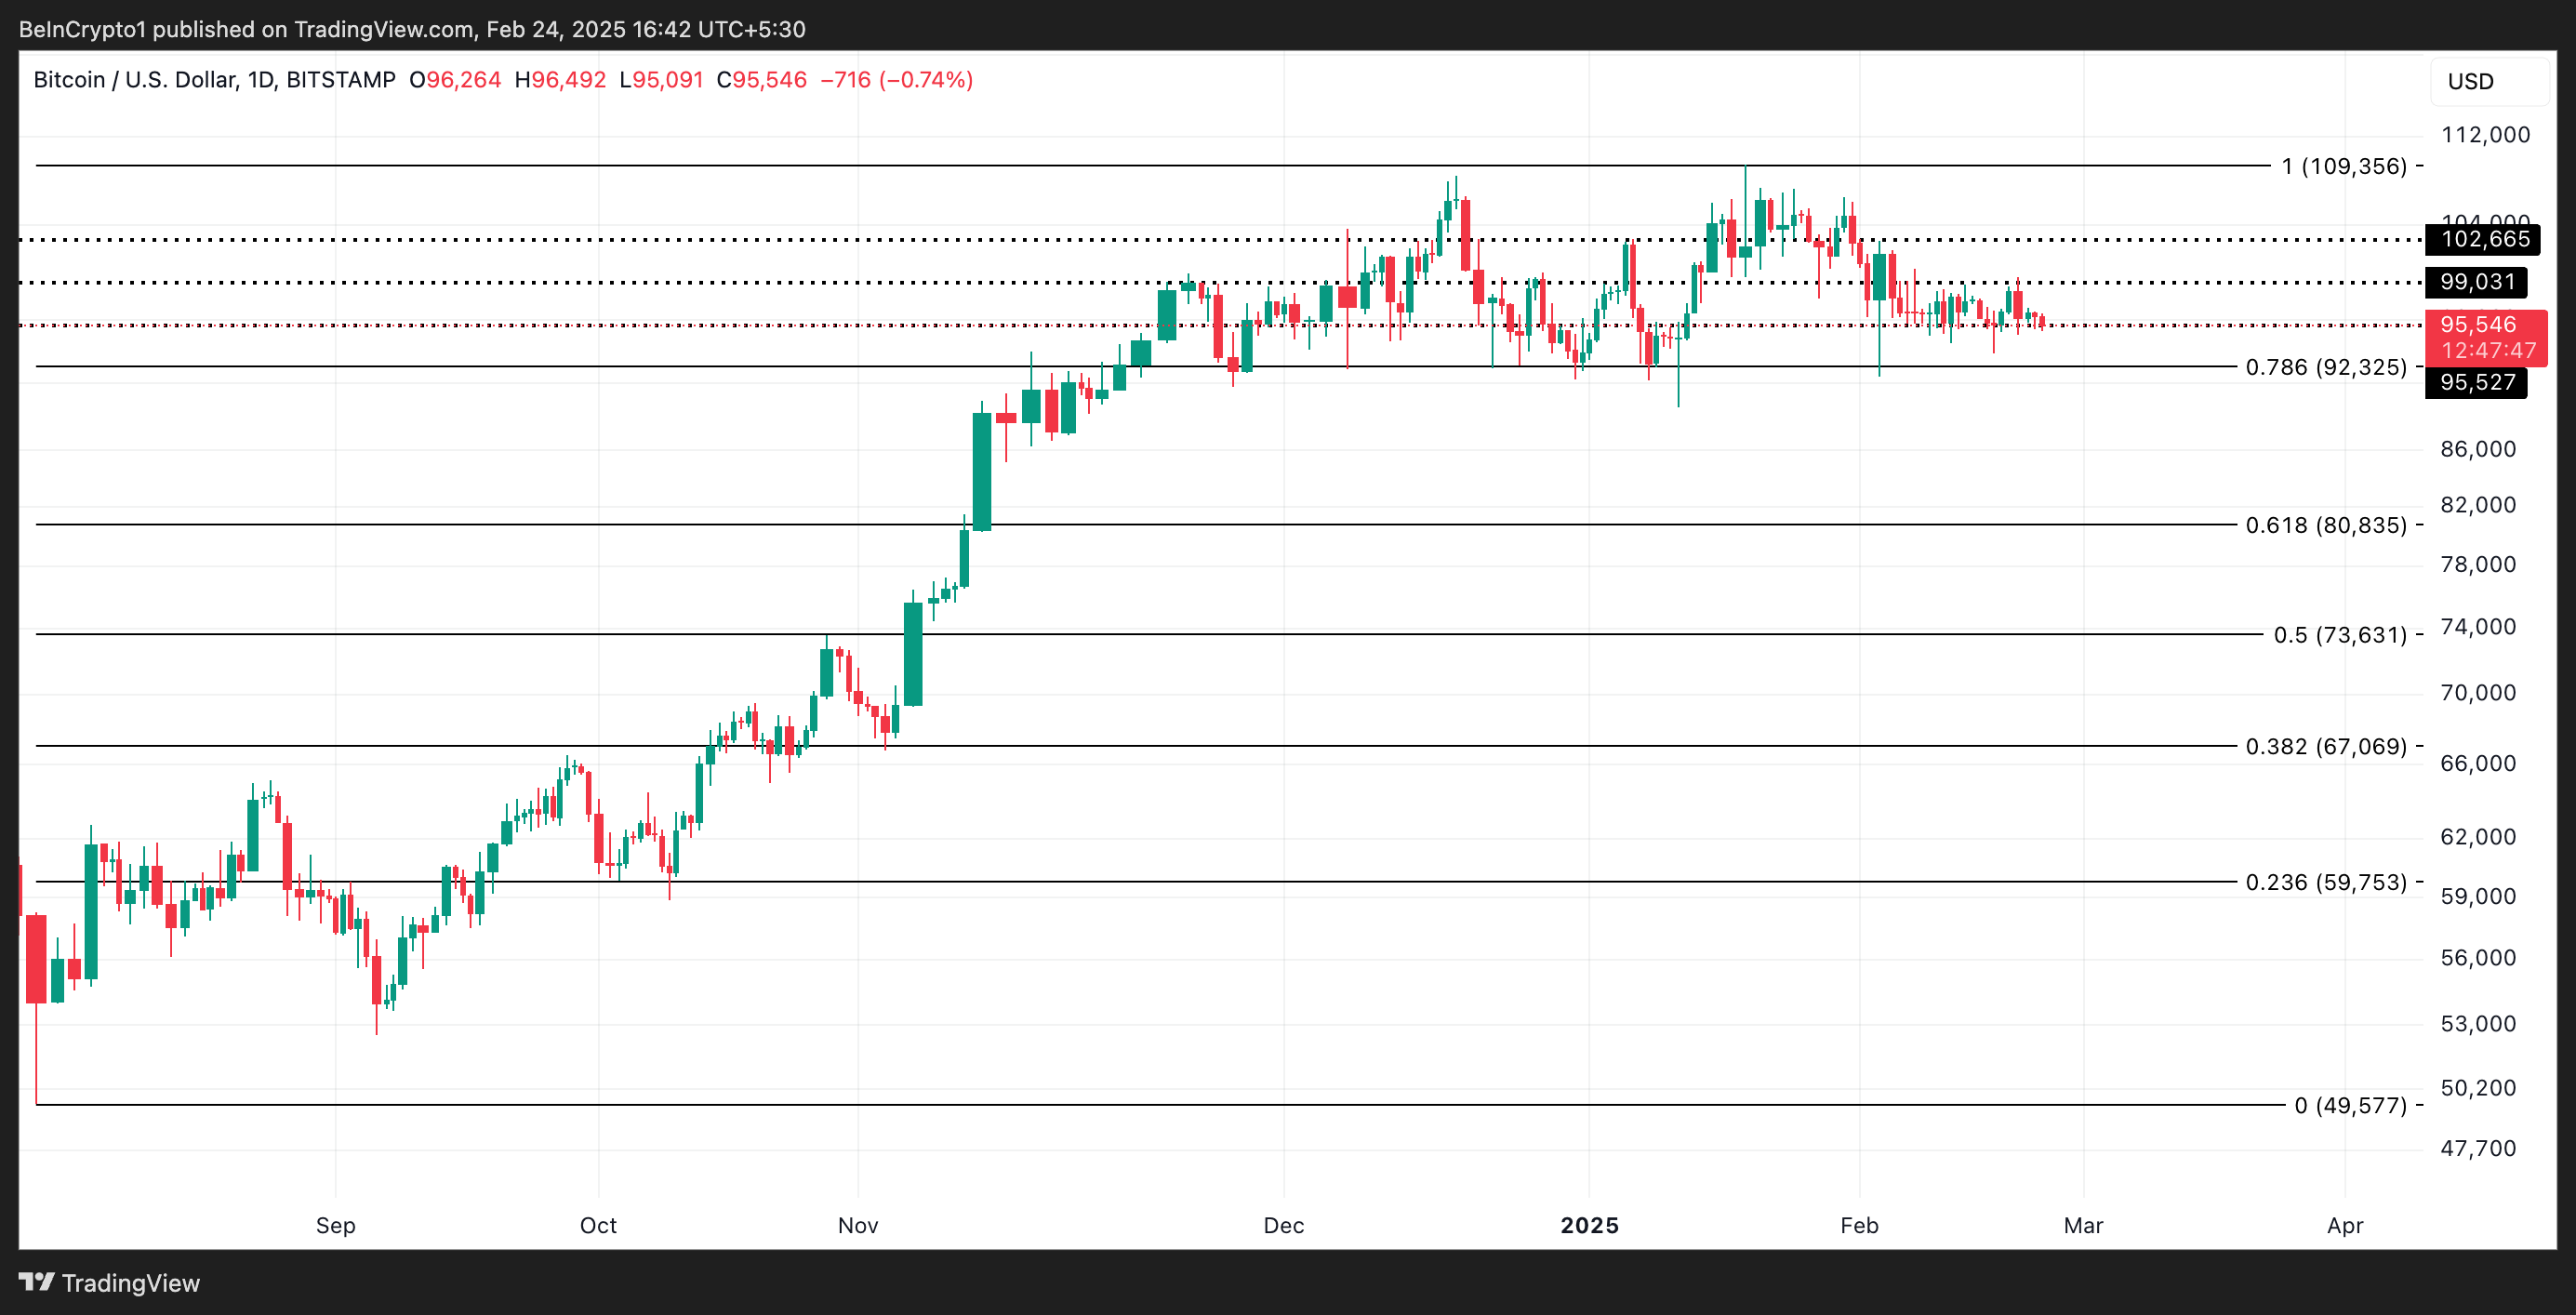
On the other hand, if market trends shift and the buying pressure gains momentum, the coin could rally toward the resistance at $99,031 and attempt a crossover. If successful, BTC could reach $102,665.
Disclaimer
In line with the Trust Project guidelines, this price analysis article is for informational purposes only and should not be considered financial or investment advice. BeInCrypto is committed to accurate, unbiased reporting, but market conditions are subject to change without notice. Always conduct your own research and consult with a professional before making any financial decisions. Please note that our Terms and Conditions, Privacy Policy, and Disclaimers have been updated.


Story (IP), Sonic (S), and Hyperliquid (HYPE) are the top three altcoins to watch for the last week of February. Story has surged by 140% in the past seven days, driven by its focus on programmable intellectual property, positioning it as a leading artificial intelligence coin.
Sonic, formerly known as Fantom, is up nearly 40% this week, showing strong bullish momentum after rebranding. Meanwhile, Hyperliquid remains highly profitable but faces bearish pressure due to market skepticism about its new HyperEVM, making all three altcoins crucial to watch as February ends.
Story (IP)
Story is one of the most trending new altcoins in the market. It is known for being a layer-1 chain that focuses on programmable intellectual property (IP).
The platform is built on the idea that IP is the world’s largest asset class and essential for the existence of artificial intelligence. After its launch, it has quickly become one of the biggest artificial intelligence altcoins in the market.
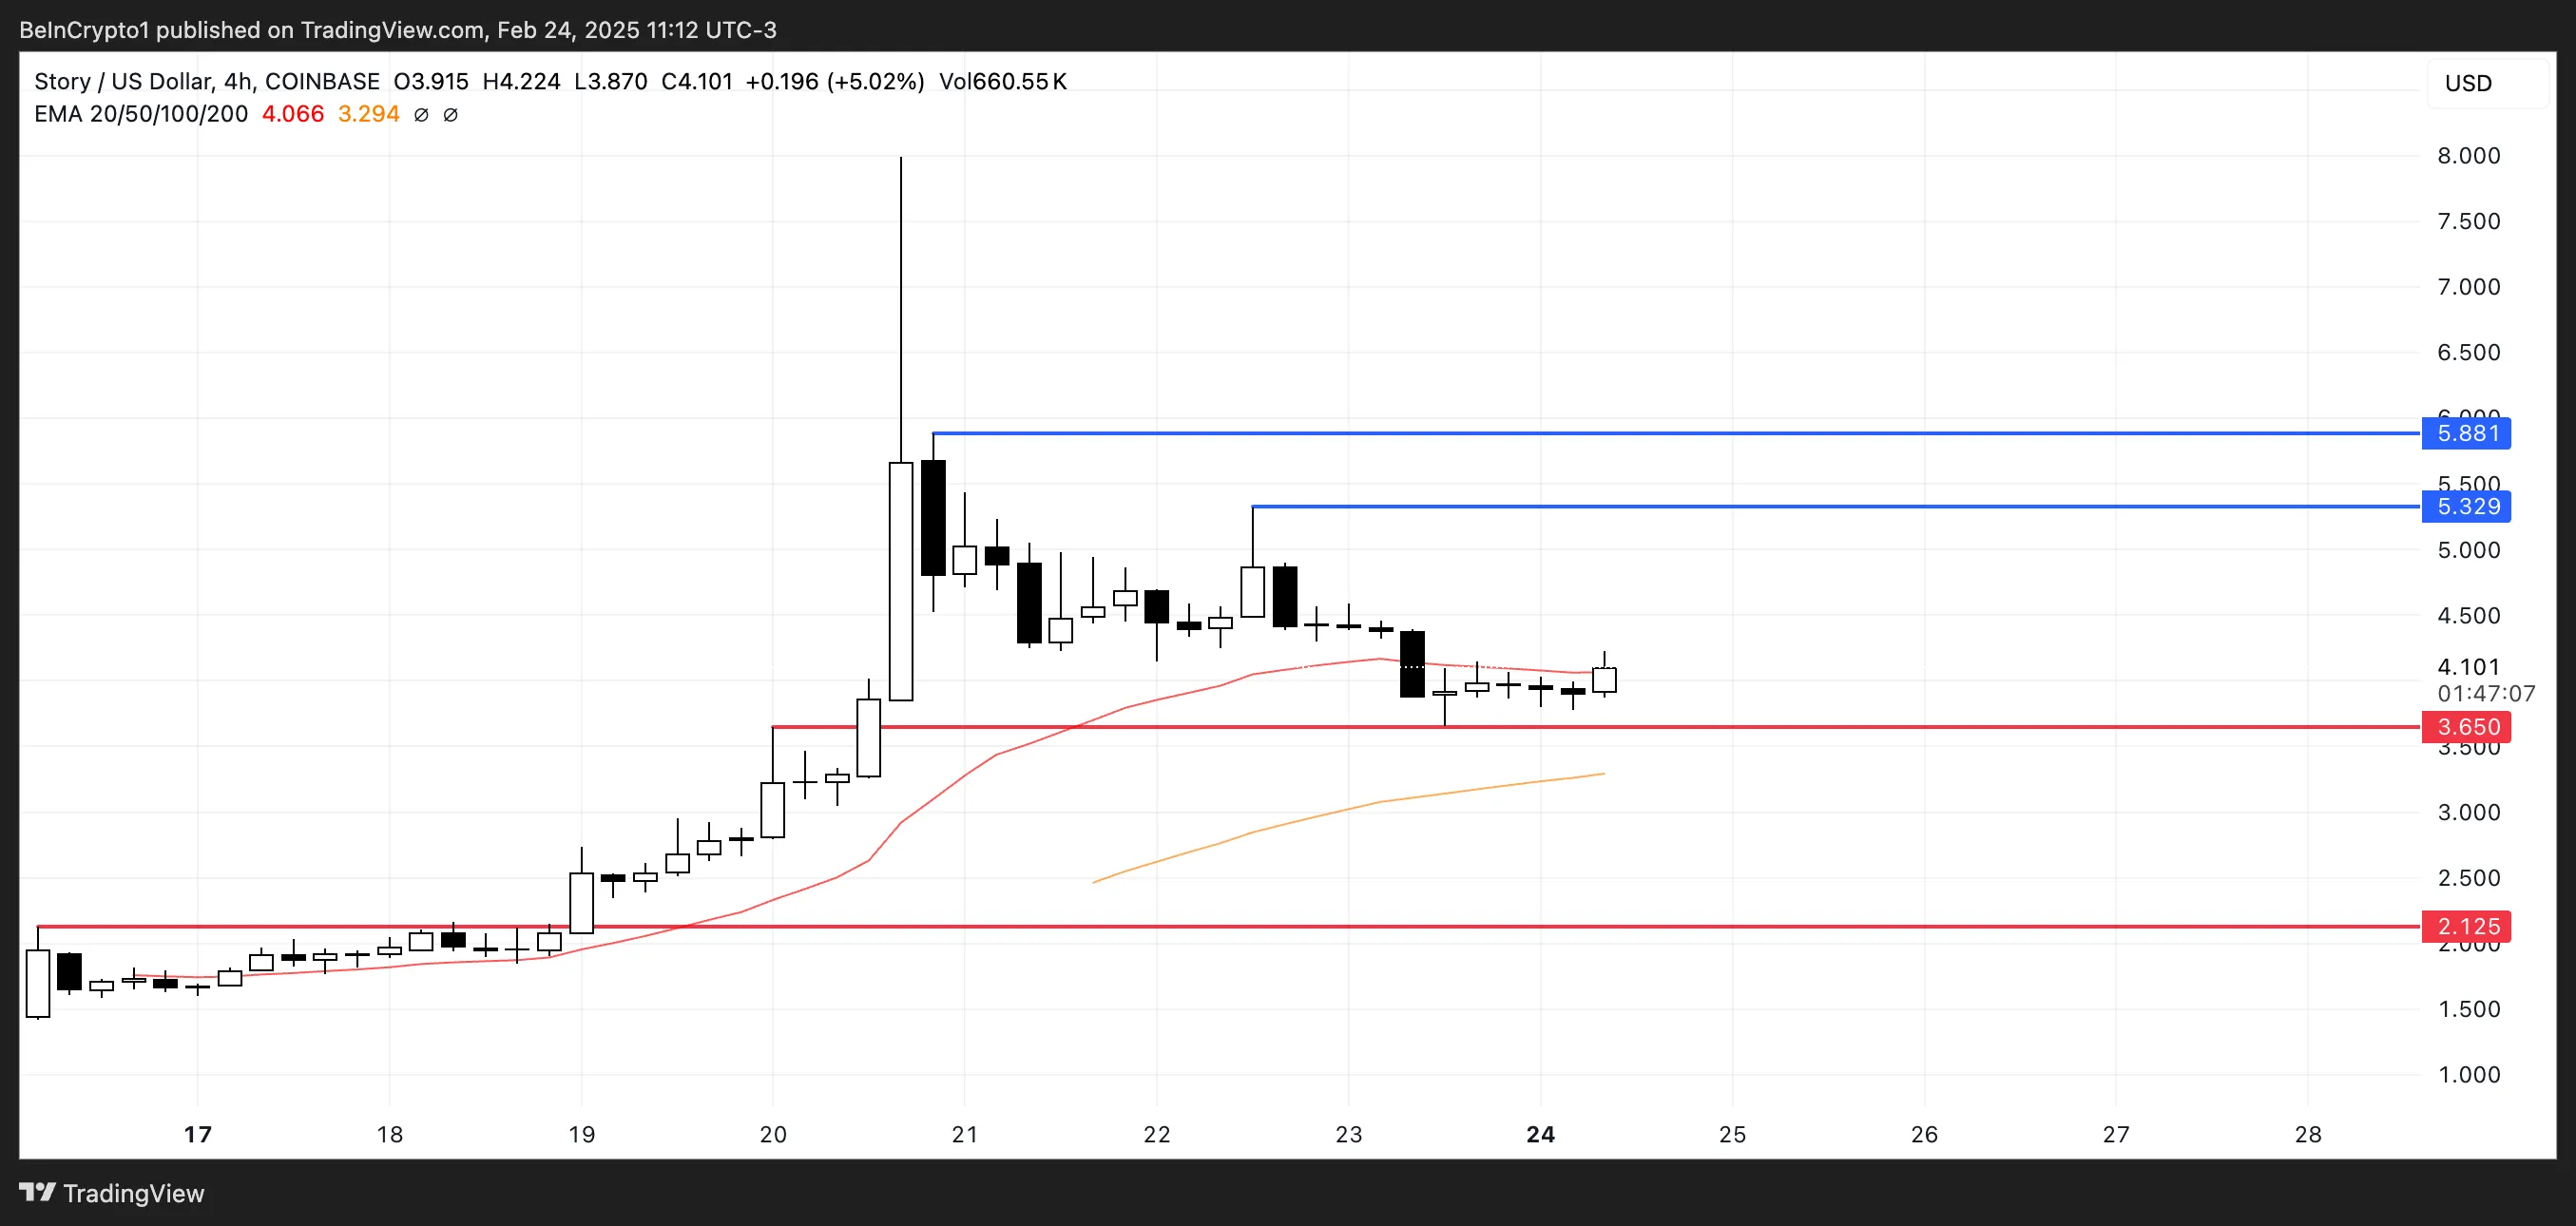
Story’s market cap is currently at $1 billion, and its price has surged by 140% in the last seven days, reflecting strong bullish momentum. If this trend continues, IP could test resistances at $5.32 and $5.88 soon, with the potential to rise above $6 or even $7.
However, the IP is currently in a correction phase, and if the downward movement persists, it could test the support at $3.65. A break below this level could push the price as low as $2.12, highlighting the importance of maintaining bullish momentum to sustain its recent gains.
Sonic (S)
Sonic, formerly known as Fantom, has been trending in the last few weeks, showing strong bullish momentum. Its price is up almost 40% in the last seven days and 55% in the last 30 days, pushing its market cap to $2.4 billion. S reached $0.97 on February 21, one of its highest levels ever.
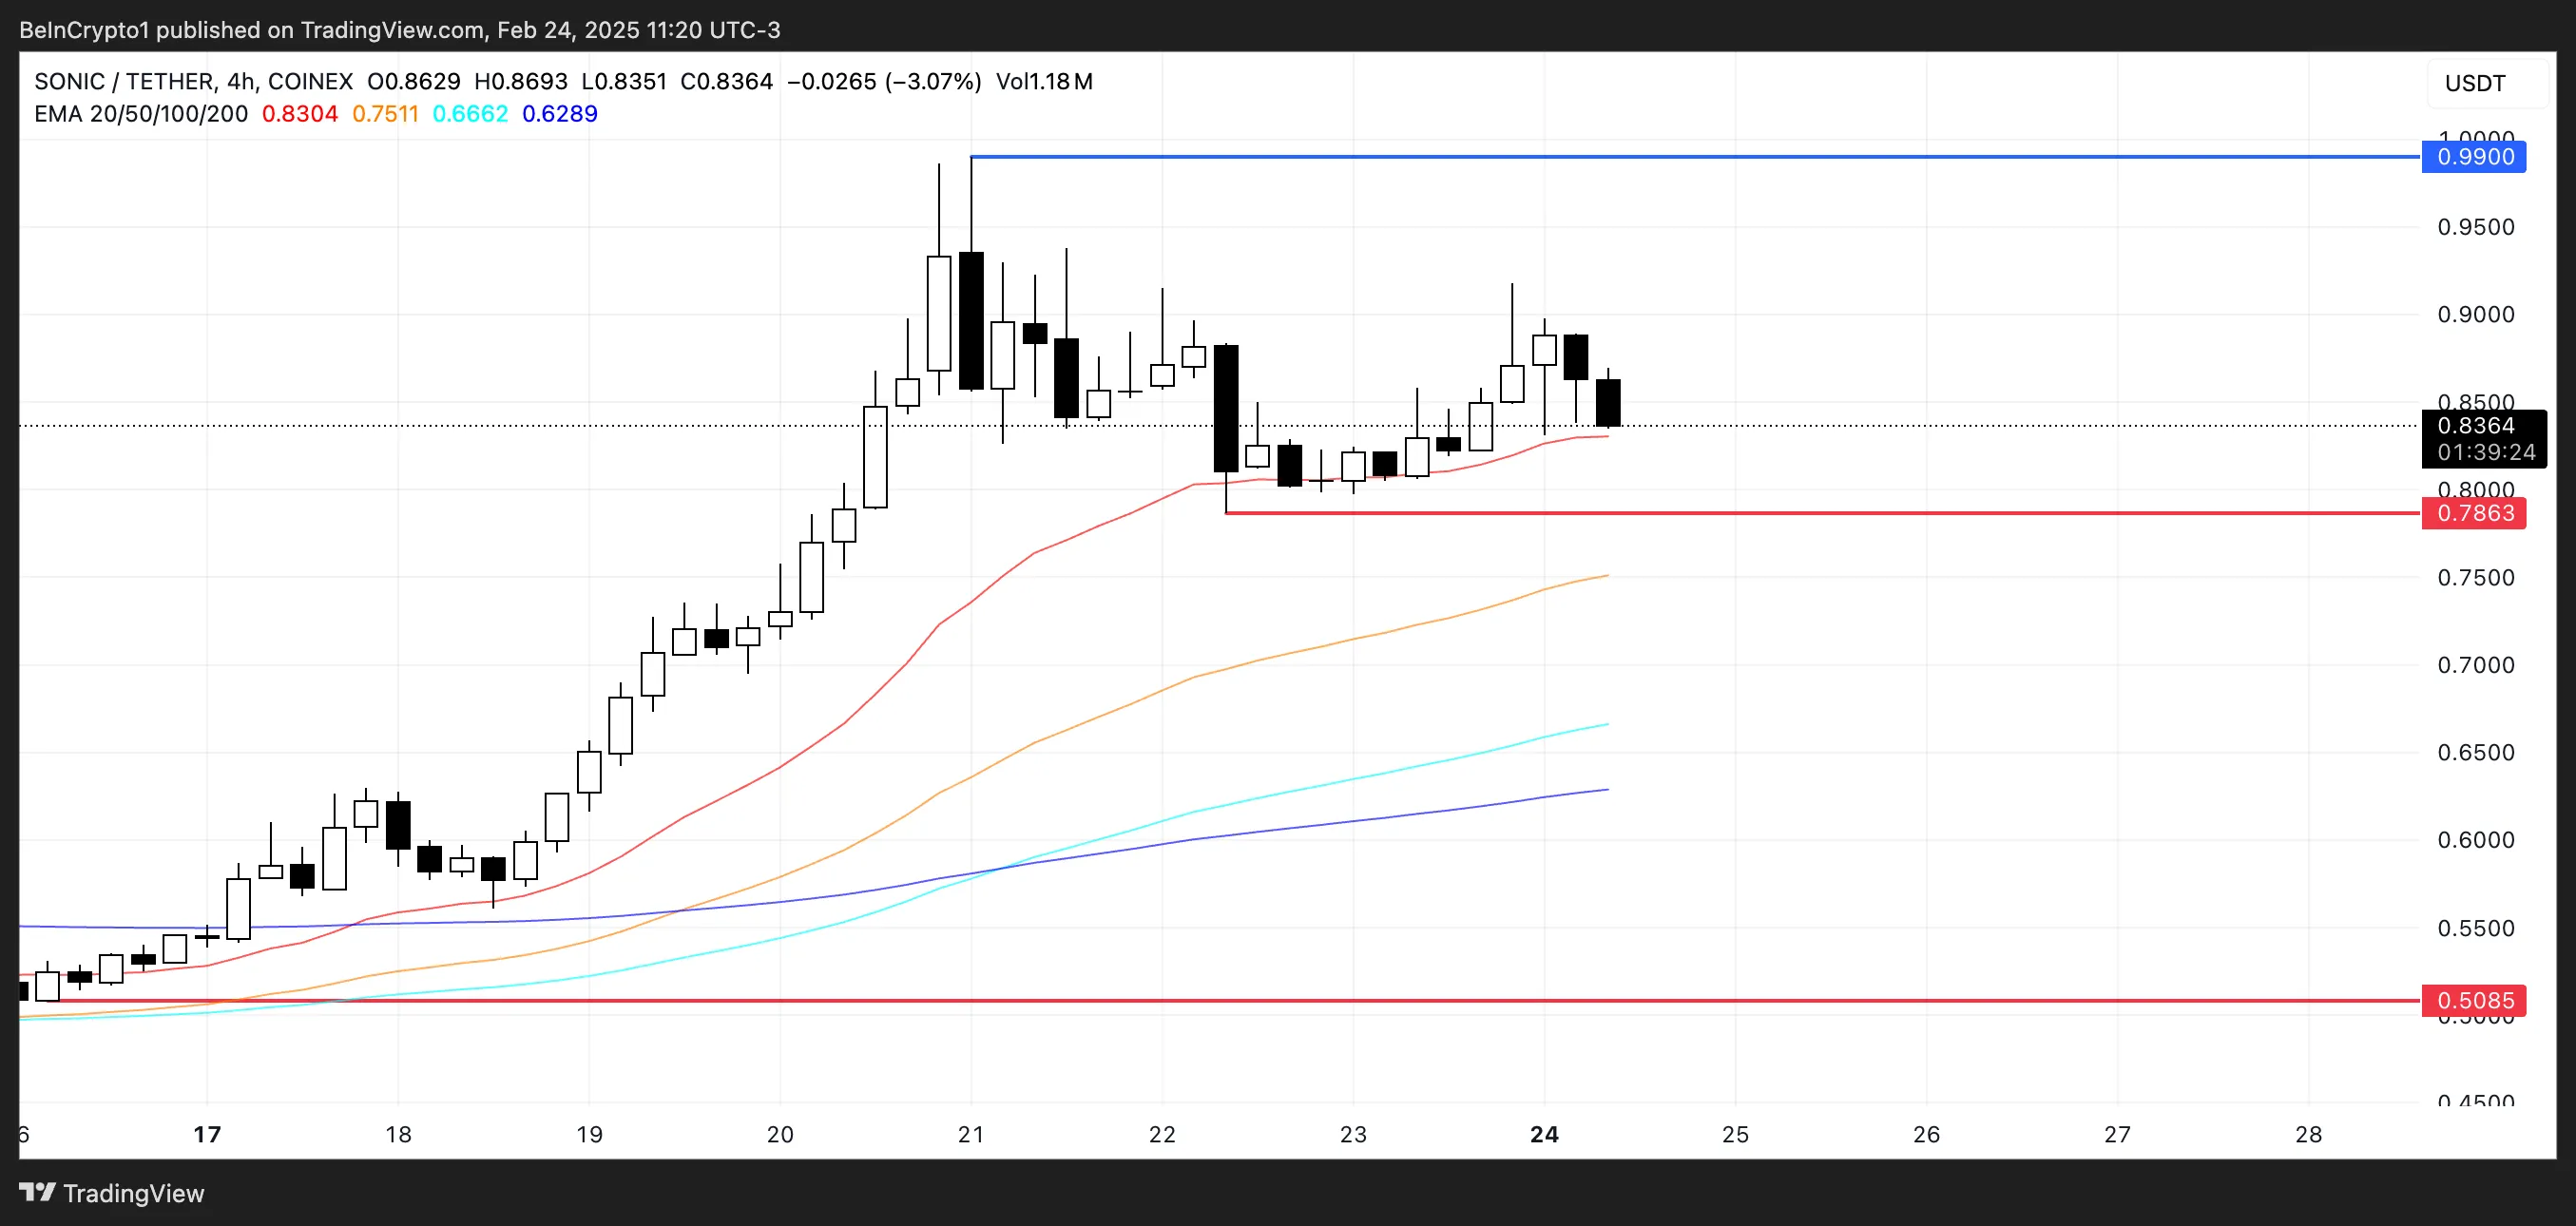
If this positive momentum continues, Sonic could rise to test levels close to $1 again, potentially breaking above $1 for the first time ever and setting new all-time highs.
However, if the trend reverses, Sonic could test the support at $0.78, and if that level fails to hold, it could drop as low as $0.50.
Hyperliquid (HYPE)
Hyperliquid remains one of the most profitable businesses in crypto, generating $9.15 million in fees over the last seven days.
However, its token, HYPE, is not reflecting this success, having dropped more than 10% in the last 24 hours and 18% in the past seven days. The market appears skeptical about HyperEVM, which Hyperliquid announced last week, contributing to the recent downtrend.
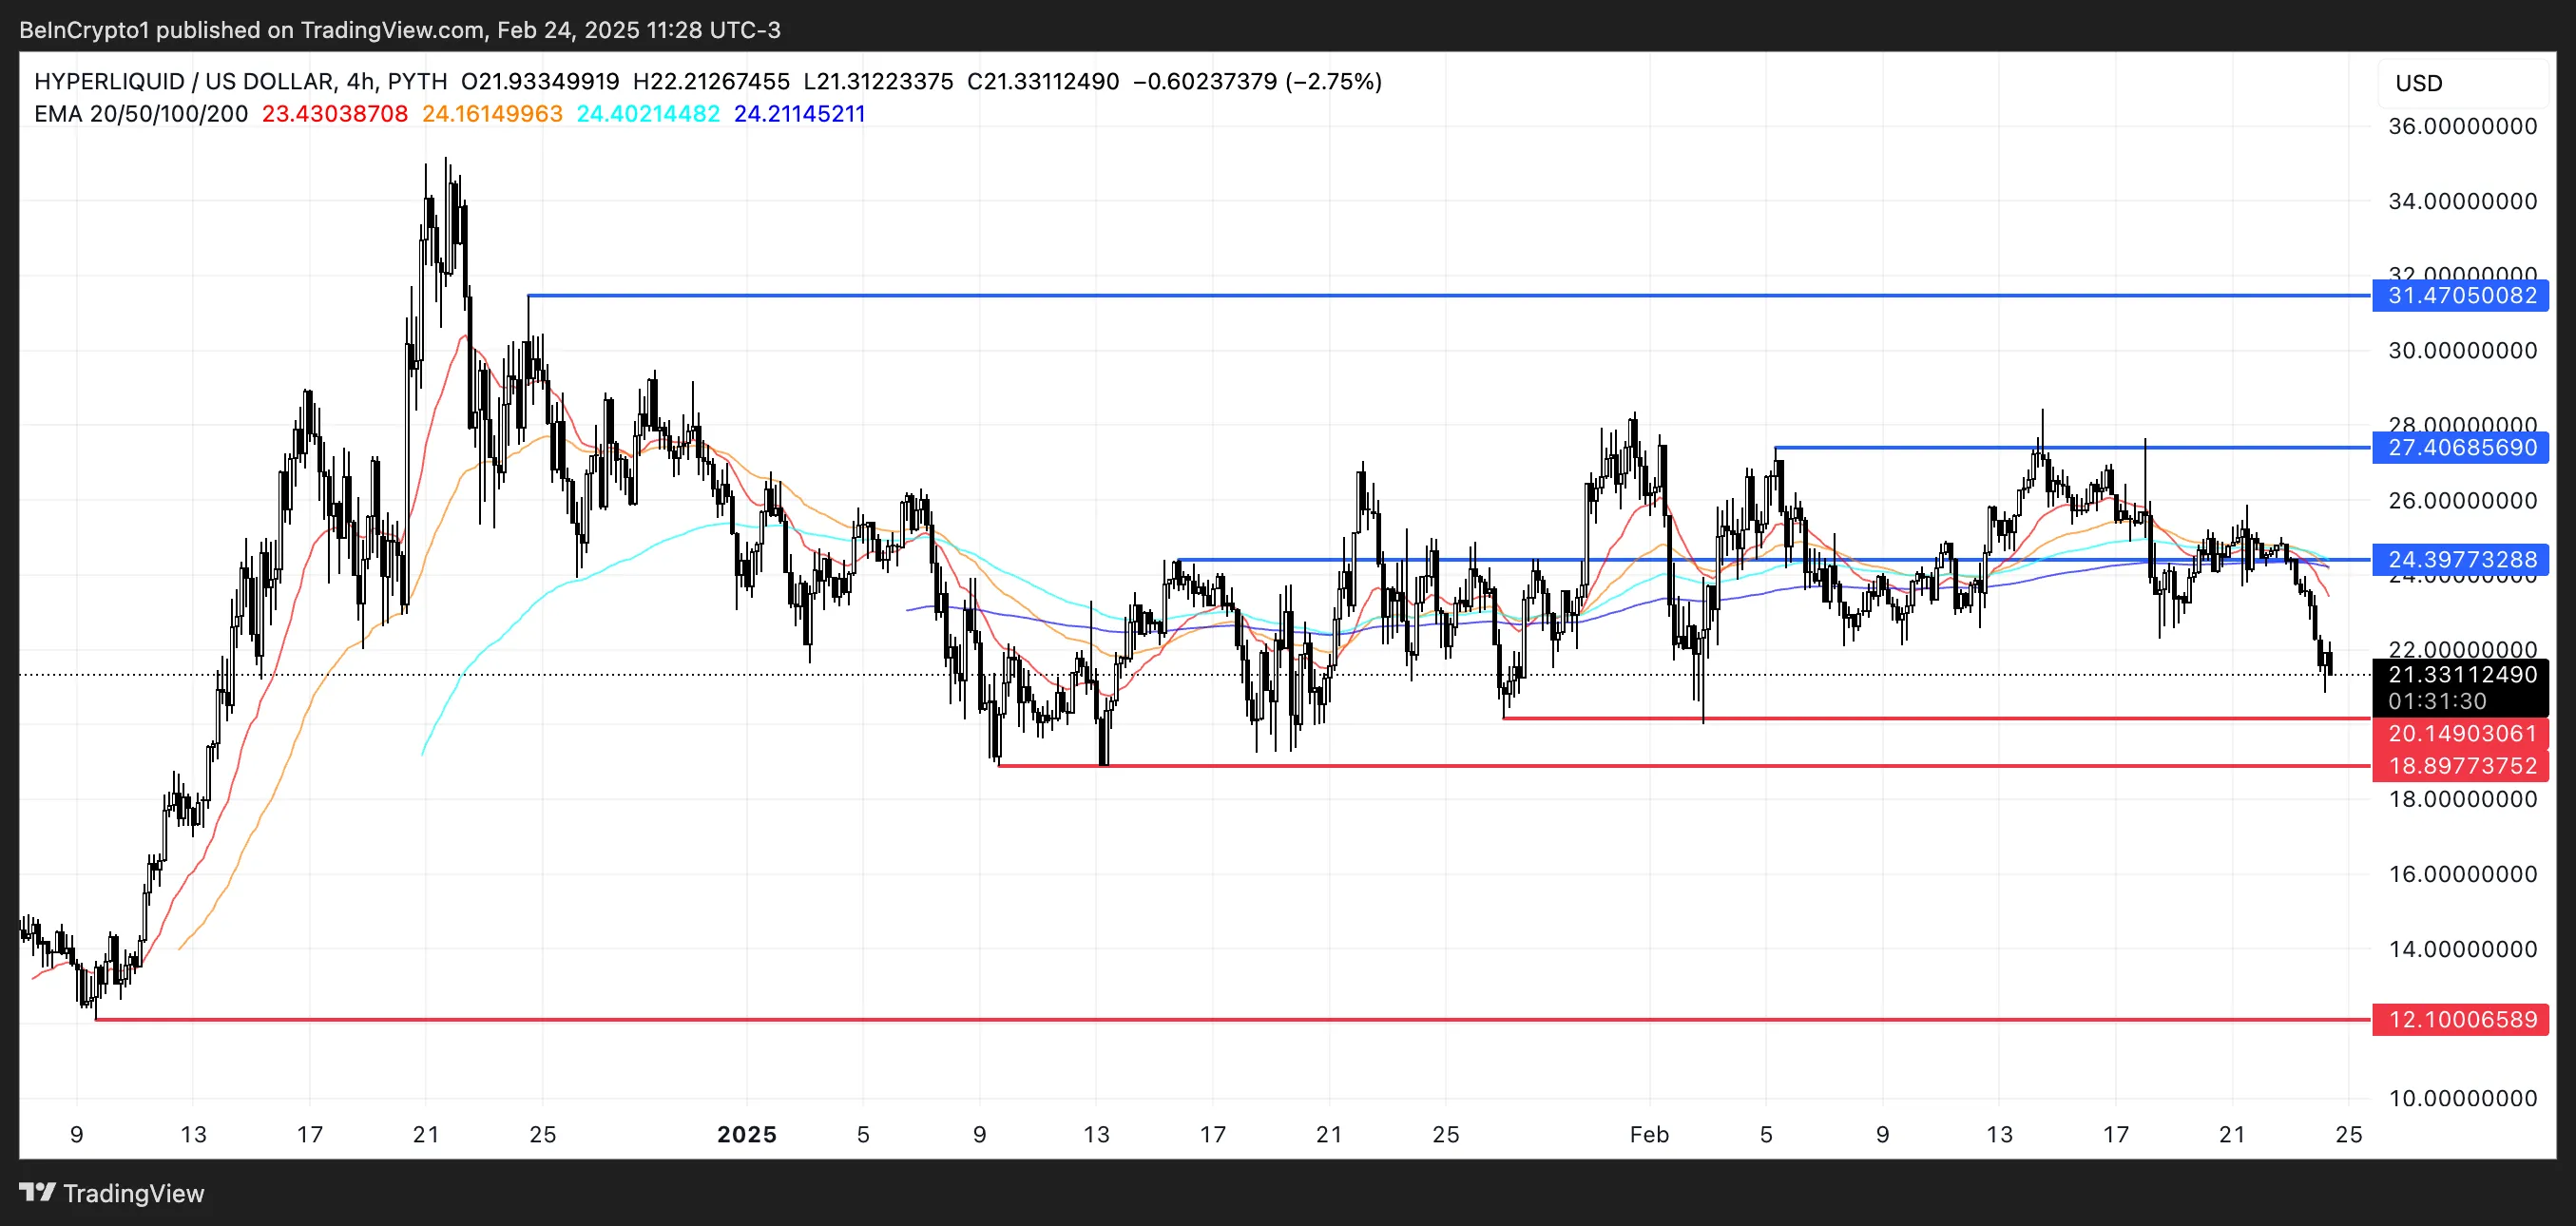
If this bearish momentum continues, HYPE could test two crucial supports at $20.1 and $18.8. A break below these levels could push the price down to $12.1, marking its lowest point since mid-December 2024.
Conversely, if sentiment reverses, Hyperliquid could test the resistance at $24.3, and a break above that could lead to $27.4.
If HyperEVM gains traction and attention returns to the chain, HYPE could rise to $31.4, potentially breaking above $30 for the first time in two months.
Disclaimer
In line with the Trust Project guidelines, this price analysis article is for informational purposes only and should not be considered financial or investment advice. BeInCrypto is committed to accurate, unbiased reporting, but market conditions are subject to change without notice. Always conduct your own research and consult with a professional before making any financial decisions. Please note that our Terms and Conditions, Privacy Policy, and Disclaimers have been updated.
Strategy (formerly MicroStrategy) just bought 20,356 more Bitcoin, per an announcement from Michael Saylor. This is the company’s largest purchase in over two months, but its stock price has been dropping.
Strategy has been funding these acquisitions through multibillion-dollar stock sales, which are apparently shaking confidence in the company. If Bitcoin’s own price doldrums continue, it could have a severely negative impact on the firm.
Saylor Keeps Buying Bitcoin
Strategy, which recently rebranded from MicroStrategy, has once again extended its lead as one of the world’s largest Bitcoin holders. Earlier today, the firm completed a $2 billion stock offering, and Michael Saylor just announced that the proceeds are being used on Bitcoin acquisitions.
“Strategy has acquired 20,356 BTC for $1.99 billion at $97,514 per bitcoin and has achieved BTC Yield of 6.9% YTD 2025. As of February 23, we hold 499,096 BTC acquired for ~$33.1 billion at ~$66,357 per bitcoin,” Saylor claimed.
Today’s acquisition is the firm’s largest purchase in over two months. Despite the outward bullish appearance, however, some concerns are beginning to surface.
Saylor has continued these massive Bitcoin purchases for months, but there were multiple significant pauses in February. Despite the latest purchase, the company’s stock MSTR has underperformed so far this year.
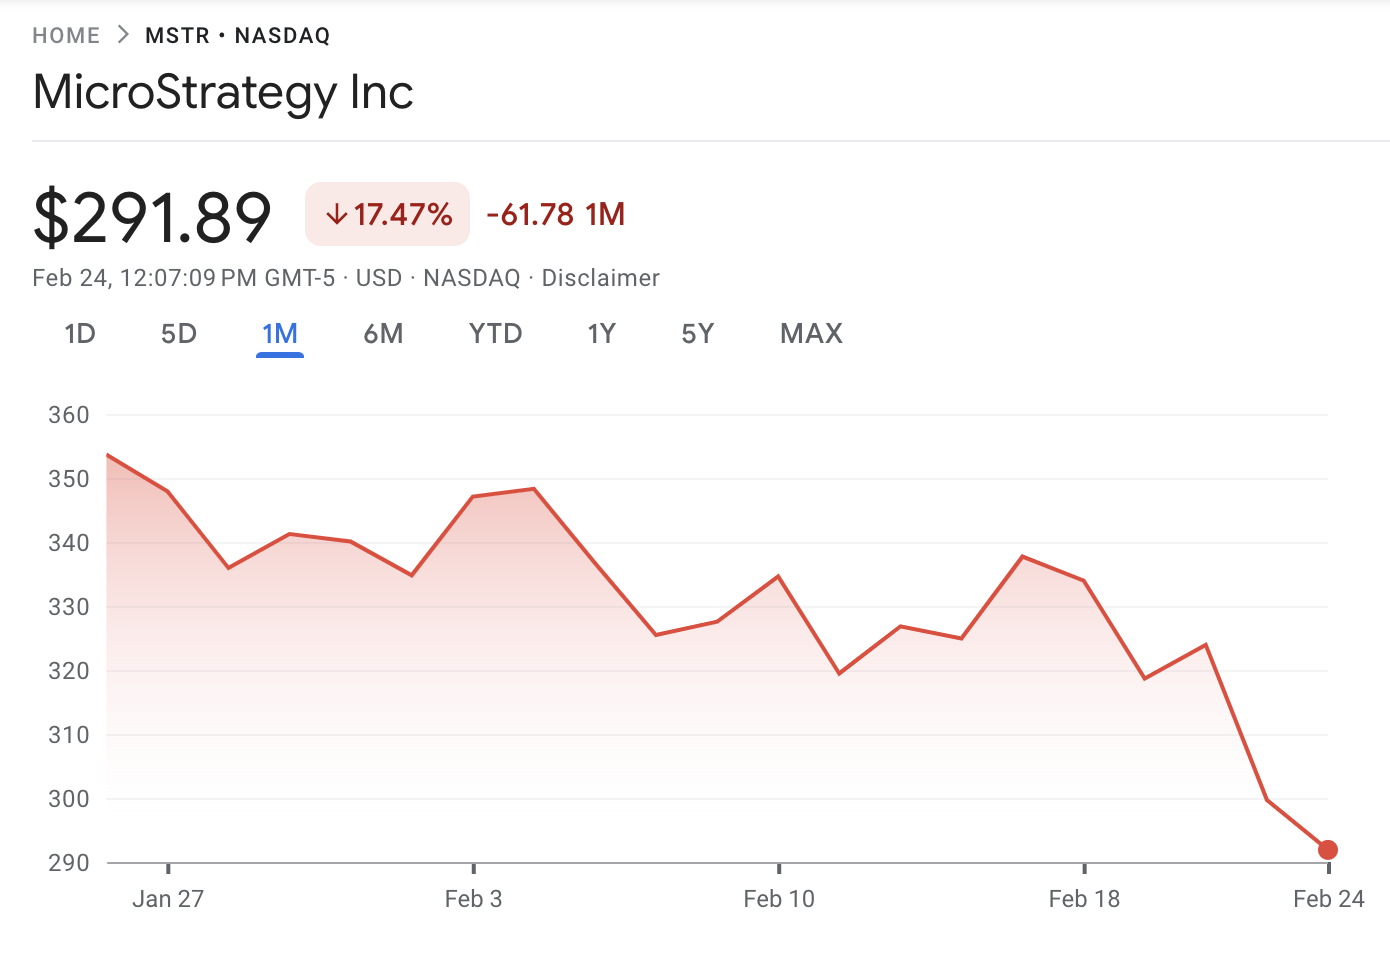
There are likely a few reasons why MSTR has seen a decline in the stock market. Last year, MicroStrategy’s stock performance showed a clear correlation with Bitcoin’s market growth.
However, Bitcoin’s own price has suffered recently thanks to bearish market conditions, and this hasn’t helped Saylor’s company.
More to the point, these massive stock sales are impacting Strategy itself. For example, the firm carried out another $2 billion sale in January, and today’s sale included another optional offering of up to $300 million.
Strategy also launched a new perpetual security, diversifying its offerings. BlackRock alone holds 5% of the company, a clear signifier of how much stock the firm has sold.
Rumors have been building that these Bitcoin purchases may be creating a tax dilemma, and Saylor seems content to keep plowing ahead with acquisitions.
Overall, Saylor is still looking at the long term. Offloading huge quantities of shares is visibly impacting MSTR. Yet, this could significantly change when Bitcoin enters another bullish cycle.
Previously, BeInCrypto analysts noted that BTC supply on exchanges has plummeted to 2.5 million, which means a supply shock is imminent. MicroStrategy or Strategy’s continued purchases could add to this pressure.
Disclaimer
In adherence to the Trust Project guidelines, BeInCrypto is committed to unbiased, transparent reporting. This news article aims to provide accurate, timely information. However, readers are advised to verify facts independently and consult with a professional before making any decisions based on this content. Please note that our Terms and Conditions, Privacy Policy, and Disclaimers have been updated.

Onyxcoin (XCN) is down 19% in the last seven days and over 35% in the past 30 days, reflecting strong bearish momentum. Its market cap reached $1.4 billion on January 26 but has since dropped to $572 million.
Despite a brief recovery, its RSI has now fallen to 41.8, signaling weakened buying interest. With the ADX at 25.2 confirming a strong downtrend, XCN faces critical support at $0.014, while a potential reversal could target resistance at $0.0229 and beyond if bullish momentum returns.
Onyxcoin RSI Is Down After Reaching 55
XCN’s RSI is currently at 41.8, after rising from 29.6 two days ago to 55.4 yesterday, indicating increased volatility in market momentum. RSI, or Relative Strength Index, is a momentum oscillator that measures the speed and change of price movements, ranging from 0 to 100.
An RSI above 70 suggests an asset is overbought, indicating potential selling pressure. Meanwhile, an RSI below 30 suggests it is oversold, potentially signaling buying opportunities. An RSI between 30 and 70 is generally considered neutral, reflecting normal market fluctuations.
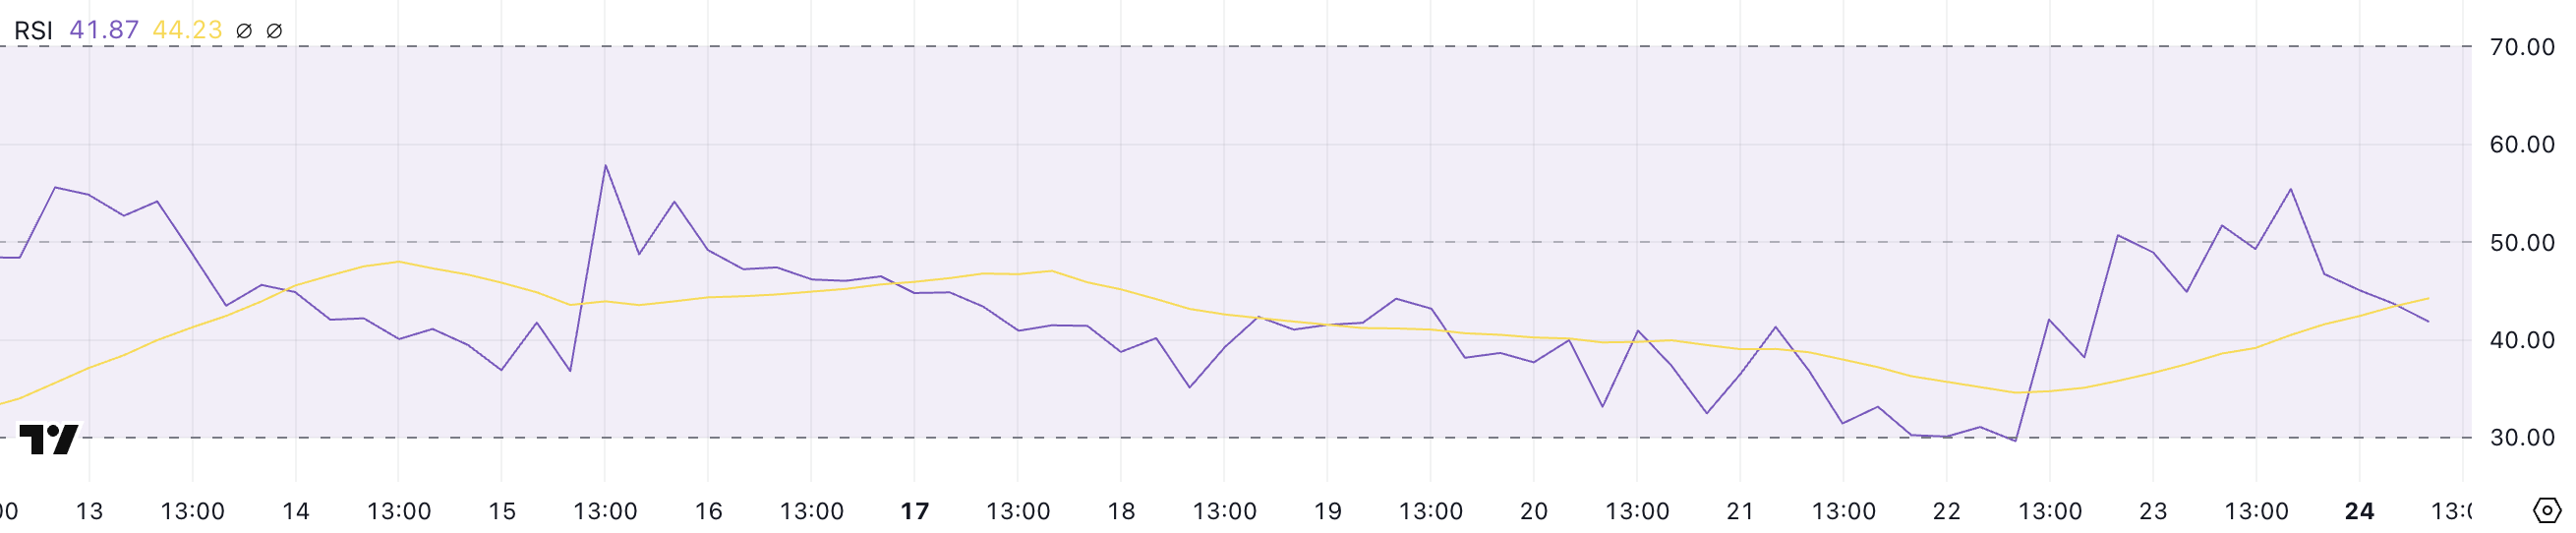
XCN’s RSI dropping from 55.4 to 41.8 after a sharp rise from 29.6 indicates a shift from bullish to bearish sentiment. This decline suggests that buying momentum has weakened, increasing selling pressure. If the RSI continues to fall toward 30, the altcoin could face further downward movement.
However, if the RSI stabilizes above 40, it could indicate consolidation before the next price move.
XCN ADX Shows the Downtrend Is Still Strong
XCN’s ADX is currently at 25.2, rising from 13.9 three days ago and peaking at 27 a few hours ago, indicating a strengthening trend. The Average Directional Index (ADX) measures the strength of a trend without indicating its direction, ranging from 0 to 100.
An ADX below 20 suggests a weak or non-existent trend, while a value above 25 indicates a strong trend. A rising ADX confirms increasing trend strength, regardless of whether the price is moving up or down.
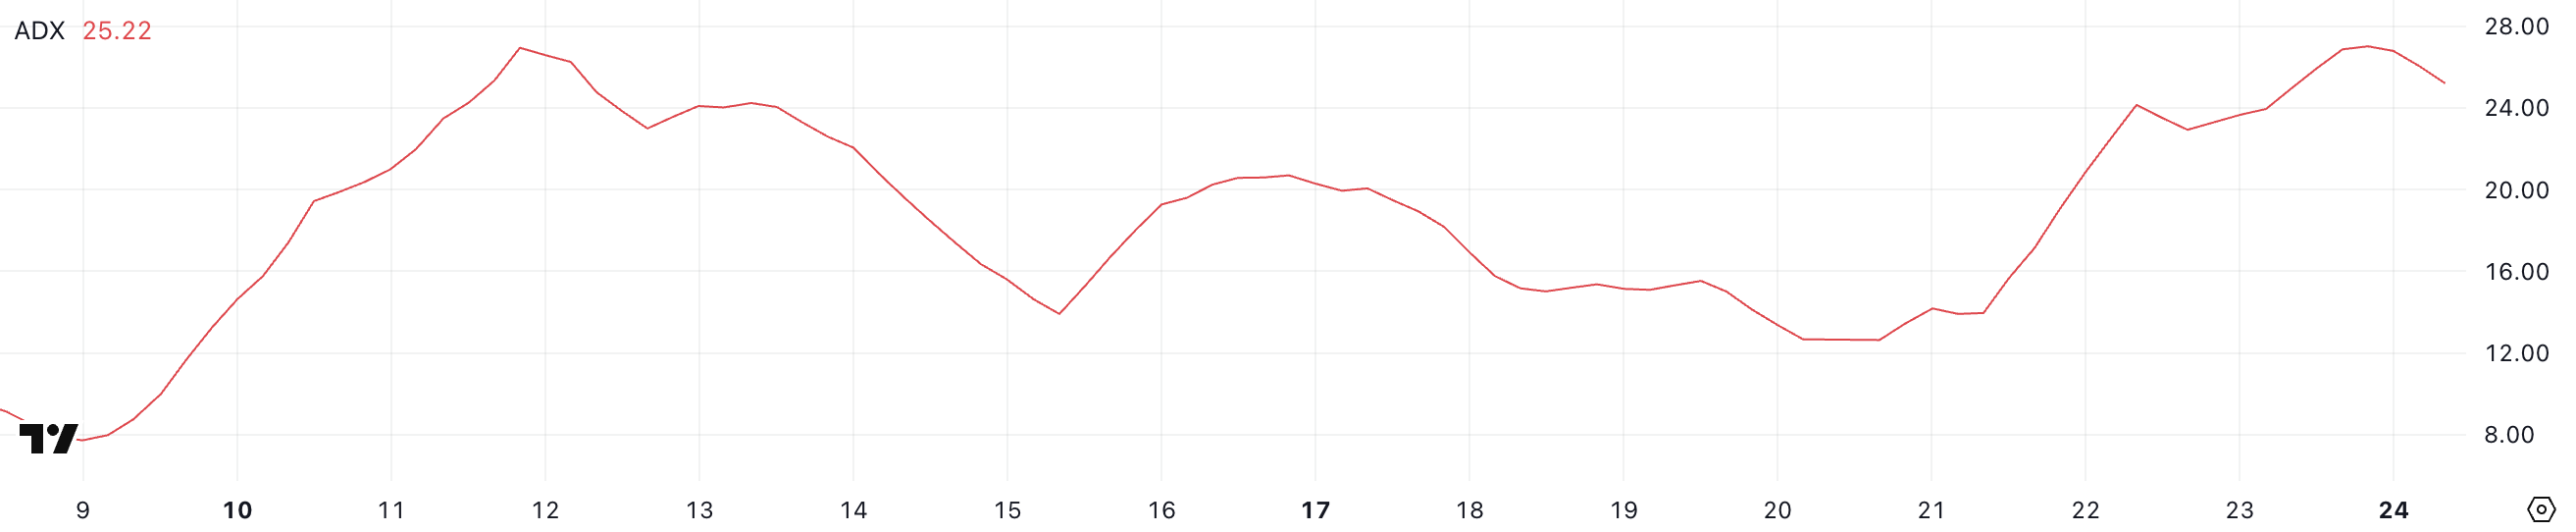
With XCN currently in a downtrend, an ADX of 25.2 indicates that selling pressure is still strong, potentially leading to further price declines. If the ADX keeps above 25, it would confirm the downtrend’s momentum.
Conversely, if the ADX starts to decline, it could indicate weakening bearish pressure and the possibility of consolidation. The current ADX level signals caution, as the downtrend shows no signs of reversal yet.
Can Onyxcoin Recover The Good Momentum From The End of January?
If the downtrend continues, XCN could test the support at $0.014, a critical level that could determine its next move.
A break below this support would indicate increased selling pressure, potentially pushing Onyxcoin price below $0.010 for the first time since mid-January.
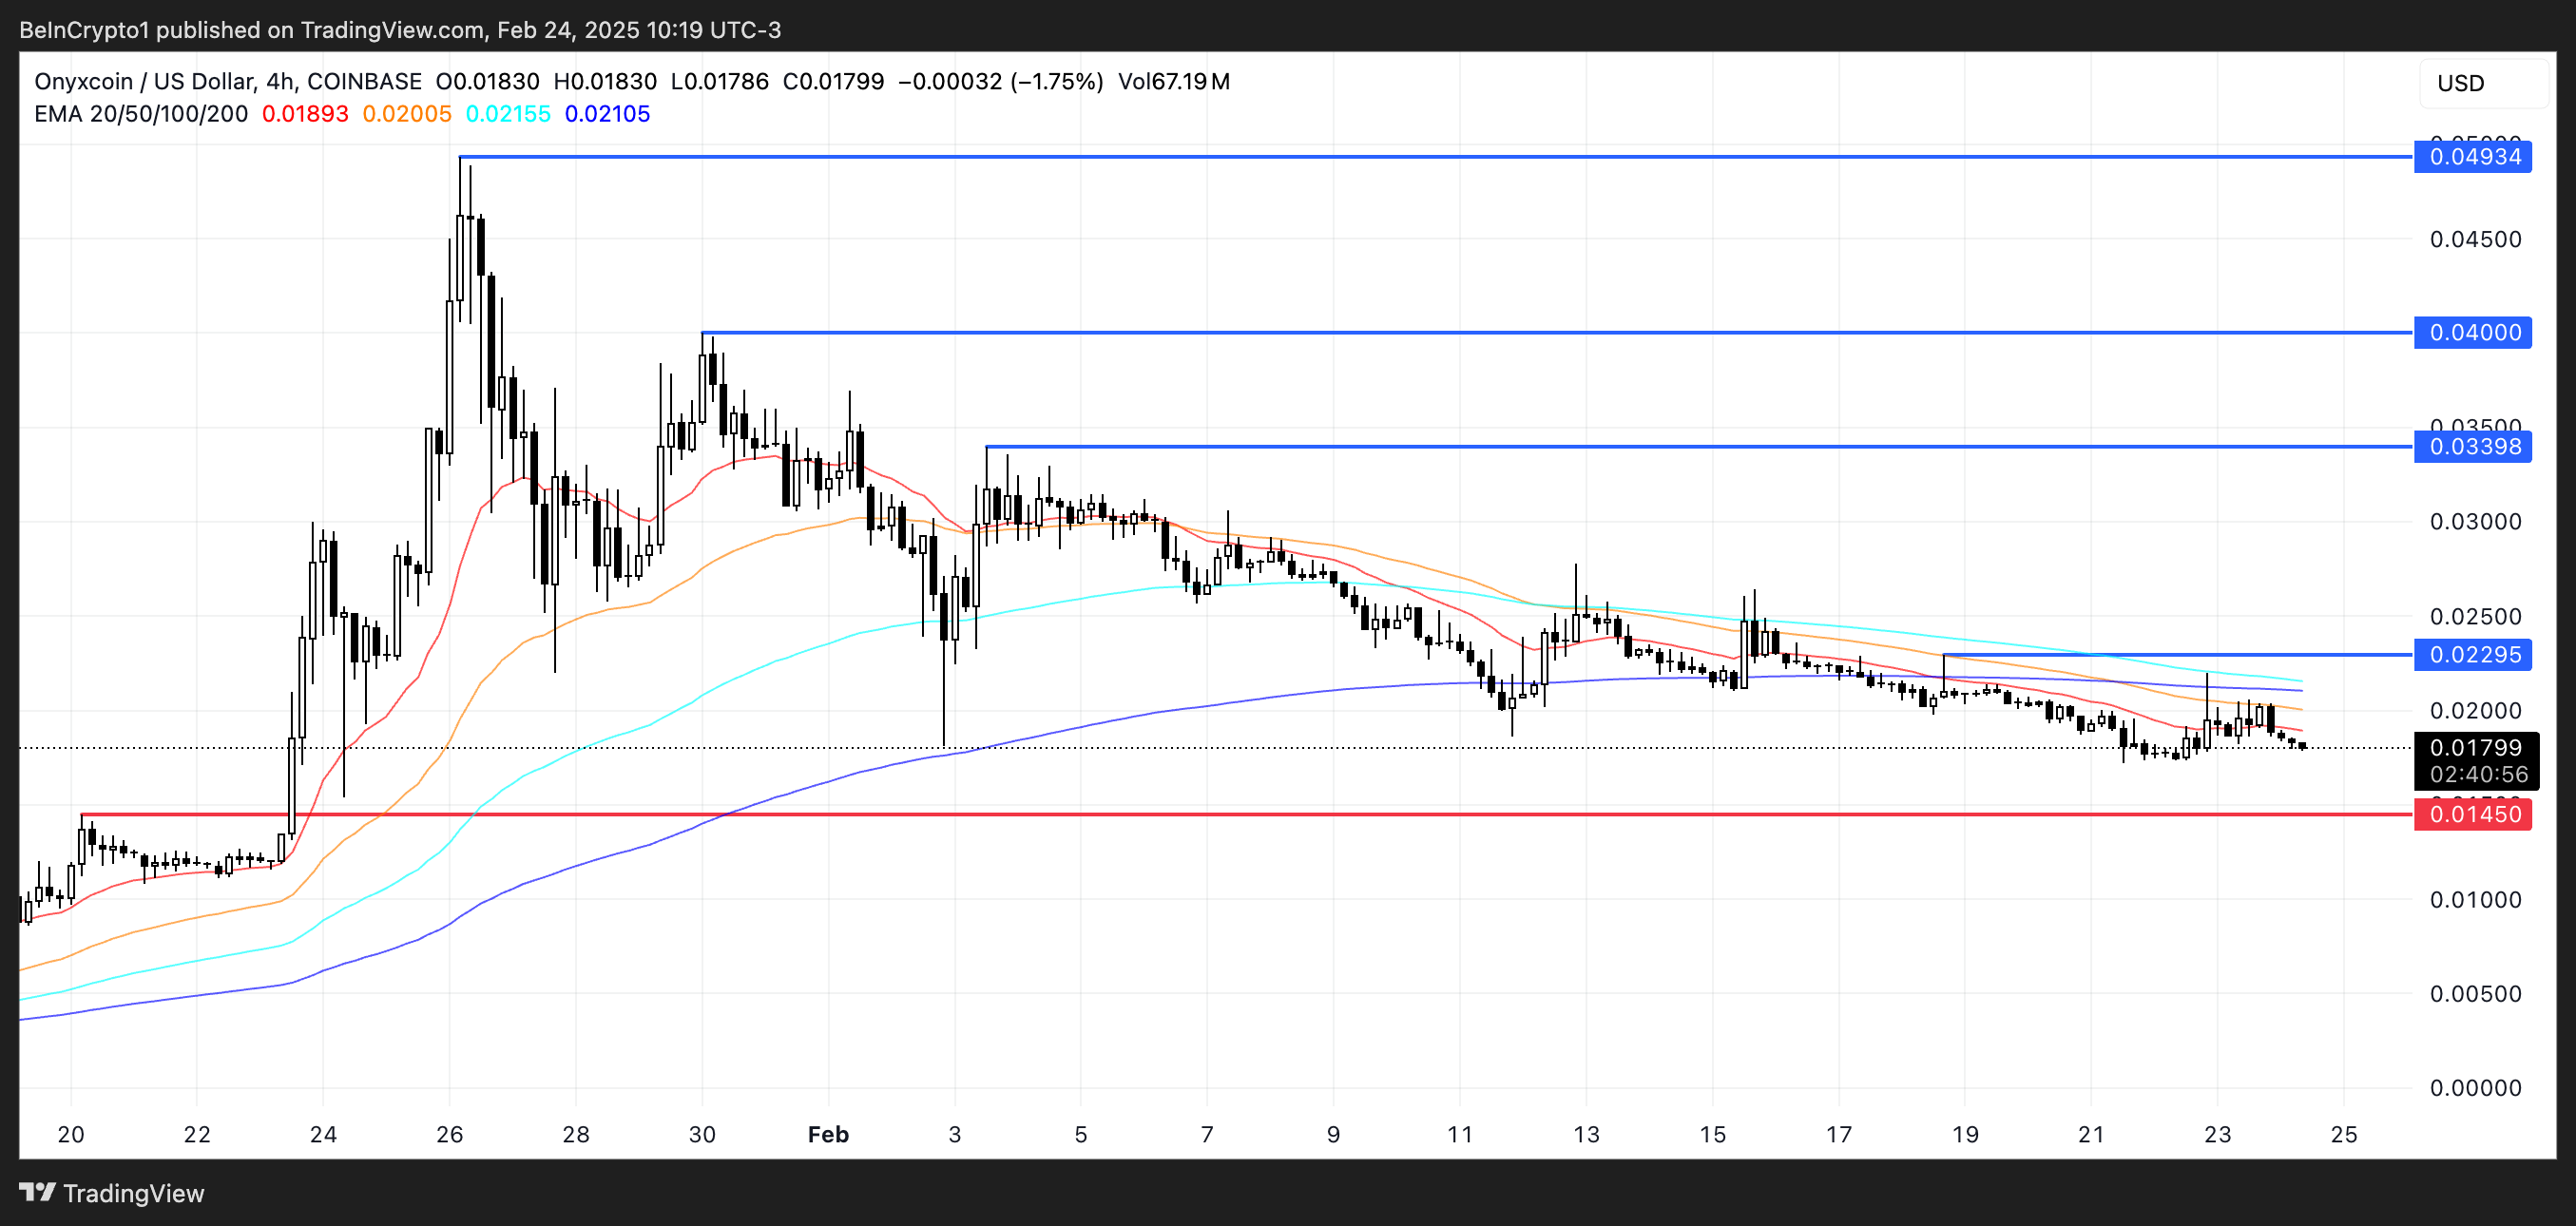
Conversely, if the trend reverses, XCN could test the resistance at $0.0229. Breaking above this level could trigger buying interest, pushing the price towards $0.0339 and potentially $0.040.
If XCN can regain the strong uptrend it experienced at the end of January, when it was one of the most trending altcoins in the market, it could reach levels around $0.049.
Disclaimer
In line with the Trust Project guidelines, this price analysis article is for informational purposes only and should not be considered financial or investment advice. BeInCrypto is committed to accurate, unbiased reporting, but market conditions are subject to change without notice. Always conduct your own research and consult with a professional before making any financial decisions. Please note that our Terms and Conditions, Privacy Policy, and Disclaimers have been updated.

Everything You Need to Know
Top 3 Altcoins To Watch In The Fourth Week of February

MicroStrategy Buys $2 Billion in Bitcoin, Its Largest of 2025

Onyxcoin (XCN) Sinks 35% in February as Bears Take Full Control

Binance Co-Founder Reveals Crypto Portfolio, Here’s What He Holds

The Altcoins Trending Today – SOL, BERA and SHADOW

2.52 Million Altcoins Are Ruining Crypto’s Future

Animoca Brands Valuation Tanks 75% In Two Years, Here’s Why

Crypto exchange BingX hacked for $43 million

Are The Big Players Losing Interest?

Hong Kong’s Securities Association Tips Authorities On Crypto Self-Regulation

Coinbase cbBTC Set to go Live on Solana
2.52 Million Altcoins Are Ruining Crypto’s Future
Animoca Brands Valuation Tanks 75% In Two Years, Here’s Why
Crypto exchange BingX hacked for $43 million
Are The Big Players Losing Interest?
Hong Kong’s Securities Association Tips Authorities On Crypto Self-Regulation
Coinbase cbBTC Set to go Live on Solana
-

 Market13 hours ago
Ether recovers from its dip to $2,600 following Bybit’s hack
-
 Altcoin21 hours ago
XRP Price Nears Breakout Zone, Is a Rally To $5 on the Horizon?
-

 Market24 hours ago
Top 5 Made in USA Cryptos to Watch – Late February Picks
-

 Ethereum7 hours ago
What we know about the $49.5 million Infini exploit so far
-
 Altcoin22 hours ago
Bybit Hack: Exchanges Freeze $42 Million From Exploit
-

 Ethereum16 hours ago
Ethereum Developer Counters Idea Of Blockchain Rollback Amidst Bybit Hack
-

 Market15 hours ago
XRP Price Nears Key Support—A Breakdown Could Be Devastating
-
 Altcoin15 hours ago
BTC Slips To $95K, ETH Above $2,700