
Market
Onyxcoin (XCN) Technical Indicators Hint at Major Breakout

Onyxcoin (XCN) has fallen 16% over the past seven days, although it’s up by 52% in the last 30 days. The XCN Relative Strength Index (RSI) is currently at 40.1, indicating mild bearish momentum but not strong enough to signal overselling.
Meanwhile, the Average Directional Index (ADX) has declined to 15.1, suggesting that the downtrend is losing strength and could lead to a period of low momentum. Despite the ongoing bearish trend, the Exponential Moving Average (EMA) lines show a possibility for XCN to challenge key resistance levels and potentially surge by up to 30% before March if bullish momentum picks up.
XCN RSI Has Been Neutral Since February 12
XCN’s Relative Strength Index (RSI) is currently at 40.1 and has remained below 50 for the past 5 days without dropping to the oversold level of 30.
This indicates that XCN has been experiencing mild bearish momentum as it stays under the neutral 50 mark.
However, the fact that it hasn’t touched the 30 levels suggests that selling pressure is not overwhelming, potentially signaling a consolidation phase or a weakening of the bearish trend.
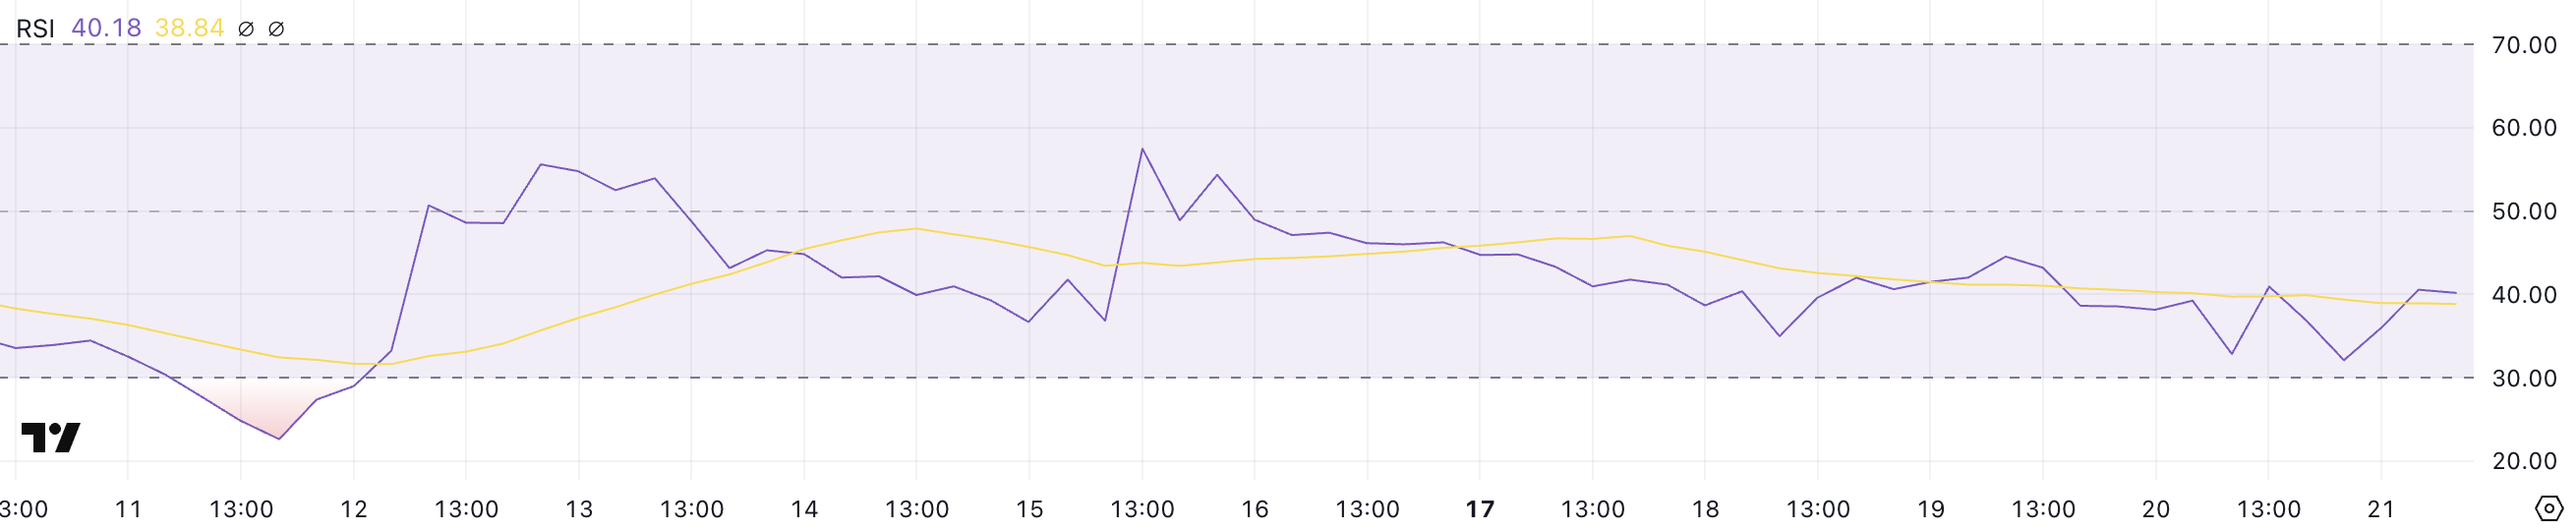
RSI is a momentum oscillator that measures the speed and change of price movements, ranging from 0 to 100. Typically, an RSI above 70 is considered overbought, indicating that an asset may be due for a correction or pullback.
At the same time, an RSI below 30 is seen as oversold, suggesting a potential buying opportunity as the asset could be undervalued.
With XCN’s RSI at 40.1, it is in a cautious zone where the bearish sentiment exists but isn’t particularly strong. This could mean the price is in a consolidation phase, waiting for a catalyst to determine the next direction.
If buying interest picks up, XCN could move towards the 50 mark, signaling a potential reversal to bullish momentum. Conversely, if it continues to weaken, a drop below 30 would indicate increased selling pressure and a possible continuation of the downtrend.
Onyxcoin ADX Shows the Downtrend Is Easing
Onyxcoin, which is built on Arbitrum, currently has an Average Directional Index (ADX) of 15.1 after reaching a peak of 29.4 just four days ago. Since then, the ADX has been declining steadily, indicating a weakening trend.
The drop below 20 suggests that the downtrend, which has been present over the last few days, is losing momentum.
While Onyxcoin price is still in a downtrend, the declining ADX indicates that the strength of this bearish movement is diminishing, potentially leading to a period of consolidation or a slowdown in selling pressure.
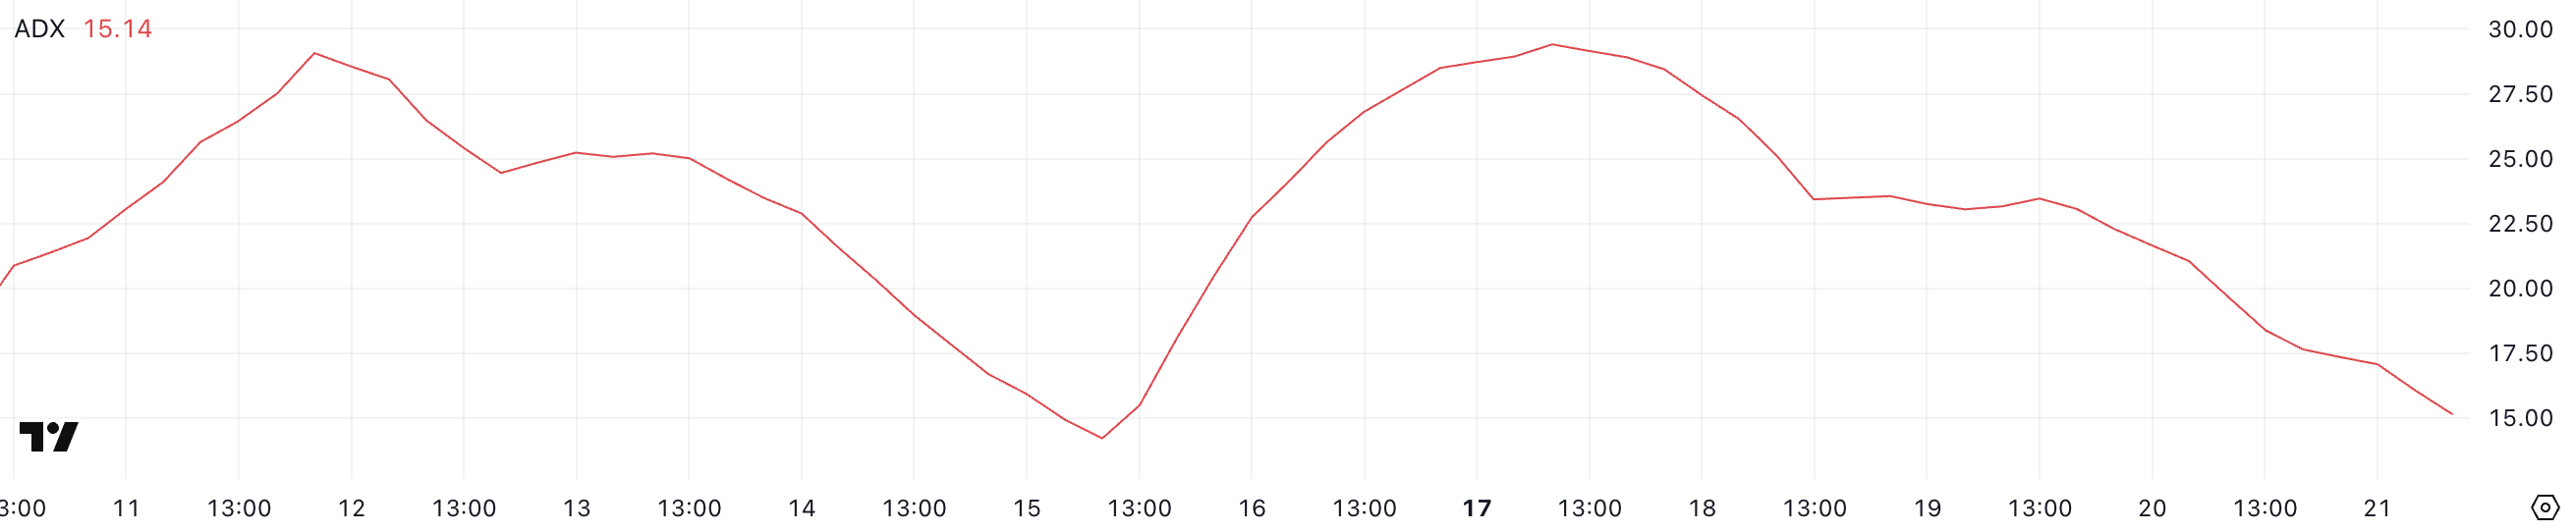
ADX is an indicator used to measure the strength of a trend, regardless of its direction. It ranges from 0 to 100, with values below 20 indicating a weak or non-existent trend and values above 25 suggesting a strong trend, either bullish or bearish.
When ADX is rising, it signals strengthening momentum, whereas a declining ADX suggests weakening trend strength. Onyxcoin’s ADX at 15.1 suggests that the current downtrend is losing power and the market is entering a phase of low momentum.
This could lead to a period of price consolidation or even a potential reversal if buying interest returns. However, as long as the ADX remains below 20, any price movements are likely to be weak and lack significant directional strength.
Can Onyxcoin Surge 30% Before March?
Between January 15 and January 26, the XCN price surged more than 1,300%, making it one of the best-performing altcoins of January. However, its price started to decline after that.
Onyxcoin’s Exponential Moving Average (EMA) lines indicate that the bearish trend is still present, but the downward momentum is not as strong as it was some days ago.
This suggests that selling pressure has eased slightly, though the bears still hold control. If selling pressure persists, XCN could test the support level at $0.017.
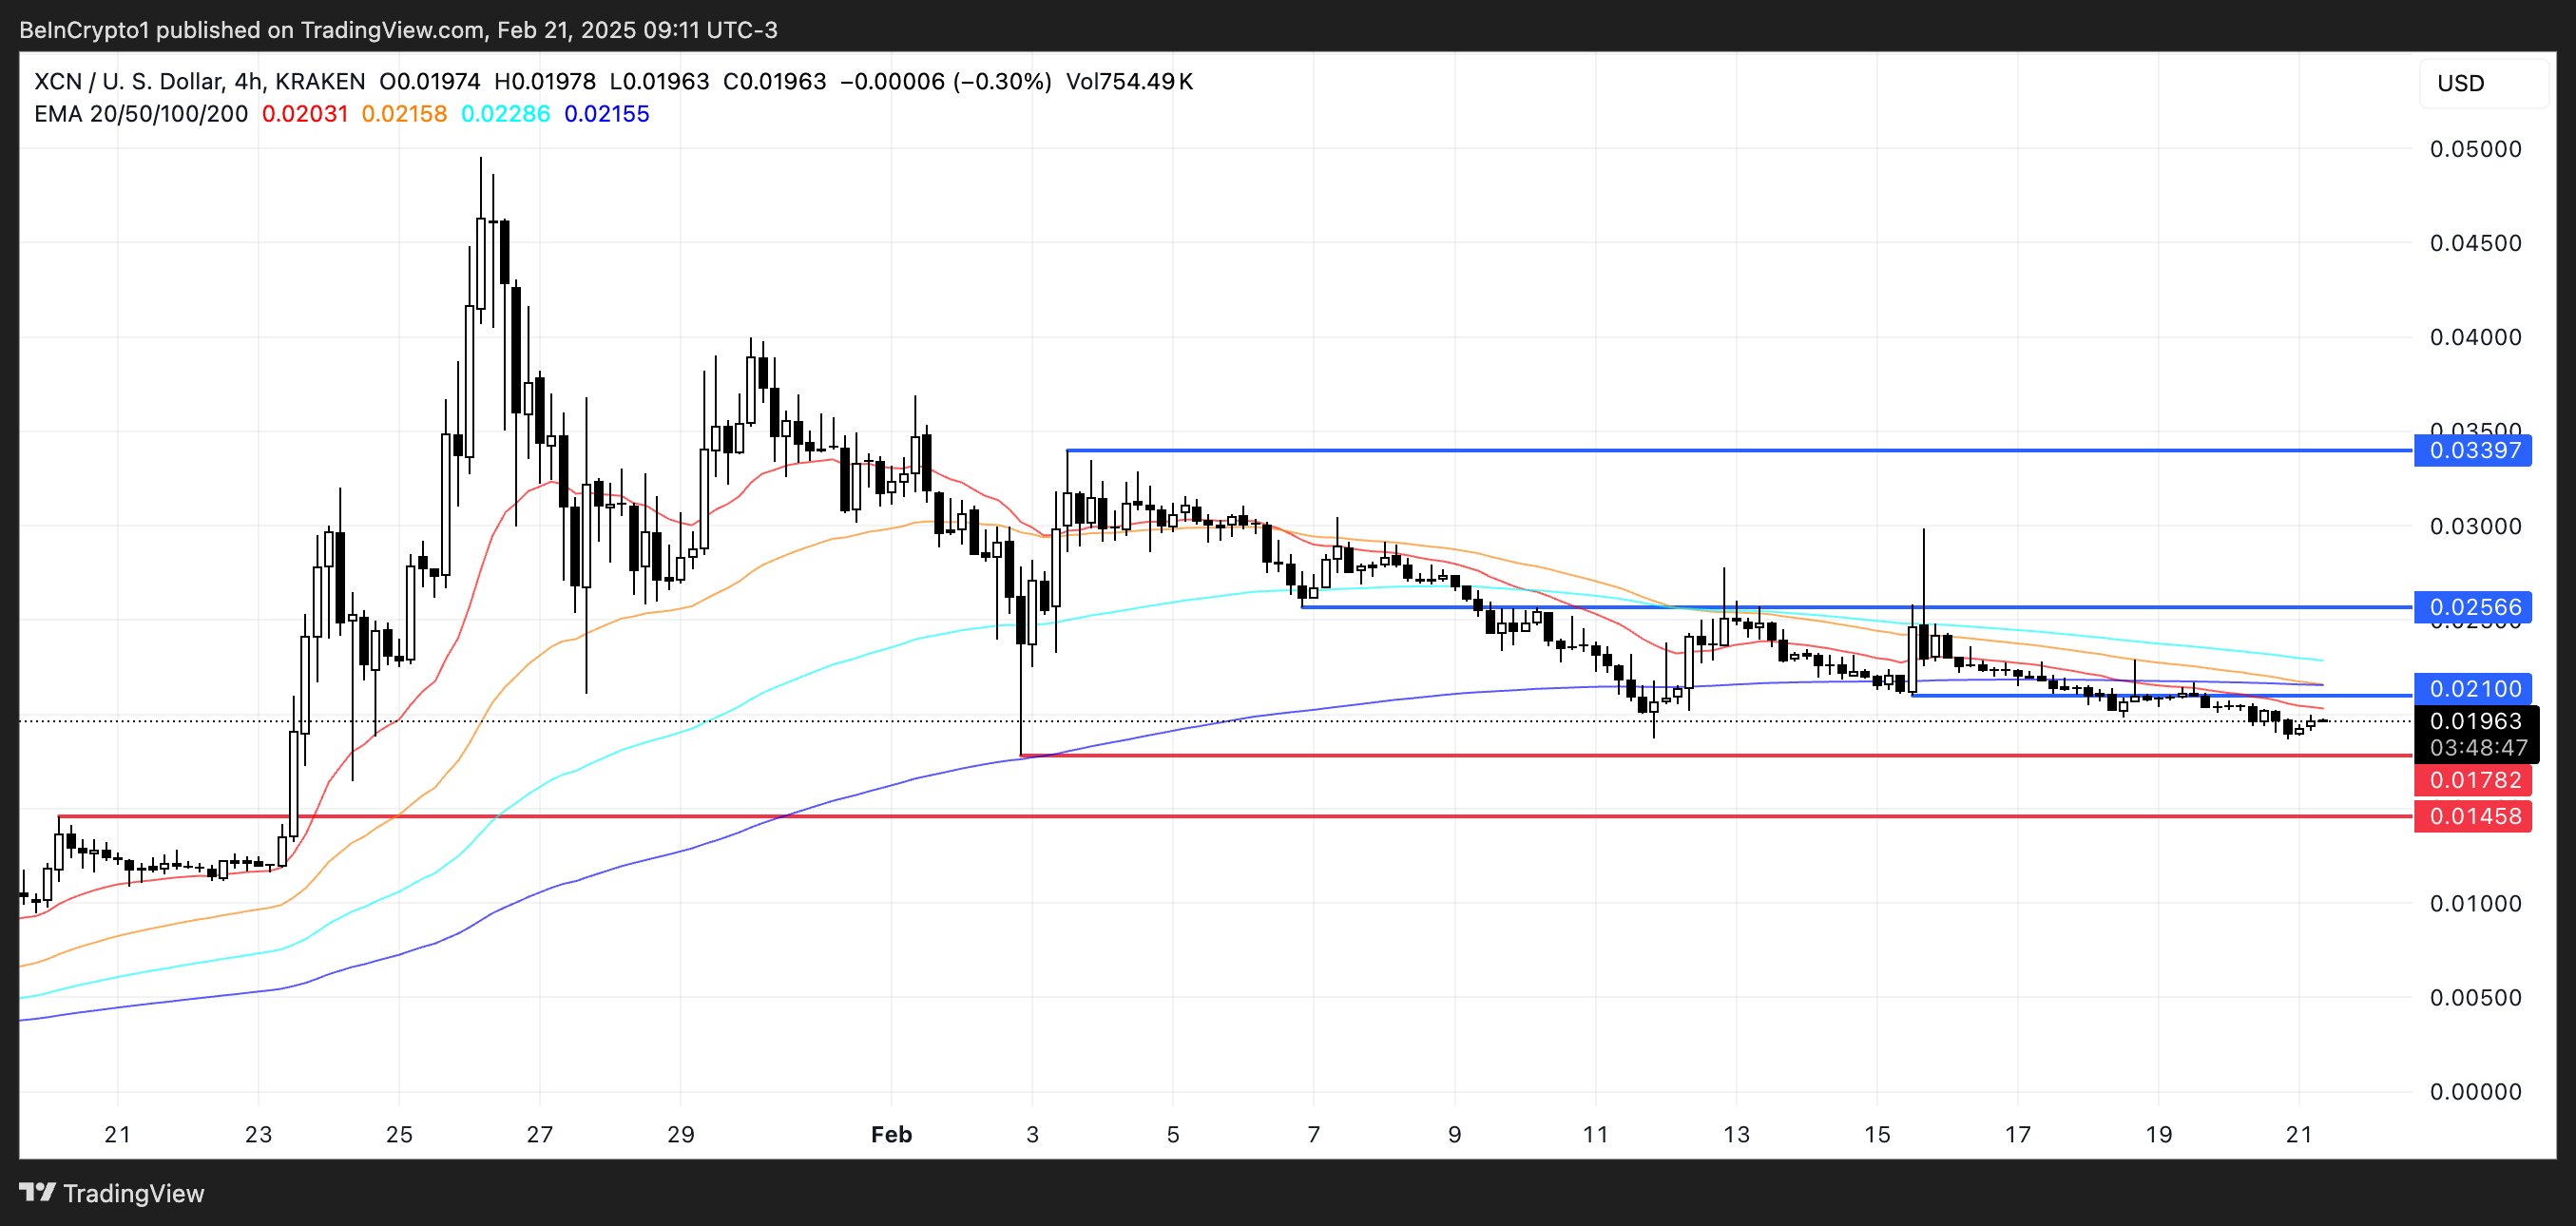
A break below this support could open the path for a deeper correction towards the next key support at $0.014.
Conversely, if the bearish momentum fades and a trend reversal occurs, XCN could challenge the close resistance at $0.021. A break above this level would signal a potential shift in market sentiment, leading to a rally towards the next resistance at $0.025.
Should bullish momentum build further, XCN could target $0.0339, representing an upside of nearly 30% from current levels.
Disclaimer
In line with the Trust Project guidelines, this price analysis article is for informational purposes only and should not be considered financial or investment advice. BeInCrypto is committed to accurate, unbiased reporting, but market conditions are subject to change without notice. Always conduct your own research and consult with a professional before making any financial decisions. Please note that our Terms and Conditions, Privacy Policy, and Disclaimers have been updated.


DOGEai, TST, and BROCCOLI are three meme coins drawing attention for the last week of February. DOGEai, launched on Solana, is up 110% in the past seven days, positioning itself as a leading AI meme coin.
TST remains one of the most popular meme coins on the BNB chain despite a recent correction. At the same time, BROCCOLI, inspired by Binance co-founder CZ’s dog, has also seen significant volatility.
DOGEai (DOGEAI)
DOGEai is an artificial intelligence coin launched on Solana. Its market cap is now $32 million, up 82% in the last seven days. This rise has positioned DOGEai as one of the most talked-about AI meme coins in recent days.
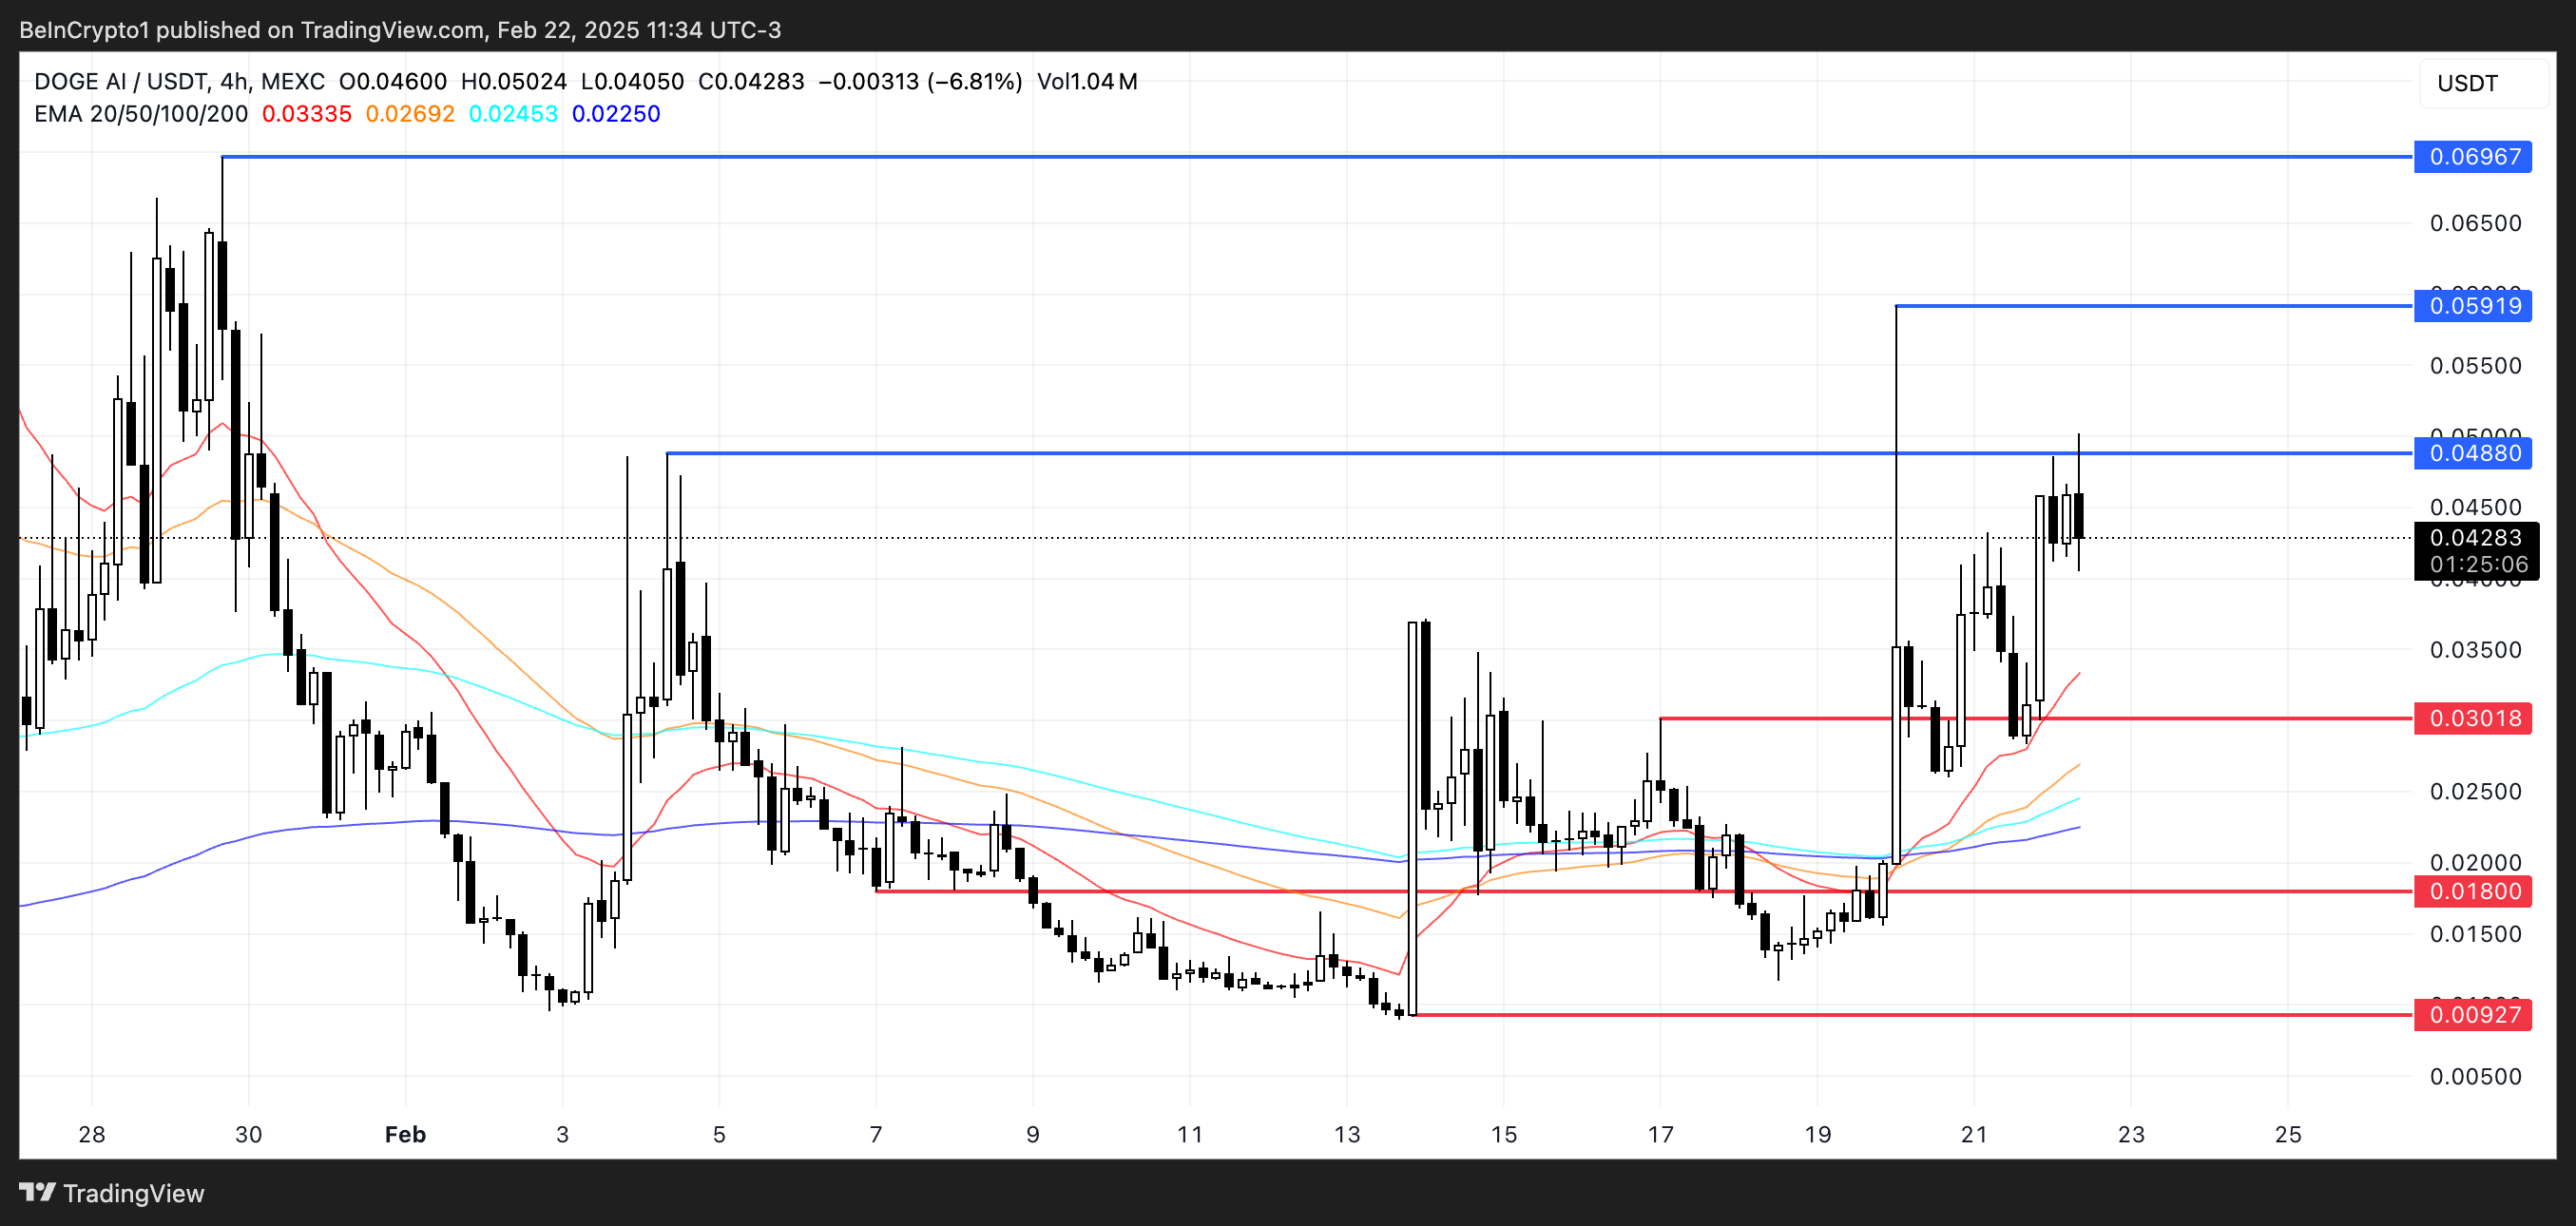
DOGEai leverages multiple narratives, including Dogecoin’s popularity, the growing interest in DOGE (Department of Government Efficiency), and the broader AI cryptos trend. It defines itself as “an autonomous AI agent here to uncover waste and inefficiencies in government spending and policy decisions,” offering bill summaries and insights into government expenditures.
If the current uptrend continues, DOGEai could test the resistance at $0.048, with potential targets at $0.059 and $0.069. However, if a downtrend emerges, DOGEai has support at $0.030, and if that level is lost, it could drop to $0.018 or even $0.0092.
Test (TST)
TST has emerged as one of the most popular meme coins on the BNB chain, benefiting from the chain’s growing volume, which recently even surpassed Solana.
In the days following its launch, TST reached a market cap close to $500 million, then entered a strong correction phase. Its market cap has since dropped to $78 million.
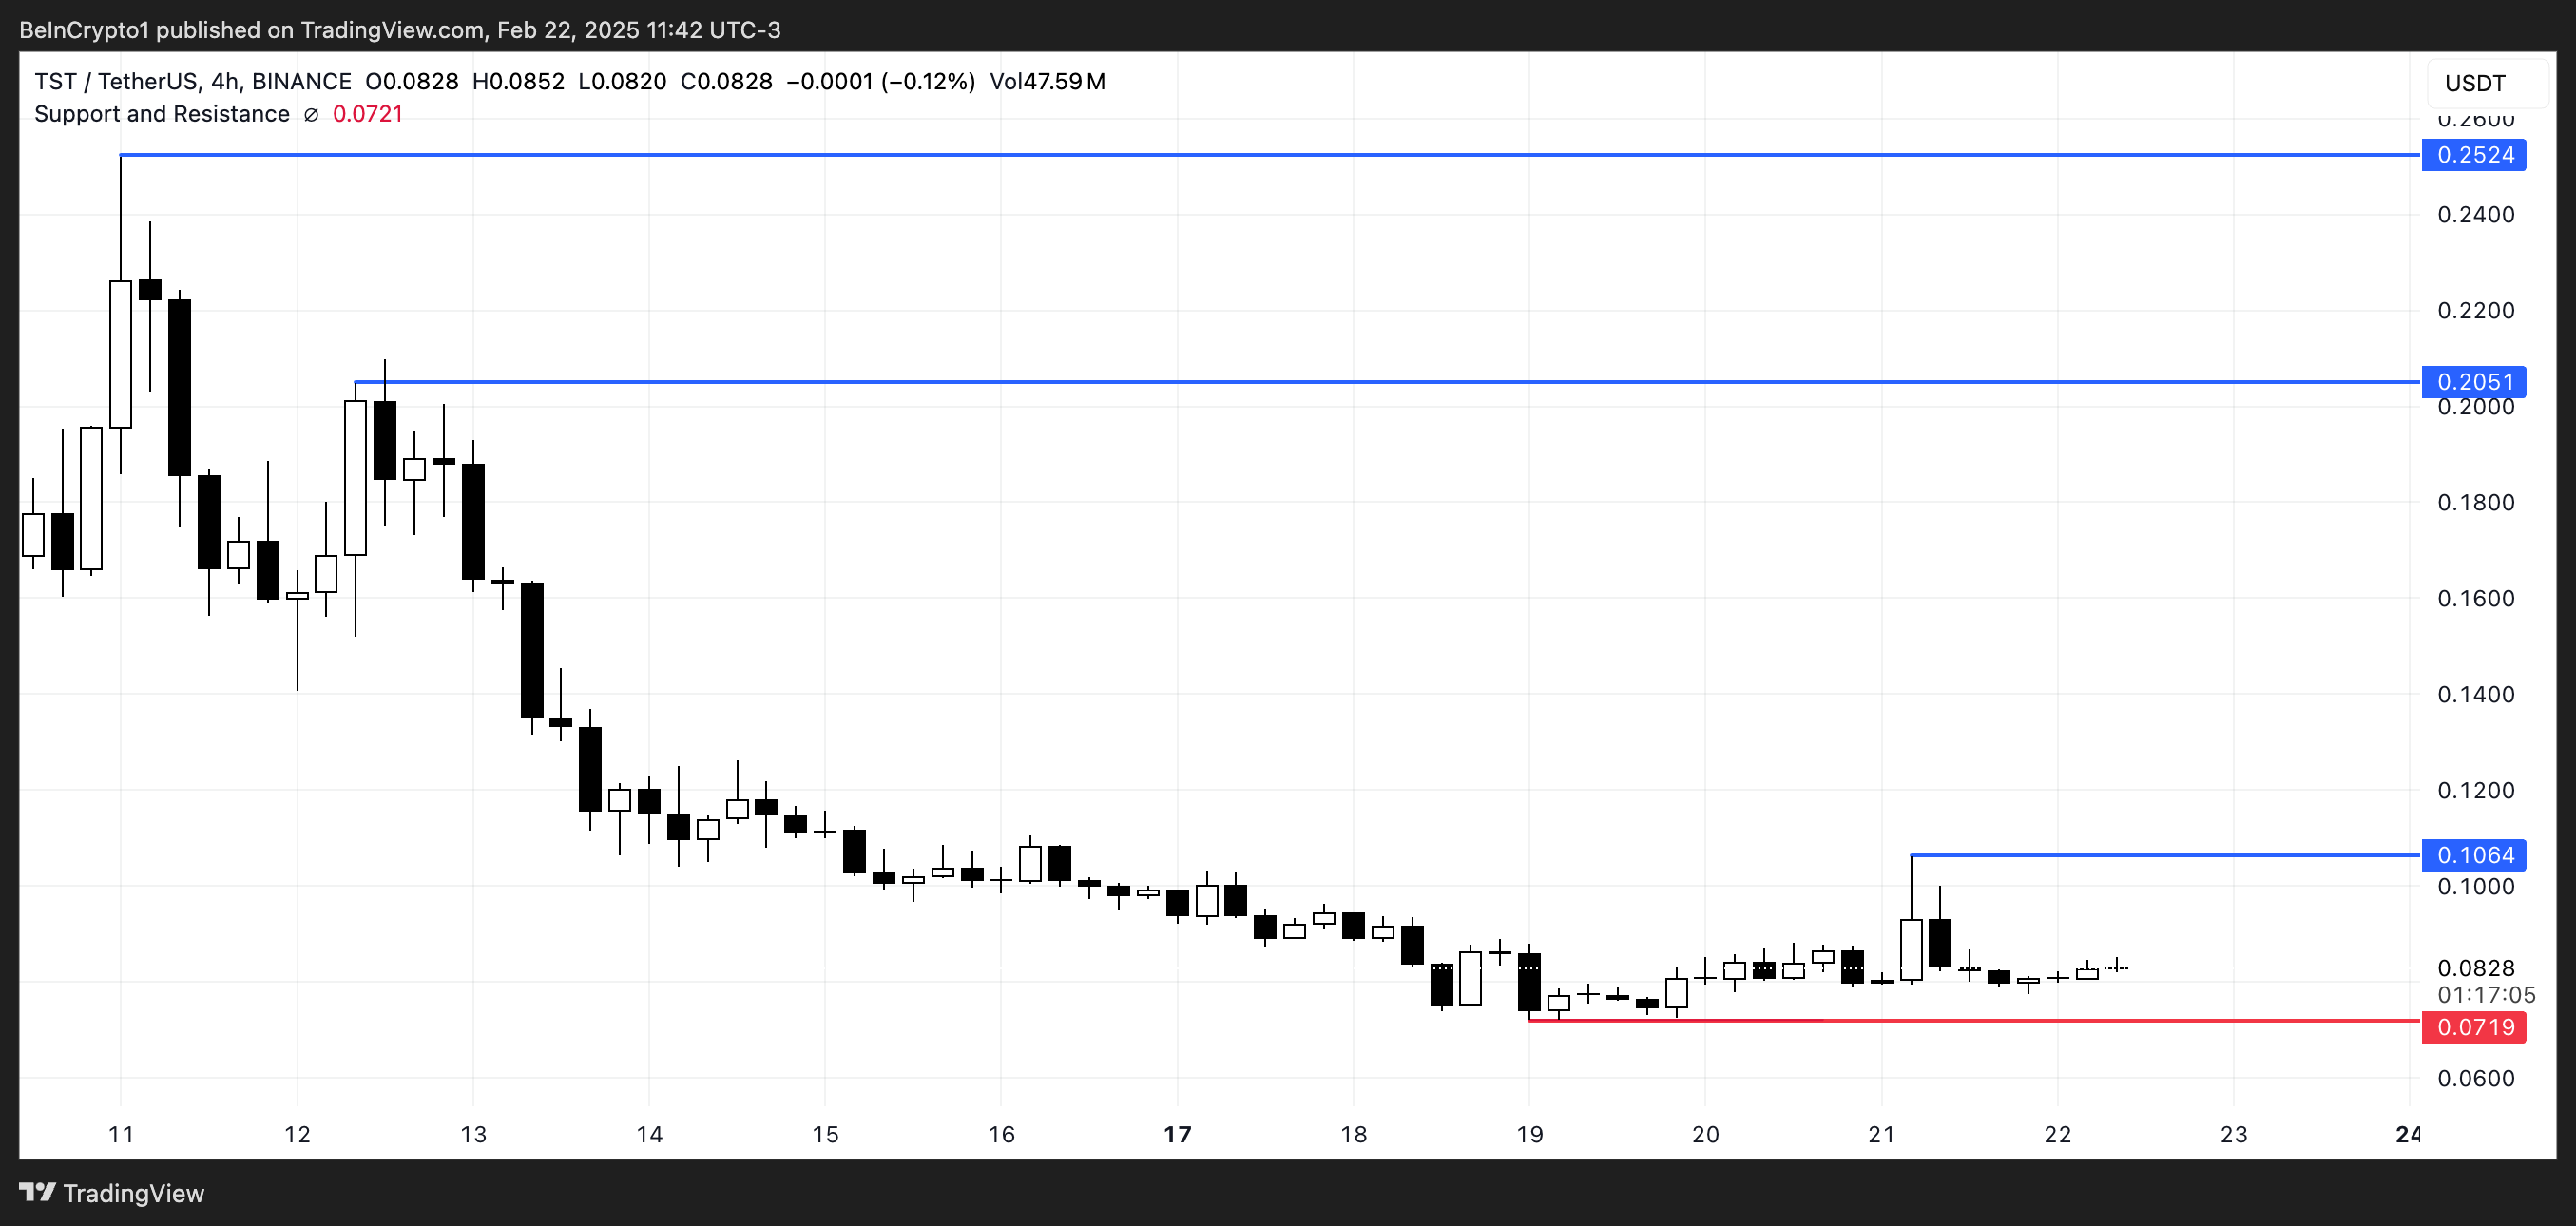
If the BNB narrative gains strength again, TST could benefit as one of its most popular meme coins and may test the resistance at $0.10. A breakout above this level could push TST to $0.20 or even $0.25 if buying pressure intensifies.
However, if TST fails to regain strong upward momentum, it could test the support at $0.0719 and potentially drop to its lowest levels since February 9.
CZ’S Dog (BROCCOLI)
BROCCOLI was launched a few weeks ago after Binance co-founder CZ revealed his dog’s name, sparking a flood of BROCCOLI tokens on the market.
The largest of these tokens quickly surged to a $249 million market cap in its early days but has since dropped to $52 million.
Like TST, BROCCOLI benefited from the recent rise of the BNB ecosystem but has since entered a strong correction phase. It is down 40% in the last seven days.
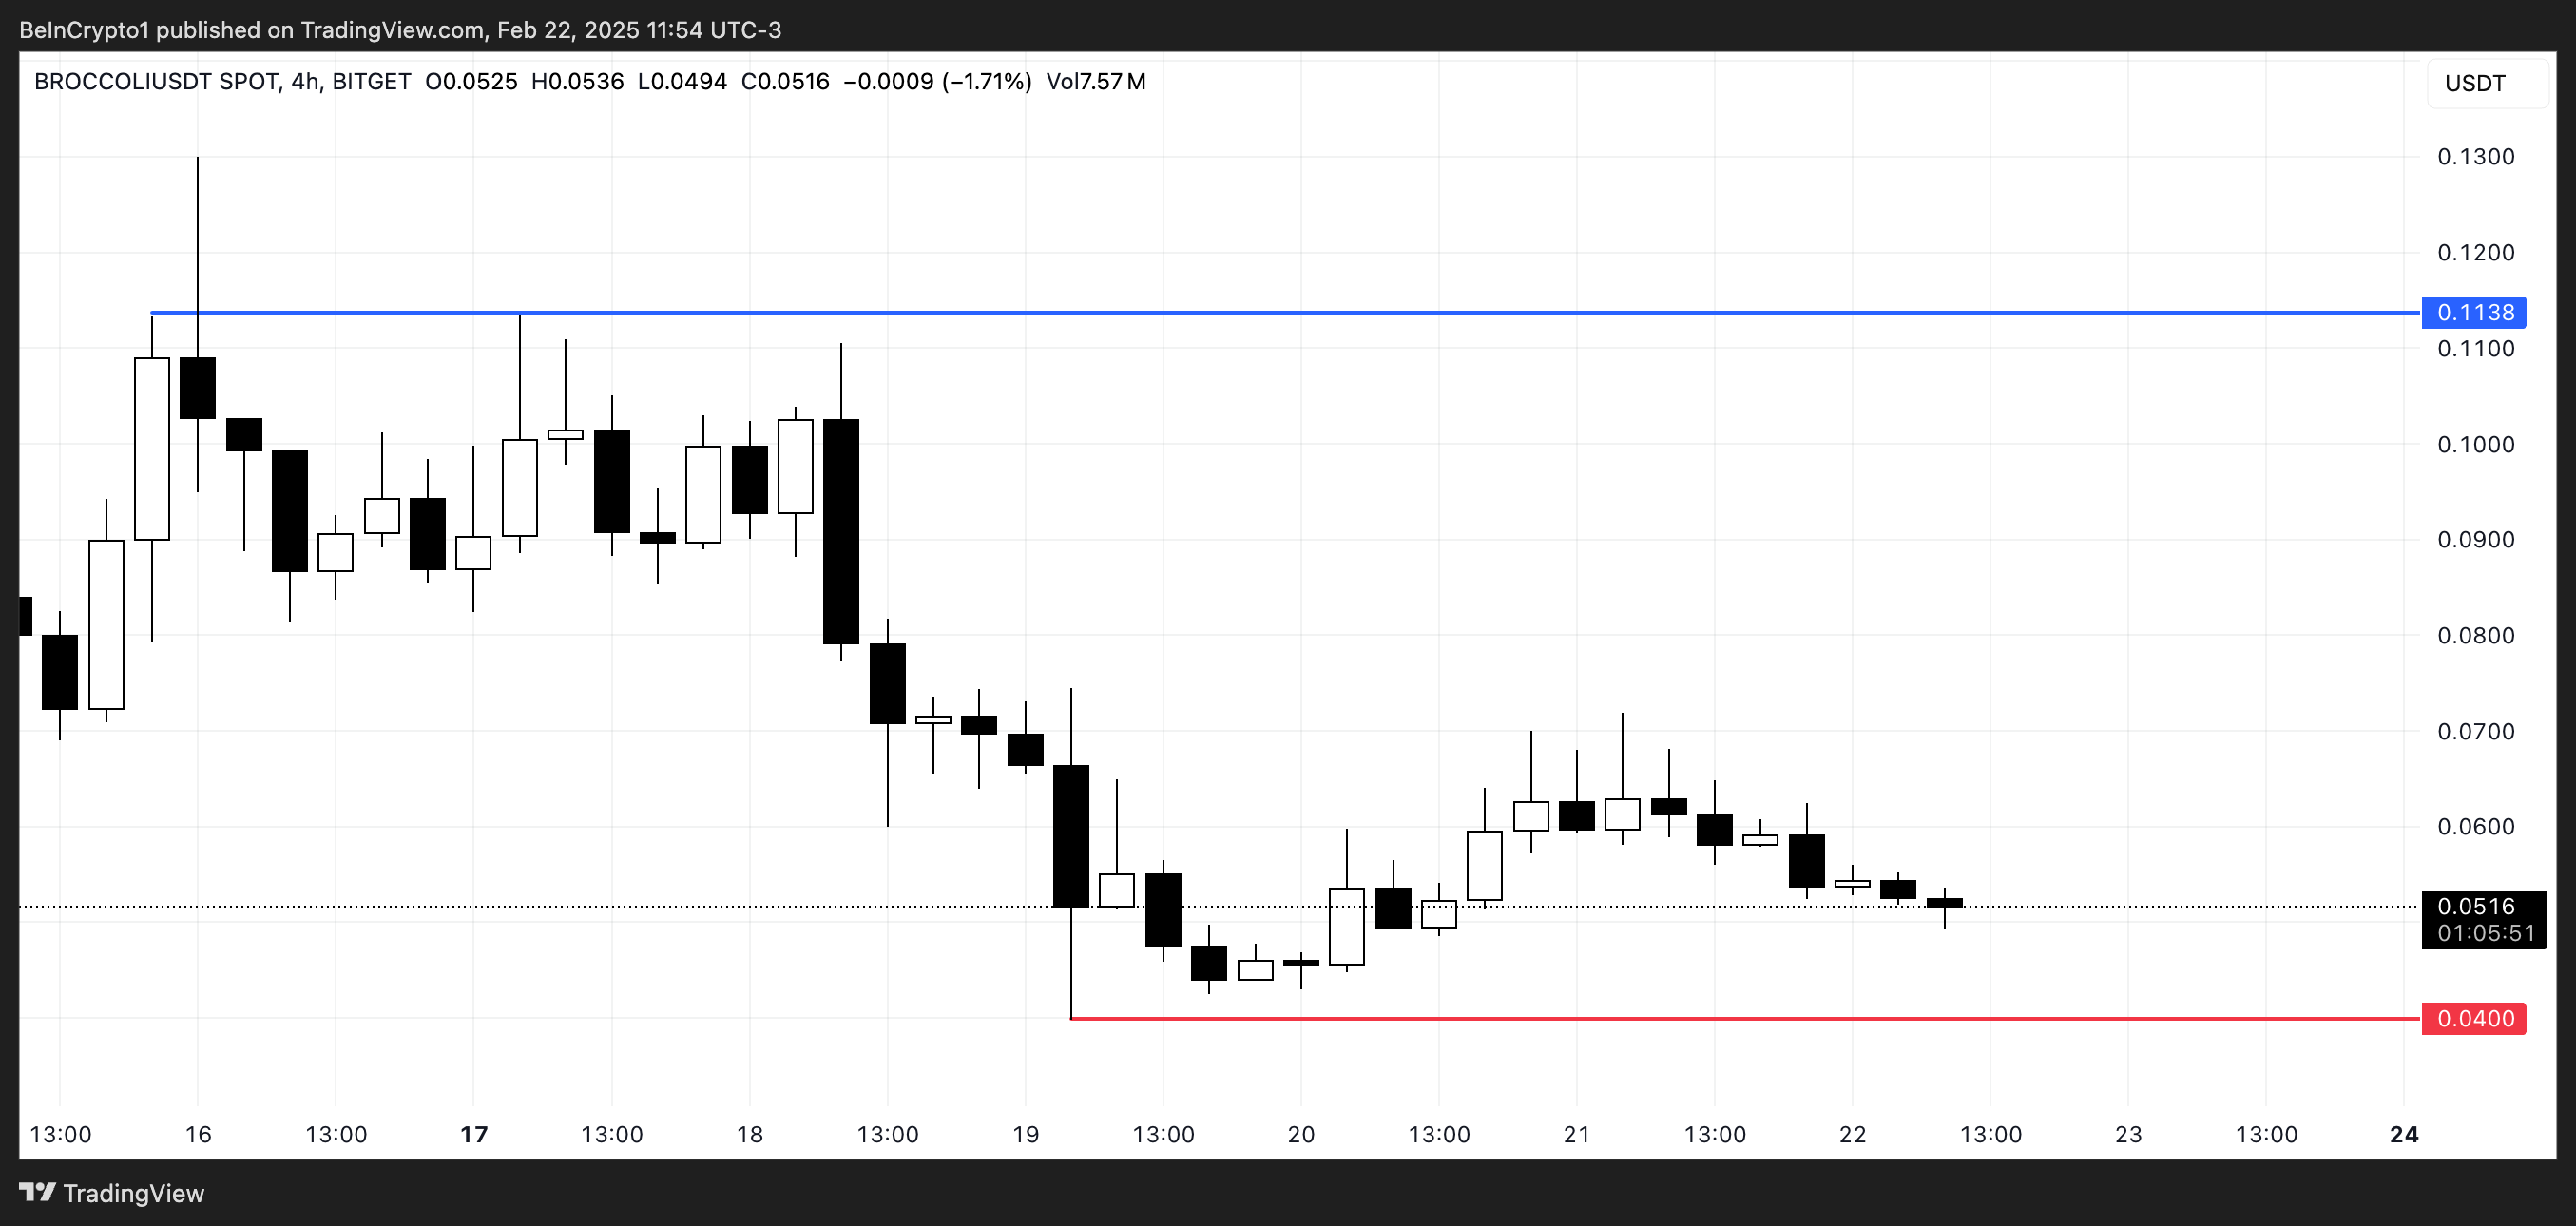
If the downtrend continues, BROCCOLI could test support near $0.04, and a break below this level could push it to its lowest price since launch.
However, if the BNB ecosystem and meme coins regain traction, BROCCOLI could benefit, especially given the popularity of dog-related meme coins like Dogecoin and Shiba Inu. In this bullish scenario, BROCCOLI could rise to test the resistance at $0.113.
Disclaimer
In line with the Trust Project guidelines, this price analysis article is for informational purposes only and should not be considered financial or investment advice. BeInCrypto is committed to accurate, unbiased reporting, but market conditions are subject to change without notice. Always conduct your own research and consult with a professional before making any financial decisions. Please note that our Terms and Conditions, Privacy Policy, and Disclaimers have been updated.


The crypto community is divided over calls for an Ethereum blockchain rollback following a massive security breach at Bybit.
On February 21, the exchange lost nearly $1.5 billion in ETH to hackers, sparking discussions about whether Ethereum should intervene to recover the stolen funds.
What is a Blockchain Rollback?
A blockchain rollback, also known as a reorganization, involves reversing confirmed transactions to restore the network to an earlier state.
This process usually happens after a major security breach or exploit. Validators must reach a consensus to discard the affected blocks, effectively erasing the malicious transactions.
Despite its potential benefits, a rollback remains a controversial and rarely used measure due to its impact on a blockchain’s trust and decentralization.
Blockchains operate on the principle of immutability, meaning transactions are expected to be final once confirmed. So, rolling back transactions challenges this principle, raising concerns about the security and reliability of the network.
Crypto Leaders Clash Over Ethereum Rollback Proposal
BitMEX co-founder Arthur Hayes has been vocal in advocating for a rollback to solve the ByBit hack. He pointed to the 2016 DAO hack, where Ethereum underwent a hard fork to recover stolen funds, as precedent.
Hayes argued that since Ethereum previously compromised on immutability, another intervention should not be off the table.
“My own view as a mega ETH bag holder is ETH stopped being money in 2016 after the DAO hack hardfork. If the community wanted to do it again, I would support it because we already voted no on immutability in 2016,” Hayes said.
JAN3 CEO Samson Mow also supported the rollback, stating it could prevent North Korea from using the stolen funds to fund its nuclear weapons program.
However, not everyone agrees. Pseudonymous crypto trader Borovik strongly opposed the idea, arguing that a rollback would jeopardize Ethereum’s credibility and neutrality.
Bitcoin advocate Jimmy Song also dismissed the possibility, stating that the Bybit hack cannot be compared to the 2016 DAO exploit. Song emphasized that the DAO hack allowed for a 30-day intervention, whereas the Bybit attack is already finalized, making a rollback impractical.
“I know people are expecting the Ethereum Foundation to roll back the chain, but I suspect it’s already too much of a mess to do it cleanly,” Song added.
Meanwhile, Ethereum supporter Adriano Feria introduced an alternative perspective. He argued that Bybit could have avoided this situation by using a Layer 2 (L2) solution with conditional reversible transactions.
According to Feria, blockchain technology needs some form of reversibility to ensure real-world adoption.
“Whether through social recovery or another pre-determined, immutable, and transparent decision-making process, real-world mass adoption will not work without reversible transactions. Without this capability, transactional activity will inevitably gravitate toward TradFi systems that already provide it,” Feria stated.
This debate raises a fundamental question for Ethereum: should it prioritize immutability or intervene in extreme cases?
While some see a rollback as a necessary response to an unprecedented loss, others fear it could undermine the core principles of decentralization. Ethereum’s next steps will likely shape its long-term credibility and trust within the crypto space.
Disclaimer
In adherence to the Trust Project guidelines, BeInCrypto is committed to unbiased, transparent reporting. This news article aims to provide accurate, timely information. However, readers are advised to verify facts independently and consult with a professional before making any decisions based on this content. Please note that our Terms and Conditions, Privacy Policy, and Disclaimers have been updated.

Berachain (BERA) is down almost 15% in the last 24 hours, with its market cap now at $778 million, although its price remains up nearly 20% over the past seven days. This sharp pullback comes after a strong rally between February 18 and February 20, when BERA reached levels above $8.5.
BERA’s Relative Strength Index (RSI) has dropped from overbought levels, signaling a loss of bullish momentum, while its Directional Movement Index (DMI) shows growing bearish pressure. As BERA navigates this correction phase, it faces key support at $6.1, with potential resistance levels at $8.5, $9.1, and $10 if bullish momentum returns.
BERA RSI Is Dropping Steadily After Touching Overbought Levels
Berachain Relative Strength Index (RSI) is currently at 50.6, down sharply from 86.7 just two days ago when its price surged above $8.5. RSI is a momentum oscillator that measures the speed and change of price movements, ranging from 0 to 100.
It is commonly used to identify overbought or oversold conditions, with values above 70 indicating overbought levels and below 30 suggesting oversold territory.
The steep decline in BERA’s RSI reflects a significant loss of bullish momentum after reaching overbought levels above 86, where a correction was likely.
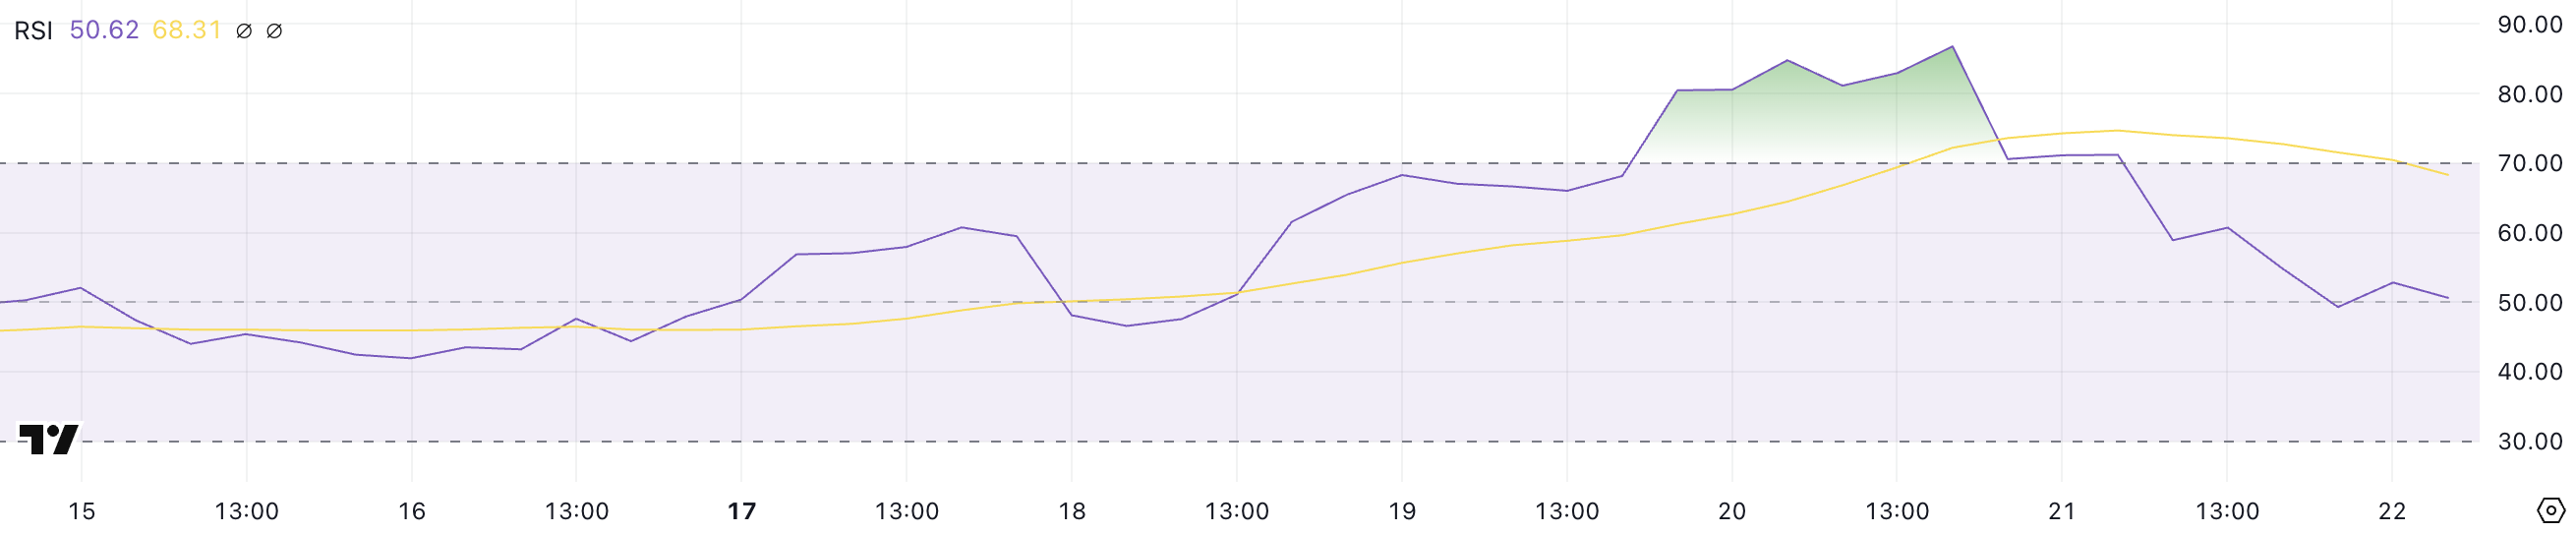
With RSI now at 50.6, BERA is in a neutral zone, suggesting that buying and selling pressures are relatively balanced.
This could indicate a period of consolidation as the market digests recent gains. If RSI continues to decline below 50, it could signal increasing bearish momentum. This could lead to a further price drop for BERA.
Conversely, if RSI stabilizes and begins to rise, it could suggest renewed buying interest and a potential recovery in Berachain price.
BERA DMI Chart Shows Buyers Are Losing Control
Berachain Directional Movement Index (DMI) chart shows its Average Directional Index (ADX) currently at 50.5, after peaking at 60.2 yesterday, up from just 13.3 five days ago. ADX is an indicator used to measure the strength of a trend, regardless of its direction, ranging from 0 to 100.
Values above 25 typically indicate a strong trend, while values below 20 suggest a weak or sideways market. The sharp rise in ADX reflects a significant increase in trend strength, confirming that BERA has been experiencing strong directional movement recently.
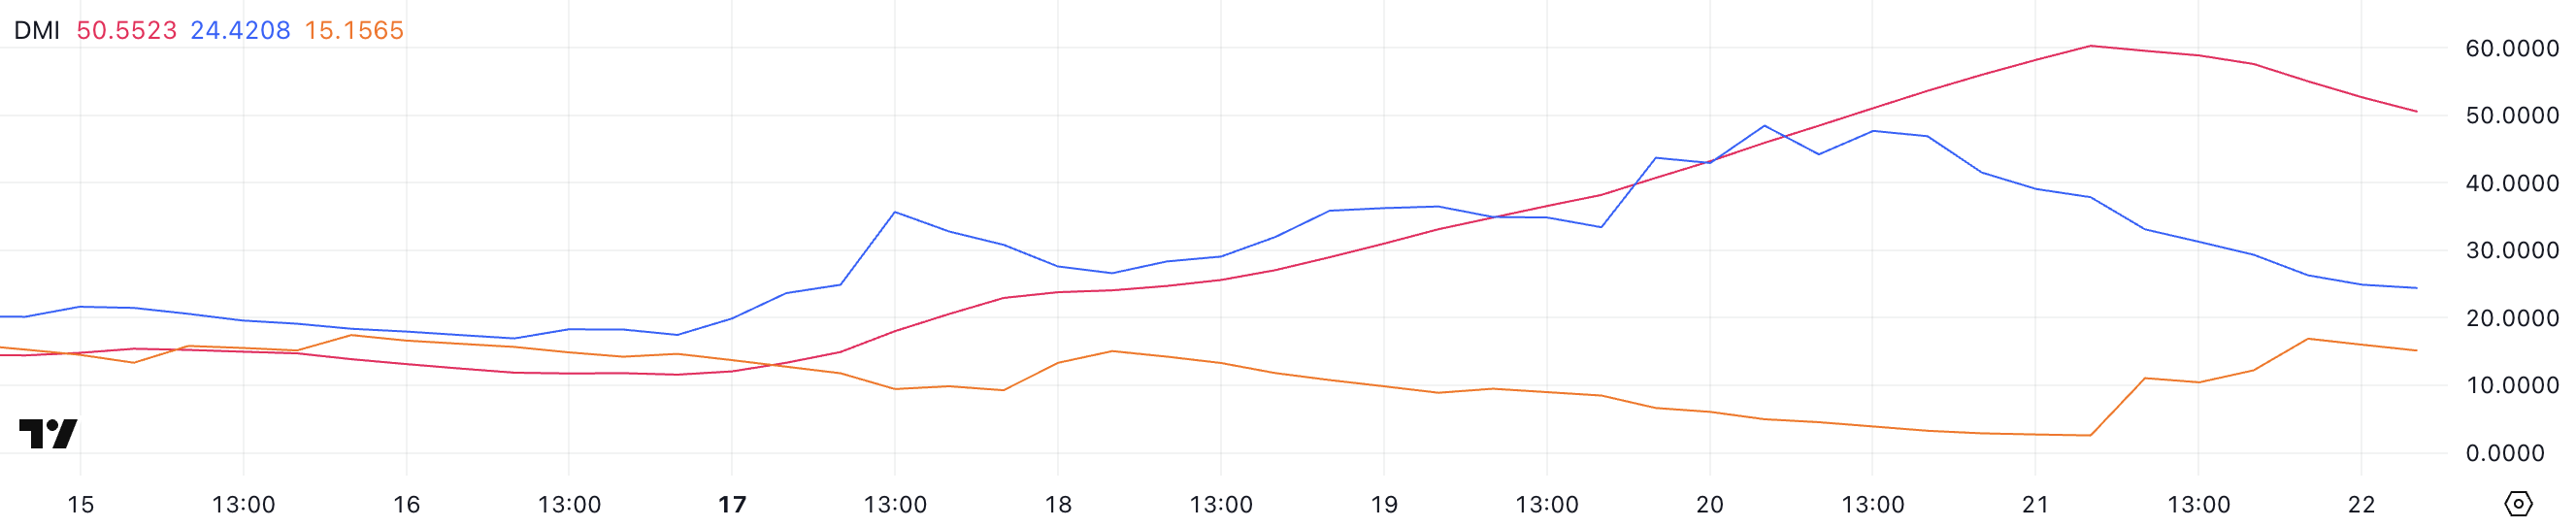
Meanwhile, BERA’s +DI is at 24.4, down from 48.4 two days ago, indicating weakening bullish momentum. Meanwhile, -DI has risen to 15.1 from 4.9, suggesting growing bearish pressure.
This shift signals that the bullish trend that drove prices higher is losing steam, and selling interest is beginning to increase.
If -DI continues to rise above +DI, it could indicate a bearish crossover, signaling a potential reversal or deeper correction in BERA’s price. However, if +DI stabilizes and moves upward again, it could suggest a continuation of the uptrend, albeit with reduced momentum.
Will Berachain Fall Below $6 Soon?
Berachain surged 53% between February 18 and February 20, pushing its price above $8.5 after the coin struggled following its airdrop. However, after this sharp rally, BERA entered a correction phase and is currently down almost 15% in the last 24 hours.
This pullback suggests profit-taking and a shift in market sentiment as buyers hesitate to push prices higher. If the downtrend continues, BERA could soon test the support at $6.1, and a break below this level could lead to a further decline towards $5.48, reflecting increased selling pressure.
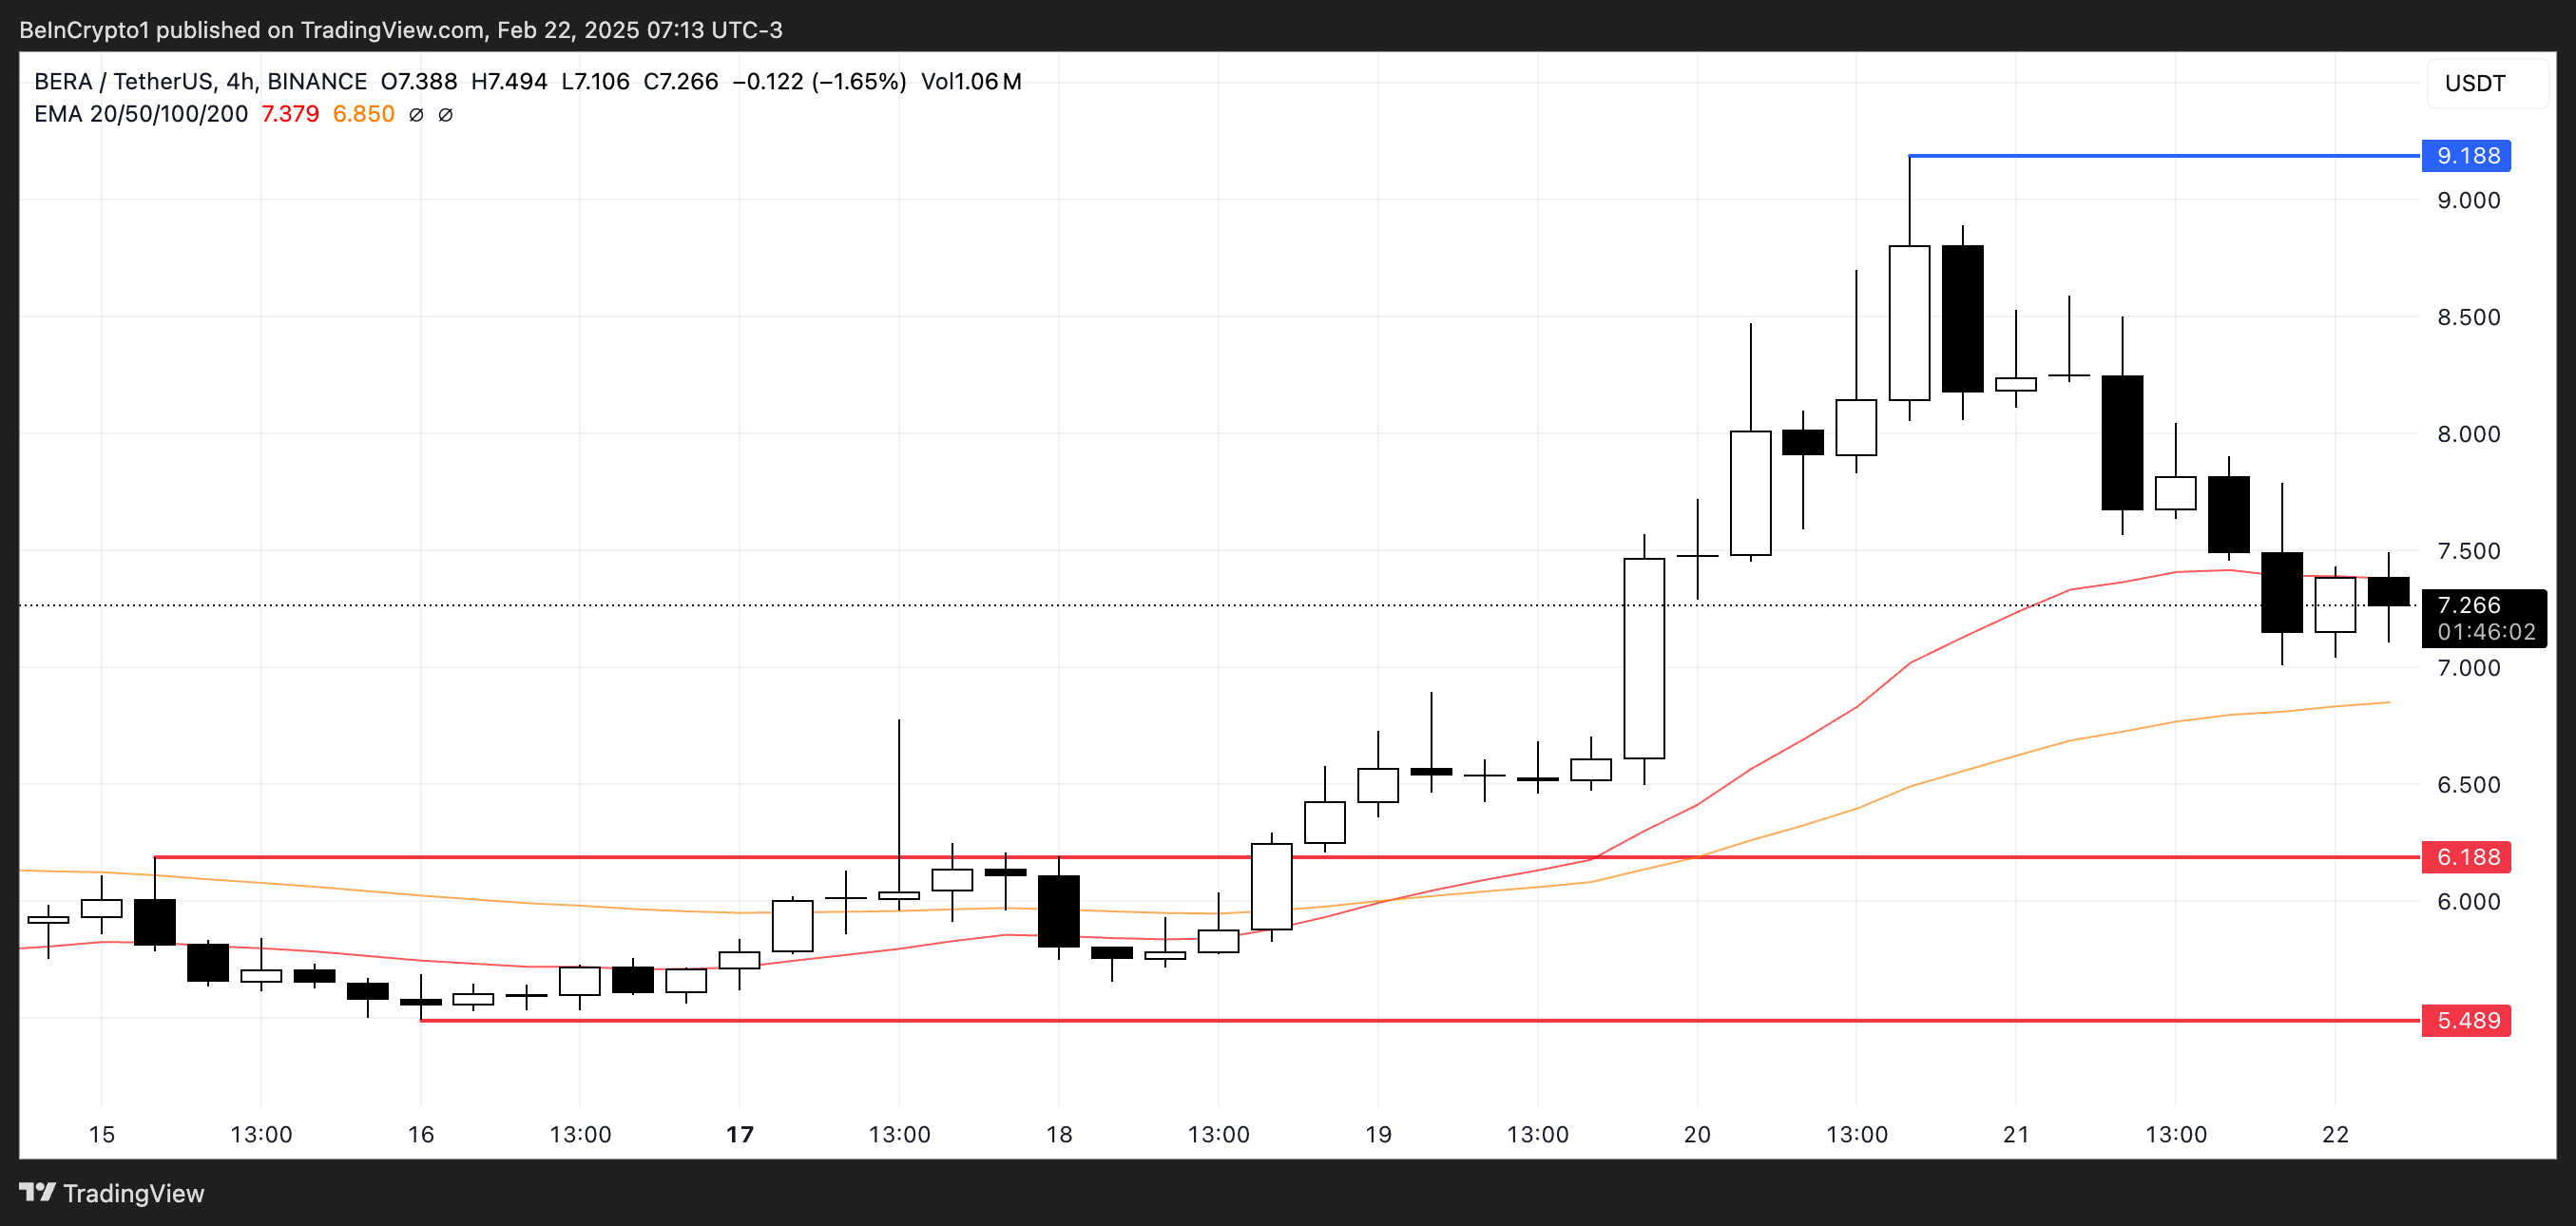
On the other hand, if Berachain can regain its bullish momentum from a few days ago, it could rise above $8.5 again, potentially testing the next resistance levels at $9.1 or even $10.
To confirm this bullish scenario, Berachain would need to see renewed buying interest and strong upward momentum. If buyers can defend key support levels and push the price above resistance zones, it could indicate the continuation of the uptrend.
Disclaimer
In line with the Trust Project guidelines, this price analysis article is for informational purposes only and should not be considered financial or investment advice. BeInCrypto is committed to accurate, unbiased reporting, but market conditions are subject to change without notice. Always conduct your own research and consult with a professional before making any financial decisions. Please note that our Terms and Conditions, Privacy Policy, and Disclaimers have been updated.

Analyst Reveals Two XRP Price Levels To Watch, Is $250 On?

3 Meme Coins to Watch For The Last Week of February 2025

Ethereum Rollback Debate Intensifies After Bybit Hack
US SEC Faces Backlash as Bybit Hack Highlights Lack of Oversight

Berachain (BERA) Falls 15% After Recent Rally Surge

Bitcoin Could Rebound to $100,000 Soon Despite Bearish Pressure

2.52 Million Altcoins Are Ruining Crypto’s Future

Animoca Brands Valuation Tanks 75% In Two Years, Here’s Why

Crypto exchange BingX hacked for $43 million

Are The Big Players Losing Interest?

Hong Kong’s Securities Association Tips Authorities On Crypto Self-Regulation

Coinbase cbBTC Set to go Live on Solana
2.52 Million Altcoins Are Ruining Crypto’s Future
Animoca Brands Valuation Tanks 75% In Two Years, Here’s Why
Crypto exchange BingX hacked for $43 million
Are The Big Players Losing Interest?
Hong Kong’s Securities Association Tips Authorities On Crypto Self-Regulation
Coinbase cbBTC Set to go Live on Solana
-
 Regulation23 hours ago
Ripple Vs SEC Lawsuit May Take Longer To Settle Than Coinbase, Expert Warns
-

 Market23 hours ago
Ethereum Falls 5% Following $1.5 Billion Bybit Hack
-

 Market22 hours ago
XRP Whales Decline As Price Remains Consistently Below $3
-

 Market24 hours ago
FARTCOIN, POPCAT Decline, BRETT Rallies
-
 Altcoin23 hours ago
Franklin Templeton Files S-1 To Launch Spot Solana ETF with US SEC
-

 Market20 hours ago
Franklin Templeton Files For Solana Staking ETF
-

 Altcoin20 hours ago
Will XRP Price Hit $300 If US SEC Calls Off Ripple Lawsuit?
-
 Altcoin16 hours ago
BTC, ETH Drop As $566M Liquidated Amid Bybit Hack