
Ethereum
Ethereum Holds Multi-Year Bullish Structure – Time For A Comeback?

Ethereum has been closing between $2,650 and $2,750 for the past week, creating uncertainty in the short term. The price action remains indecisive as bulls struggle to reclaim the $2,800 level, a key supply zone that could determine Ethereum’s next move. While the long-term outlook remains uncertain, Ethereum is trading at crucial demand levels, facing continuous selling pressure that has kept price action muted.
Related Reading
Investors are trying to stay calm amid volatility, but fear is spreading as Ethereum shows signs of weakness compared to Bitcoin. Some analysts worry that if ETH fails to hold above $2,600, a deeper correction could follow. However, others remain optimistic, suggesting that ETH could be forming a long-term bullish structure.
Crypto analyst Jelle shared a technical analysis on X revealing that ETH still trades inside a multi-year ascending triangle, a formation that has historically signaled strong potential for a breakout. If ETH can hold above the current levels and push past the $2,800 mark, it could trigger a recovery toward the key $3,000 resistance. For now, all eyes are on Ethereum’s next move, as the coming days could be decisive in shaping its short-term trajectory.
Ethereum Testing Crucial Liquidity Levels
Ethereum is currently trading between key liquidity levels of short-term demand and supply, with price action trapped in a tight range. Over the past week, ETH has closed between $2,650 and $2,750, creating uncertainty about its short-term direction. Investors remain divided, with some expecting a further correction and extended consolidation phase, while others anticipate a recovery rally soon. The market is waiting for a breakout or breakdown confirmation to determine the next trend.
Related Reading
Ethereum is attempting to push above the $2,700 mark and hold it as support, which would be the first sign of bullish momentum. However, for a confirmed recovery phase, ETH must reclaim the $2,800 and $3,000 levels. These key resistance zones have acted as strong supply areas in the past and will likely dictate Ethereum’s next major move. If ETH fails to reclaim these levels, a deeper correction into lower demand around the $2,500 mark could take place.
Jelle’s analysis on X reveals that ETH is still trading inside a massive ascending triangle, a multi-year bullish pattern. He noted that fakeouts have occurred on both the upside and downside, taking out liquidity in both directions. With downside liquidity now taken, Jelle expects a comeback soon, suggesting ETH could soon attempt to reclaim lost ground.
If Ethereum manages to break above the $2,800 mark and sustain its momentum, a move toward the $3,000 level would be the next target. However, if selling pressure continues to dominate the market, ETH could remain in a consolidation phase or even experience further downside. The next few days will be crucial in determining whether ETH can regain bullish momentum or if a deeper correction is ahead.
Price Action Lacks Short-Term Direction
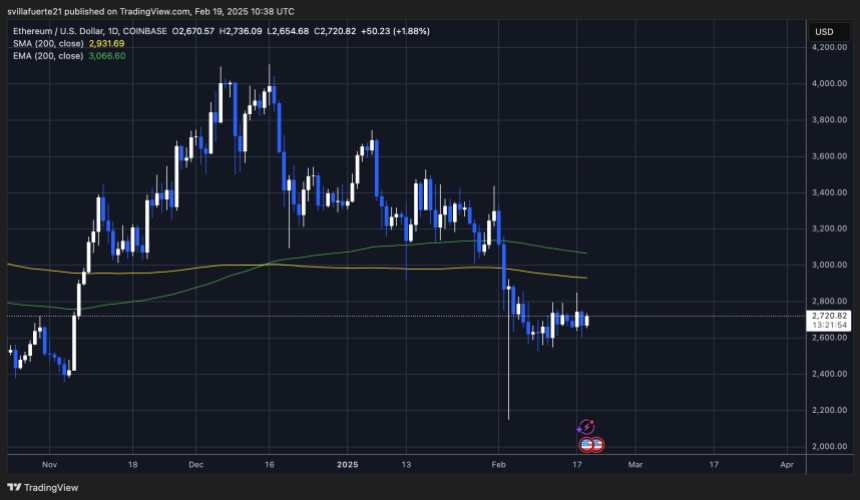
Ethereum is trading at $2,720 after days of sideways movement below the $2,800 mark, struggling to gain momentum for a breakout. Bulls need to step up and push the price above this level as soon as possible to shift sentiment and reclaim control of price action. The $2,800 mark has acted as a strong supply zone, and breaking above it would open the door for a move toward the $3,000 level.
On the downside, defending the $2,700 and even the $2,600 level is crucial for maintaining bullish momentum. If ETH holds these levels for an extended period, it would signal strong demand and support the possibility of a recovery rally. A sustained move above $2,700 would encourage buyers to step in, increasing the chances of ETH retesting higher resistance zones.
Related Reading
However, failure to hold above $2,700 could expose Ethereum to further selling pressure. If ETH drops below the $2,600 level, a deeper correction into lower demand areas around $2,500 could follow. The next few days will be decisive in determining whether Ethereum can establish a solid base for a bullish reversal or if bears will continue to dominate price action.
Featured image from Dall-E, chart from TradingView


Ethereum has yet to return to its all-time high for over three years, a stark contrast to Bitcoin, which has surged past many price levels in the current cycle. Despite being the second-largest cryptocurrency, Ethereum has struggled to keep up with the broader market even during price rallies. However, a new technical outlook suggests that Ethereum may soon break free from this underwhelming trend and push toward $4,867 based on a strong meeting of multiple technical indicators.
Extremely Strong Support Shows Ethereum Breakout Is Close
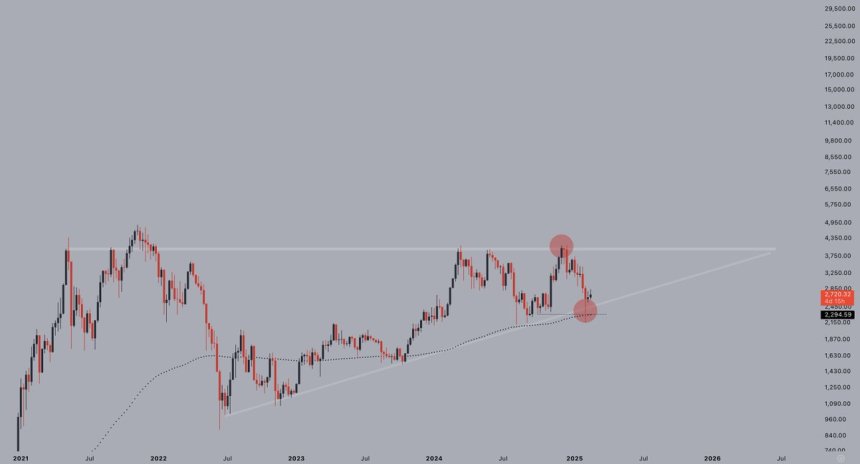
As revealed by a technical analyst on the TradingView platform, technical analysis of the Ethereum price poses a bullish outlook to finally break above its all-time high of $4,878. Ethereum is currently positioned at a key inflection point, where it is trading just above a multi-year support trendline. Notably, this trendline has acted as a solid foundation during previous downturns, allowing ETH to consistently rebound after touching this level. Given this historical precedent, the next expected move is another upward bounce, potentially setting the stage for a renewed bullish push.
Related Reading
The strength of this support trendline is further reinforced by key Fibonacci levels, which have previously served as inflection points for Ethereum’s major rallies. At present, Ethereum is positioned around the 14.6% Fib retracement level from its break above $4,000 in September 2024, which is a zone that has historically caused reversals and strong bullish momentum.

In addition to the Fibonacci level, Ethereum’s price structure is also currently supported by the monthly 55 Exponential Moving Average (EMA), which is typically known for marking long-term bullish trends. This adds weight to a bounce on the multi-year support trendline.
Triangle Formation Confirms The Explosive Move
The analyst also noted that ETH has been trading within a triangle pattern in a multi-month timeframe. Triangle patterns often signal a period of consolidation before a strong move in either direction and in Ethereum’s case, the supporting trendlines and Fibonacci levels suggest a higher probability of an upward breakout.
Related Reading
The specific pattern forming on Ethereum’s chart is an ascending triangle, a bullish continuation pattern characterized by a rising lower trendline and a horizontal resistance zone. The upper resistance trendline for this formation sits around the $4,000 mark, a level that has proven difficult to breach three different times this cycle. However, the next try could cause a breakout if Ethereum continues to build on the growing bullish signals with the Fib level and the 50 EMA. Once Ethereum clears the ascending triangle’s upper resistance, the next primary price target would be around $4,867, its current all-time high.
At the time of writing, Ethereum is trading at $2,760, up by 1.1% in the past 24 hours.
Featured image from Ethereum, chart from Tradingview.com

Ethereum has been attempting to reclaim the $2,800 level for days, but bears continue to apply selling pressure, keeping the price below this key resistance. Despite this, demand remains strong, with bulls successfully holding ETH above the crucial $2,600 support level. The short-term outlook for ETH remains uncertain, as investors speculate on whether the current consolidation phase will lead to a breakout or further declines.
Related Reading
Despite this, there is a growing sentiment that Ethereum could soon recover. Top analyst Jelle shared a technical analysis on X, revealing that ETH recently took out the lows, retested the key trendline, bounced off key support, and held above the 200-week exponential moving average (EMA). According to Jelle, this confirms that the uptrend structure remains intact, suggesting that ETH still has bullish potential.
While price action remains sluggish, Jelle’s analysis highlights that Ethereum is still holding critical levels, which could lead to a strong move upward. If ETH reclaims $2,800 in the coming days, momentum could build toward a push above $3,000. However, if selling pressure continues and ETH loses $2,600, a deeper retrace could be expected. For now, patience is key as Ethereum hovers near crucial technical levels.
Ethereum Price Signals Potential Recovery Phase
Ethereum has been attempting to reclaim the $2,800 level for the past few days, with bulls struggling to confirm a recovery rally into higher supply zones. Price action remains uncertain, as investors watch closely to see whether ETH can push past this resistance or if selling pressure will drive it lower. The ongoing volatility has kept traders on edge, with some fearing that Ethereum might continue to drop further, testing lower support levels before any potential recovery.
Related Reading
Market sentiment remains divided, with one side expecting a prolonged consolidation or further correction, while the other believes ETH is on the verge of a breakout. Analysts suggest that Ethereum is at a critical juncture, and the coming days could define its short-term trajectory.
Jelle’s technical analysis explains that ETH’s recent price action took out its previous lows, retesting the key trendline and holding above the 200-week exponential moving average (EMA) are all good signs. Jelle says the uptrend structure remains intact despite the slow price movement. He acknowledges that this may be one of the slowest uptrends Ethereum has ever experienced, but he still sees bullish momentum building.

Jelle also doubts that bears will be able to defend the $4,000 level once more if Ethereum gains strength. As ETH continues to hold key support levels and attempts to reclaim the $2,800 mark, a breakout could lead to a significant rally in the coming weeks. Investors are advised to remain patient as Ethereum navigates this critical phase, with many closely watching for potential trend confirmation.
ETH Testing Short-Term Supply
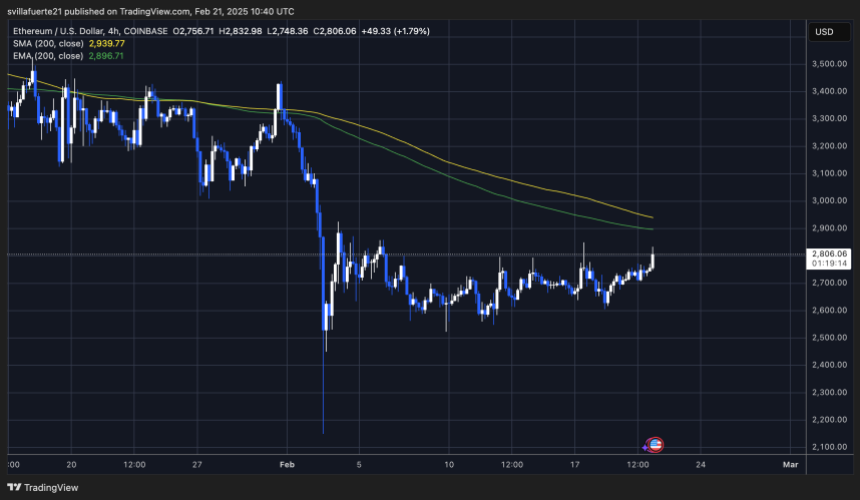
Ethereum is trading at $2,805, attempting to hold this level and push higher to confirm a recovery rally. Bulls are trying to establish support at this key price zone, aiming to regain momentum after weeks of consolidation. The price is just 7% away from the critical $3,000 mark, which sits slightly above the 4-hour 200 Moving Average. A break above $2,950 and a successful hold above this level would likely trigger an aggressive bullish recovery, pushing ETH toward higher resistance levels.
However, if Ethereum fails to hold above $2,800, the bullish momentum could weaken, leading to another round of selling pressure. In that case, ETH could drop back toward the $2,600 demand zone or even lower. This level has previously acted as strong support, and losing it could indicate further downside risks.
Related Reading
For now, Ethereum remains at a pivotal point, where bulls must step up to maintain short-term strength. A breakout above resistance could fuel renewed optimism among investors, while failure to sustain current levels may lead to continued market uncertainty. All eyes are on ETH’s ability to reclaim and consolidate above key resistance levels to determine its next major move.
Featured image from Dall-E, chart from TradingView

The Ethereum price is drawing attention to its potential future outlook, as a crypto pundit points to a striking resemblance between the altcoin’s price action and Bitcoin’s during the 2015-2017 bull cycle. The analyst’s technical chart analysis suggests that ETH is destined for a breakout to $10,000 this cycle, marking new all-time highs.
Ethereum Price Chart Mirror’s Bitcoin Historic Breakout
According to Ted Pillows, a crypto pundit on X (formerly Twitter), a comparative analysis of Etheruem’s current price movement and that of Bitcoin during a previous bull cycle highlights a familiar bullish pattern. Based on this past trend, the analyst confidently predicts that Ethereum will hit $10,000 this cycle.
Between the bull market in 2015 and 2017, the Bitcoin price hit a bear market bottom between $201 and $205. After experiencing a bit of consolidation and volatility, the cryptocurrency eventually skyrocketed to a historic rally towards $685 and $785, marking new ATHs at the time. This massive surge occurred after Bitcoin broke out of resistance levels around the $465 threshold.
Based on the Pillows’ hypothesis, Ethereum appears to be following a similar trajectory, having completed its accumulation phase and recently breaking through major resistance levels. The number one altcoin has also experienced significant volatility recently, struggling to recover from previous bearish trends and market sell offs that pushed its value below the $3,000 price high.

While still in consolidation, as no strong surge has been recorded in the Ethereum price recently, Pillows highlights factors that could reinforce the altcoin’s bullish outlook. The analyst mentioned Ethereum’s Total Value Locked (TVL) and Stablecoin liquidity dominance. Currently, ETH leads in DeFi, securing the highest TVL across all platforms in the space.
Pillows also highlighted the impact of institutional demand and accumulation. As these factors increase, Ethereum could gain more exposure, potentially boosting its long-term value. Lastly, the analyst mentioned that Ethereum currently has a lower inflation rate than Bitcoin and 99% of the altcoins in the market.
Based on these seemingly bullish factors, Pillows urges investors and traders to set their sights higher, dismissing a $5,000 target as too conservative and advocating for a more ambitious $10,000 projection.
ETH Whales Get Back In Action
While analysts share their optimistic projections about Ethereum’s future outlook, whales are getting in on the ground floor and buying ETH tokens in droves. While the recent decline in the price of ETH may have caused panic selling for some, deep-pocketed investors have taken the market crash as an opportunity to accumulate.
According to TradeerPA, a crypto analyst on X, new reports show that ETH has been getting rapidly accumulated by Ethereum whales. Due to this accumulation trend, the analyst advocates for a price rally to new ATHs, driven by a positive shift in market sentiment and increased demand.
Featured image from Adobe Stock, chart from Tradingview.com

Lazarus Group Committed $1.5 Billion Bybit Hack

XRP Whales Decline As Price Remains Consistently Below $3

Franklin Templeton Files S-1 To Launch Spot Solana ETF with US SEC

Ethereum Falls 5% Following $1.5 Billion Bybit Hack

Ripple Vs SEC Lawsuit May Take Longer To Settle Than Coinbase, Expert Warns

FARTCOIN, POPCAT Decline, BRETT Rallies

2.52 Million Altcoins Are Ruining Crypto’s Future

Animoca Brands Valuation Tanks 75% In Two Years, Here’s Why

Crypto exchange BingX hacked for $43 million

Are The Big Players Losing Interest?

Hong Kong’s Securities Association Tips Authorities On Crypto Self-Regulation

Coinbase cbBTC Set to go Live on Solana
2.52 Million Altcoins Are Ruining Crypto’s Future
Animoca Brands Valuation Tanks 75% In Two Years, Here’s Why
Crypto exchange BingX hacked for $43 million
Are The Big Players Losing Interest?
Hong Kong’s Securities Association Tips Authorities On Crypto Self-Regulation
Coinbase cbBTC Set to go Live on Solana
-

 Regulation9 hours ago
Coinbase scores major win as SEC set to drop lawsuit
-
 Market22 hours ago
Pi Network (PI) Hits Record Airdrop But Momentum Falters
-

 Market21 hours ago
SUI Targets Bullish Breakout with Golden Cross Potential
-

 Market20 hours ago
Bitcoin Price Recovers Strongly—Is a New Rally Beginning?
-
 Altcoin20 hours ago
XRP Price Eyes New ATH As Grayscale’s XRP ETF Filing Enters US SEC Review
-

 Market19 hours ago
Trust Wallet Discusses the Challenges and Future of Crypto Wallets
-

 Market24 hours ago
KAITO Price Attempts Recovery as Top Holders Exit Post-Airdrop
-
 Altcoin24 hours ago
Can Shiba Inu Price Surge 422%? This Pattern Signal SHIB New All-Time High