
Market
PEPE Flashes Reversal Signal To Recoup The 800 EMA, What This Means For Price

Meme coin PEPE is showing signs of bullishness in a market currently filled with uncertainty. This bullish sign is reflected through PEPE’s projected breakout of the 800 EMA, which is a sign of bullish reversal.
This bullish case for PEPE was first noted by a crypto analyst known pseudonymously as Slick on social media platform X. The 800 EMA, which has served as a significant resistance level for PEPE price uptrends, is now being tested again after a prolonged period below it.
PEPE Eyes 800 EMA Breakout After Weeks Of Rejection
PEPE is showing signs of a potential bullish reversal, with the price moving toward a critical technical level that could redefine its short-term trajectory. This critical technical level is highlighted through technical analysis of the 800 EMA indicator.
Related Reading
Since January 19, PEPE has consistently traded below the 800 EMA, a trend that has kept the price subdued despite several attempts to break higher. However, recent price action suggests that this prolonged bearish structure may be coming to an end.
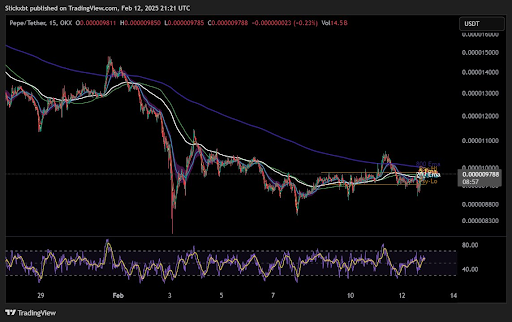
The moving averages are converging more than the previous attempts. The current setup shows a stronger alignment between the short and long-term EMAs, which indicates weakening resistance and increases the probability of an upward breakout. However, this attempt to break above the 800 EMA is most convincing on the 15-minute candlestick timeframe and is yet to be evident on larger timeframes.
Will This Snowball Into A Larger Timeframe Reversal?
The question is whether PEPE’s breakout attempt above the 800 EMA on the 15-minute chart will spark a broader shift in momentum across higher timeframes. Short-term breakouts like this serve as the primer for larger trend reversals, particularly when aligned with technical indicators such as the Exponential Moving Averages (EMAs).
Related Reading
A successful breakout here could bring higher timeframe levels into play, which would mean a longer-term bullish momentum. However, there’s still a risk of a PEPE price rejection at the 800 EMA, even on the 15-minute candlestick timeframe. As shown in the price chart above, this rejection has already happened twice this month, once at the start of January and again on January 11.
However, the current test is more peculiar because other EMAs, including the 200 EMA, have now converged more closely than during the previous failed breakouts. This alignment suggests that resistance may be weakening and increases the likelihood of a decisive move higher.
At the time of writing, PEPE is trading at $0.000009829, up by 3.13% in the past 24 hours. The increase in the past 24 hours is a positive signal for PEPE’s breakout from the 15-minute 800 EMA to larger timeframes.
However, there is still work to do, as PEPE is currently down by 3.85% in a seven-day timeframe. There is also a notable resistance at $0.00001019 that could delay any further uptrend move.
Featured image from iStock, chart from Tradingview.com


Layer-1 (L1) coin Cardano has recorded a 10% gain over the past week, positioning itself for an extended rally.
The altcoin is now trading close to its 20-day Exponential Moving Average (EMA), a key technical level that, if breached, could validate the ongoing rally and open the door to fresh highs.
ADA Approaches Key Breakout Zone Amid Surge in Buying Pressure
ADA currently trades near its 20-day EMA and is poised to climb above it. This key moving average measures an asset’s average price over the past 20 trading days, giving more weight to recent prices.
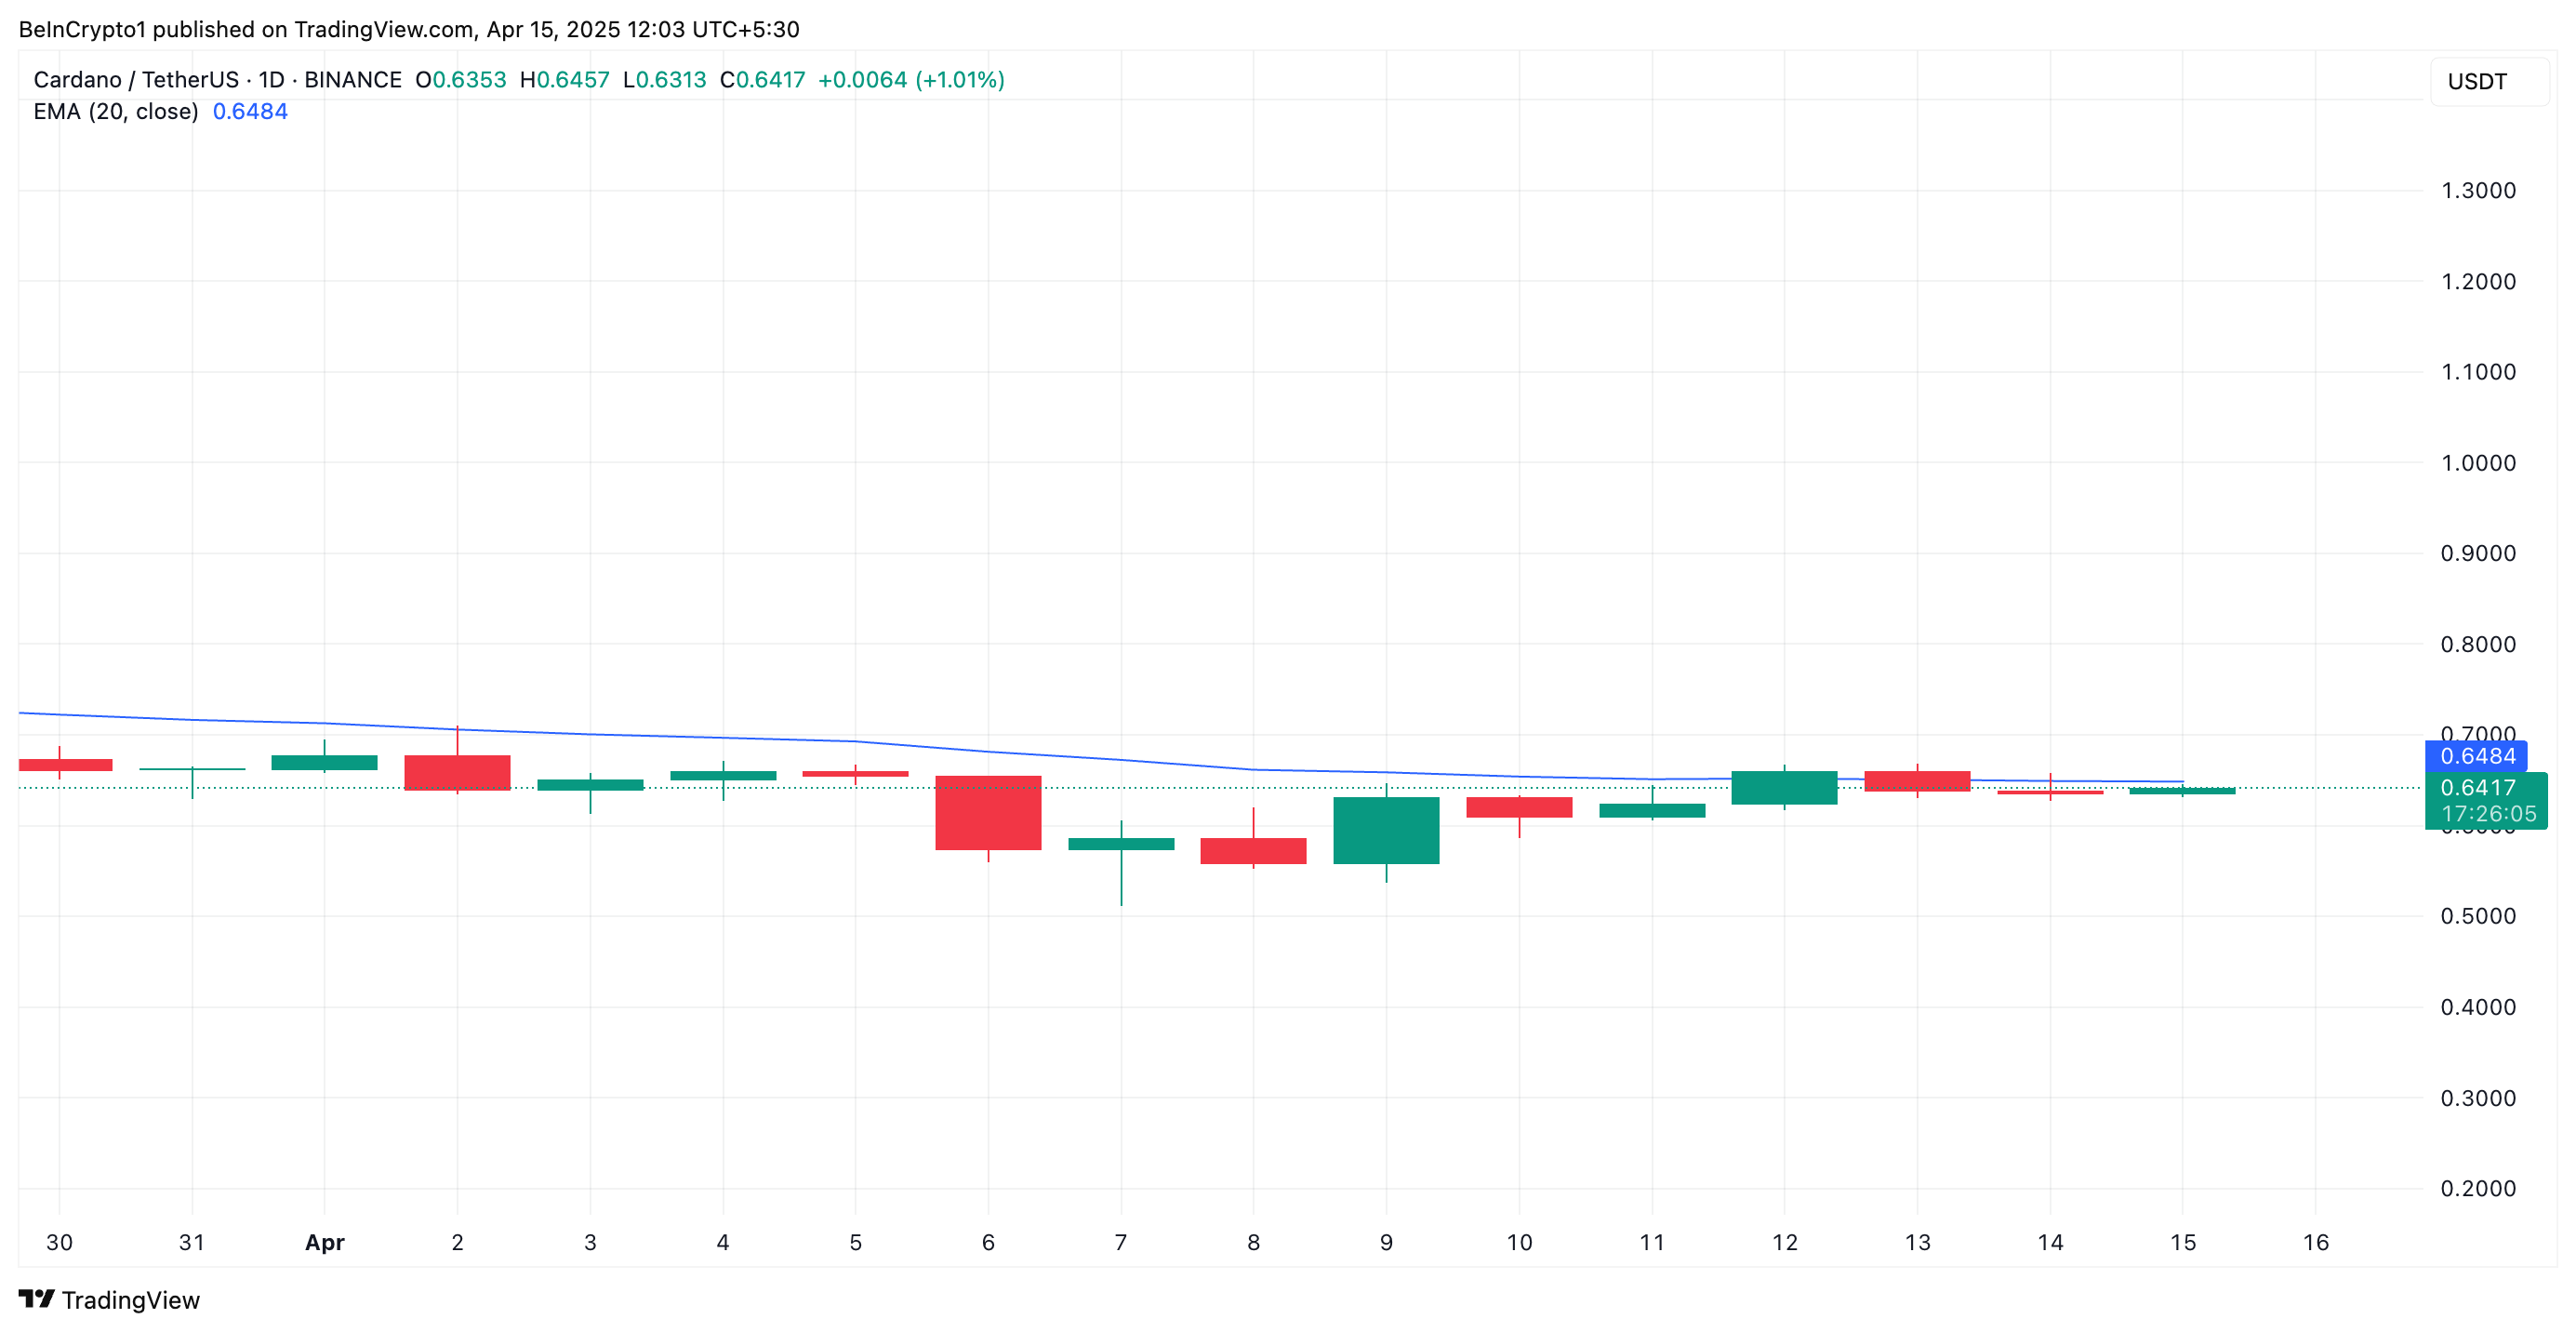
When an asset is about to rally above its 20-day EMA, it signals a shift in short-term momentum from bearish to bullish. This crossover signals that ADA buying pressure is increasing and confirms that the asset has entered an upward trend.
ADA’s successful break above the 20-day EMA would signal renewed momentum and act as a dynamic support level for the coin’s price, giving buyers more control.
On-chain metrics further support the bullish outlook. According to Santiment, ADA’s Network Realized Profit/Loss (NPL) has turned negative, indicating that most holders are currently at a loss.
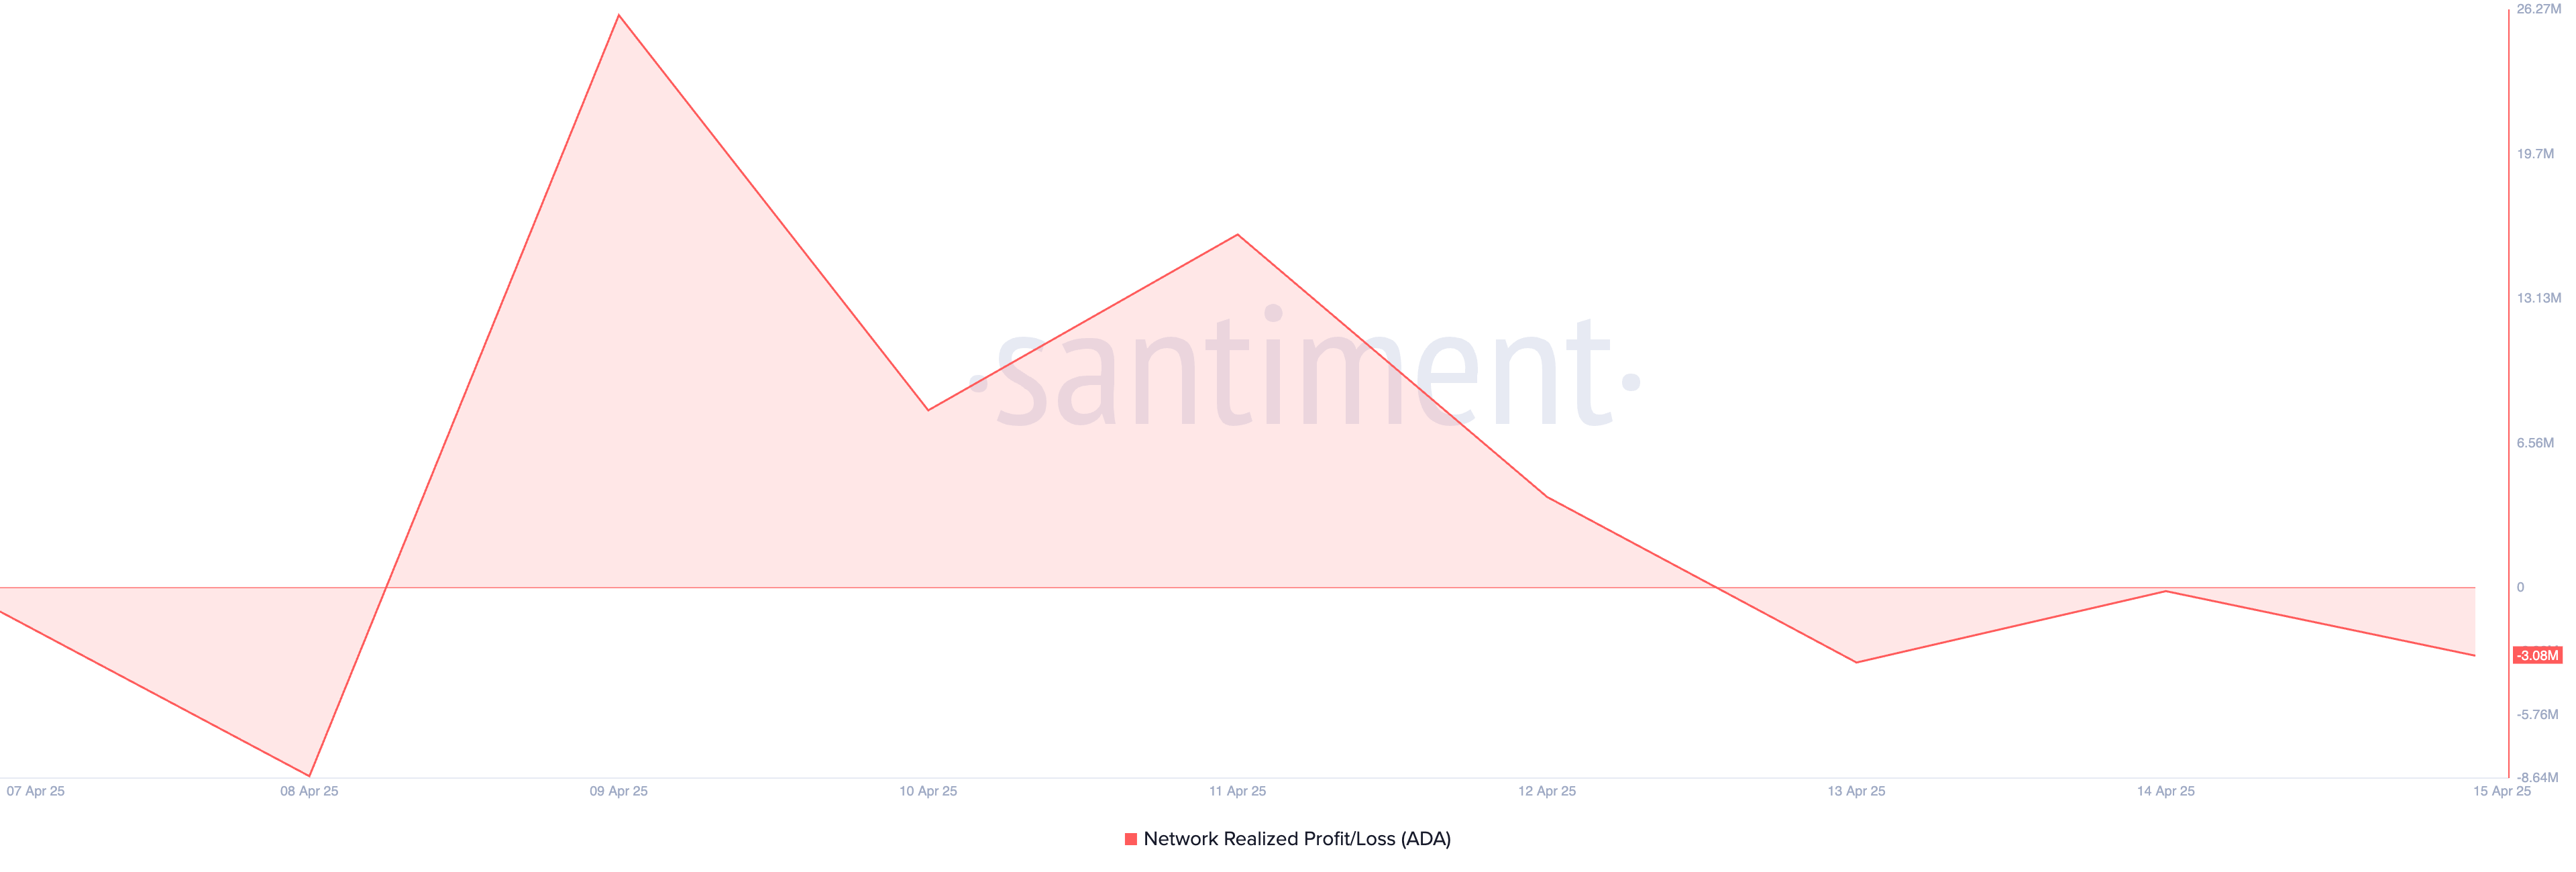
Historically, this discourages selling pressure as traders are less willing to part with their assets at a loss. This behavior encourages longer holding periods, which in turn tightens supply and can drive up ADA’s price in the short term.
Cardano Bulls in Control
On the ADA/USD one-day chart, the coin’s positive Chaikin Money Flow (CMF) reinforces this bullish outlook. At press time, this indicator, which measures how money flows into and out of an asset, is at 0.04.
A positive CMF reading like this indicates that buying pressure outweighs selling pressure. It reflects strong capital inflows into ADA, suggesting that its investors are accumulating rather than offloading their positions. ADA could extend its rally and climb to $0.70 if this trend persists.
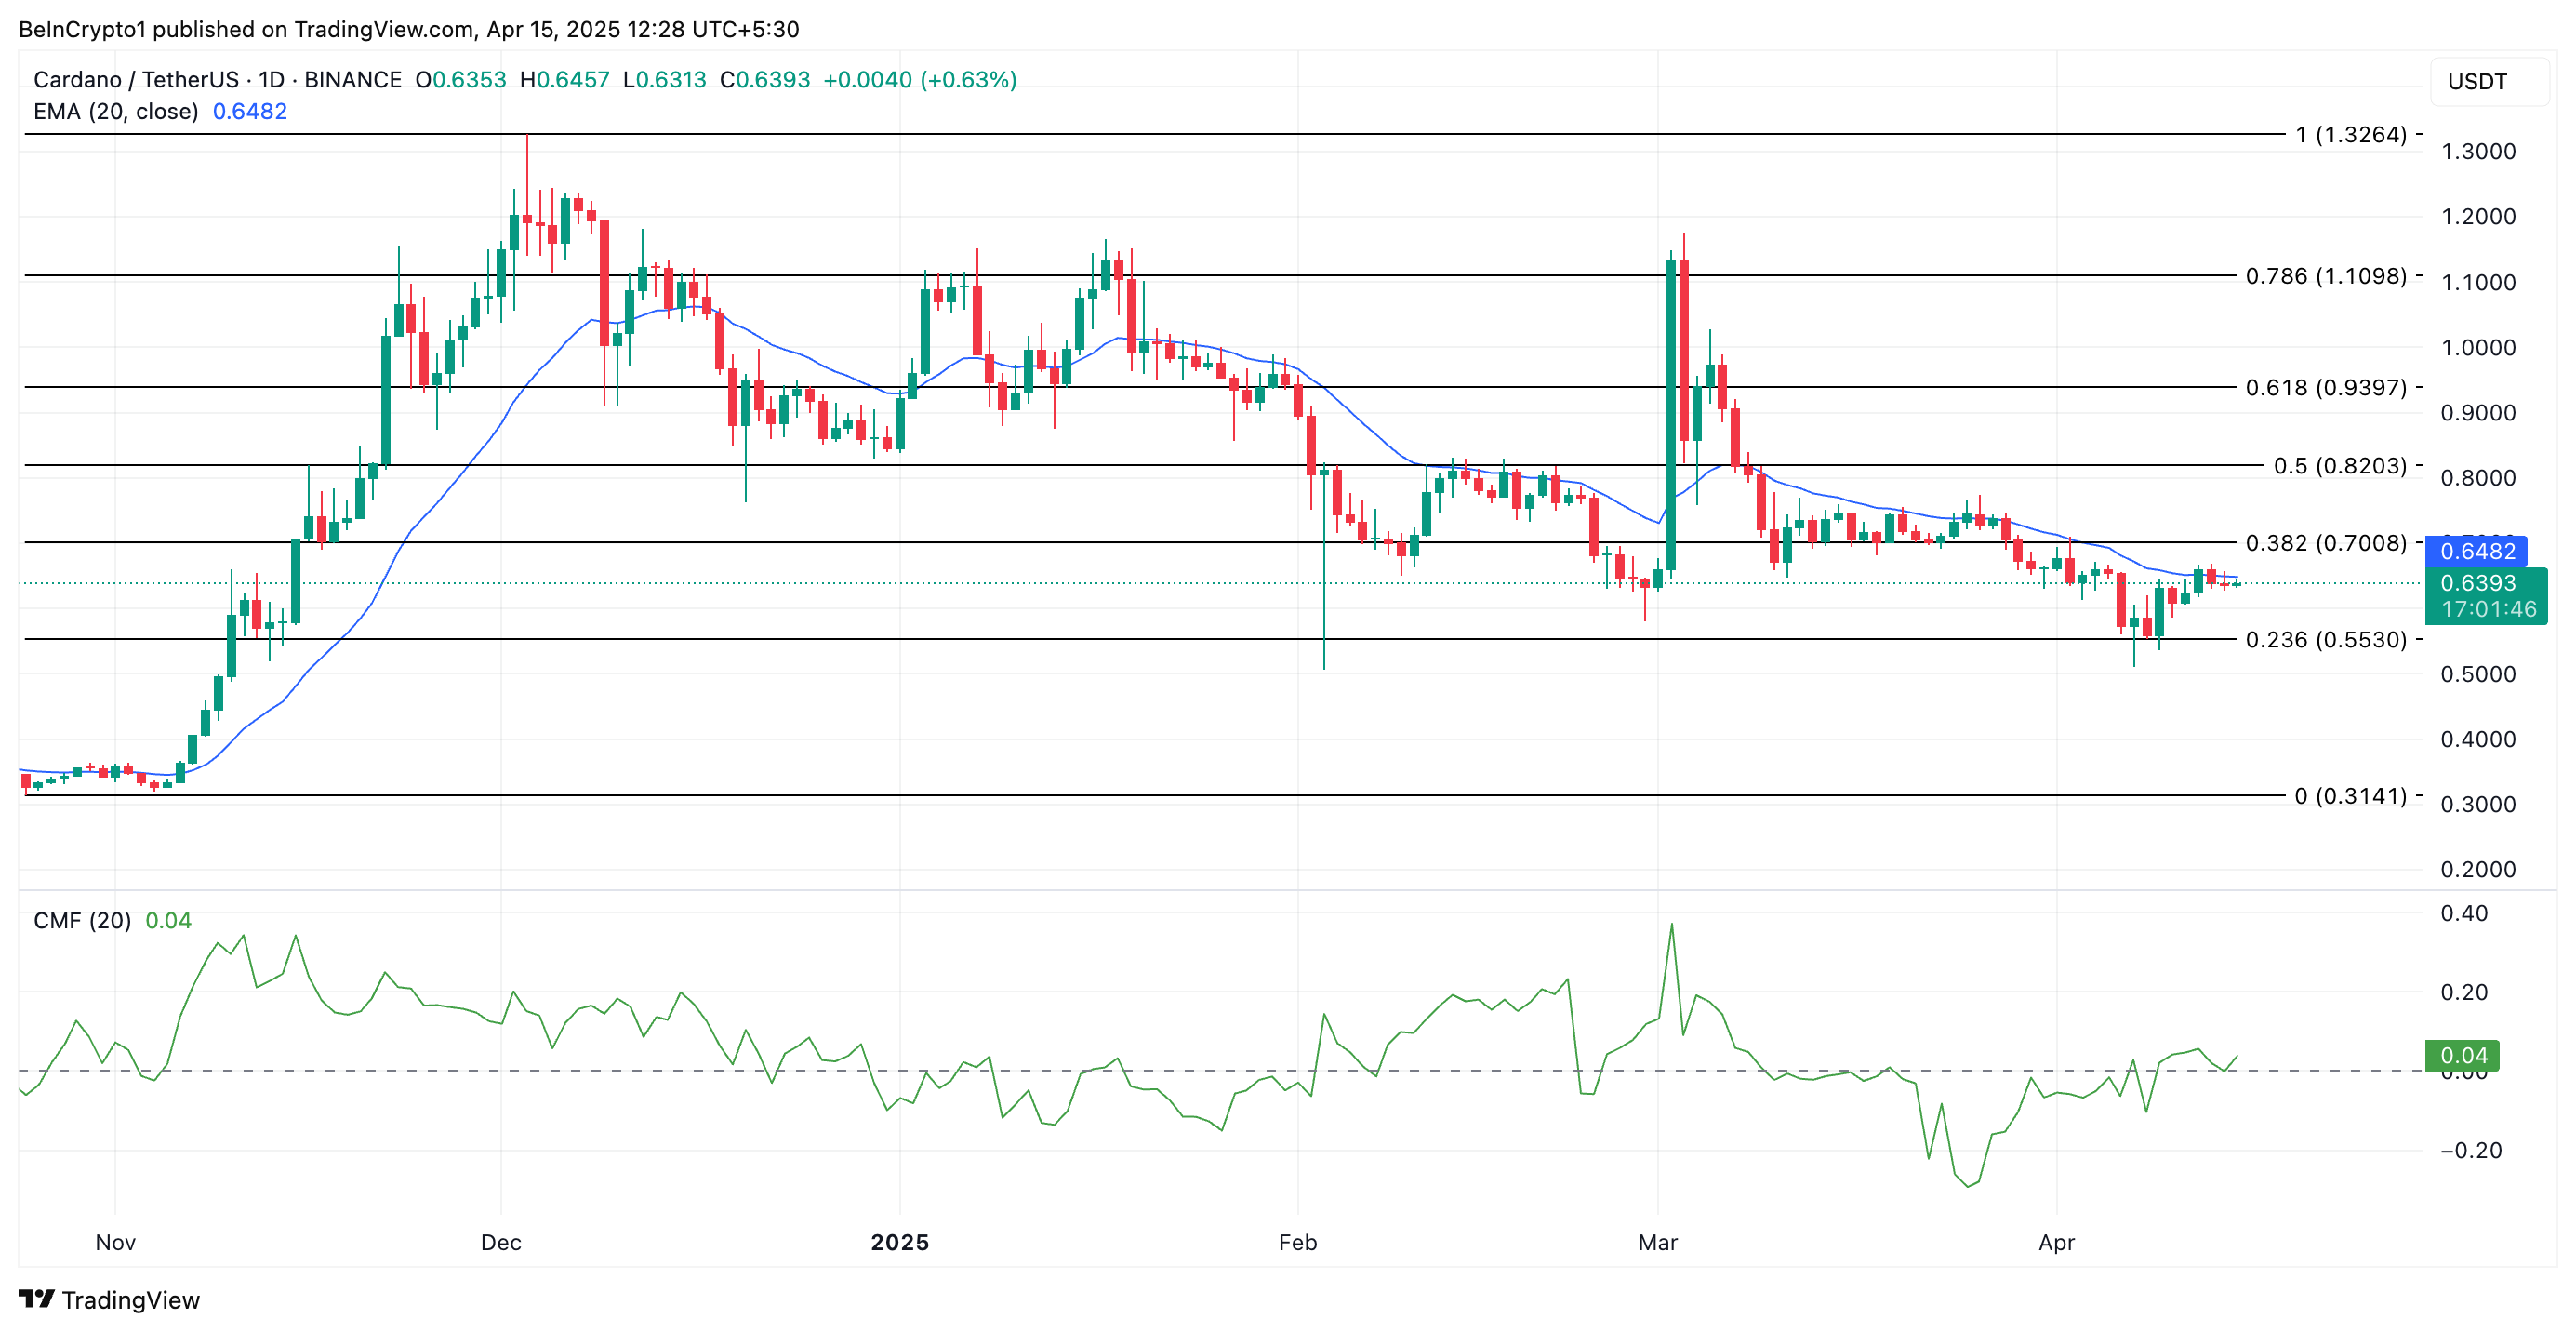
However, if profit-taking resumes, ADA could reverse its rally and fall to $0.55.
Disclaimer
In line with the Trust Project guidelines, this price analysis article is for informational purposes only and should not be considered financial or investment advice. BeInCrypto is committed to accurate, unbiased reporting, but market conditions are subject to change without notice. Always conduct your own research and consult with a professional before making any financial decisions. Please note that our Terms and Conditions, Privacy Policy, and Disclaimers have been updated.
Aayush Jindal, a luminary in the world of financial markets, whose expertise spans over 15 illustrious years in the realms of Forex and cryptocurrency trading. Renowned for his unparalleled proficiency in providing technical analysis, Aayush is a trusted advisor and senior market expert to investors worldwide, guiding them through the intricate landscapes of modern finance with his keen insights and astute chart analysis.
From a young age, Aayush exhibited a natural aptitude for deciphering complex systems and unraveling patterns. Fueled by an insatiable curiosity for understanding market dynamics, he embarked on a journey that would lead him to become one of the foremost authorities in the fields of Forex and crypto trading. With a meticulous eye for detail and an unwavering commitment to excellence, Aayush honed his craft over the years, mastering the art of technical analysis and chart interpretation.
As a software engineer, Aayush harnesses the power of technology to optimize trading strategies and develop innovative solutions for navigating the volatile waters of financial markets. His background in software engineering has equipped him with a unique skill set, enabling him to leverage cutting-edge tools and algorithms to gain a competitive edge in an ever-evolving landscape.
In addition to his roles in finance and technology, Aayush serves as the director of a prestigious IT company, where he spearheads initiatives aimed at driving digital innovation and transformation. Under his visionary leadership, the company has flourished, cementing its position as a leader in the tech industry and paving the way for groundbreaking advancements in software development and IT solutions.
Despite his demanding professional commitments, Aayush is a firm believer in the importance of work-life balance. An avid traveler and adventurer, he finds solace in exploring new destinations, immersing himself in different cultures, and forging lasting memories along the way. Whether he’s trekking through the Himalayas, diving in the azure waters of the Maldives, or experiencing the vibrant energy of bustling metropolises, Aayush embraces every opportunity to broaden his horizons and create unforgettable experiences.
Aayush’s journey to success is marked by a relentless pursuit of excellence and a steadfast commitment to continuous learning and growth. His academic achievements are a testament to his dedication and passion for excellence, having completed his software engineering with honors and excelling in every department.
At his core, Aayush is driven by a profound passion for analyzing markets and uncovering profitable opportunities amidst volatility. Whether he’s poring over price charts, identifying key support and resistance levels, or providing insightful analysis to his clients and followers, Aayush’s unwavering dedication to his craft sets him apart as a true industry leader and a beacon of inspiration to aspiring traders around the globe.
In a world where uncertainty reigns supreme, Aayush Jindal stands as a guiding light, illuminating the path to financial success with his unparalleled expertise, unwavering integrity, and boundless enthusiasm for the markets.

After seven straight days of outflows, institutional investors seem to have rekindled their love for Bitcoin ETFs. Since April 2, US-listed spot Bitcoin ETFs have posted net inflows for the first time, drawing $1.47 million in fresh capital on Monday.
While this figure is modest, it marks a notable shift in sentiment and the first sign of renewed institutional appetite for Bitcoin exposure through regulated funds.
Bitcoin ETFs End 7-Day Drought With Modest Inflows
Last week, Bitcoin investment funds recorded $713.30 million in net outflows as the broader cryptocurrency market struggled to stay afloat amid the growing impact of Donald Trump’s escalating trade war rhetoric.
But the tide may be starting to turn.
On Monday, U.S.-listed spot BTC ETFs recorded $1.47 million in net inflows, marking the first capital flow into these funds since April 2. While the amount is modest, it breaks a nearly two-week drought and could signal a gradual shift in institutional sentiment toward BTC.

The largest daily net inflow came from BlackRock’s IBIT, attracting $36.72 million. This brings its total cumulative net inflows to $39.60 billion.
On the other hand, Fidelity’s FBTC recorded the largest net outflow on Monday, shedding $35.25 million in a single day.
BTC Derivatives Market Heats Up Despite Cautious Options Flow
On the derivatives side, BTC’s futures open interest has edged higher over the past 24 hours, signaling increased derivatives activity.
At press time, this sits at $56 billion, rising by 2% in the past day. Notably, during the same period, BTC’s period has climbed by 1.22%.

BTC’s futures open interest refers to the total number of outstanding futures contracts that have yet to be settled. When it rises during a price uptick like this, it suggests that new money is entering the market to support the upward move, potentially reinforcing bullish momentum.
However, there’s a catch. While open interest in BTC futures has increased, the nature of these new positions appears to be bearish. This is evident in the coin’s funding rate, which has now flipped negative for the first time since April 2.
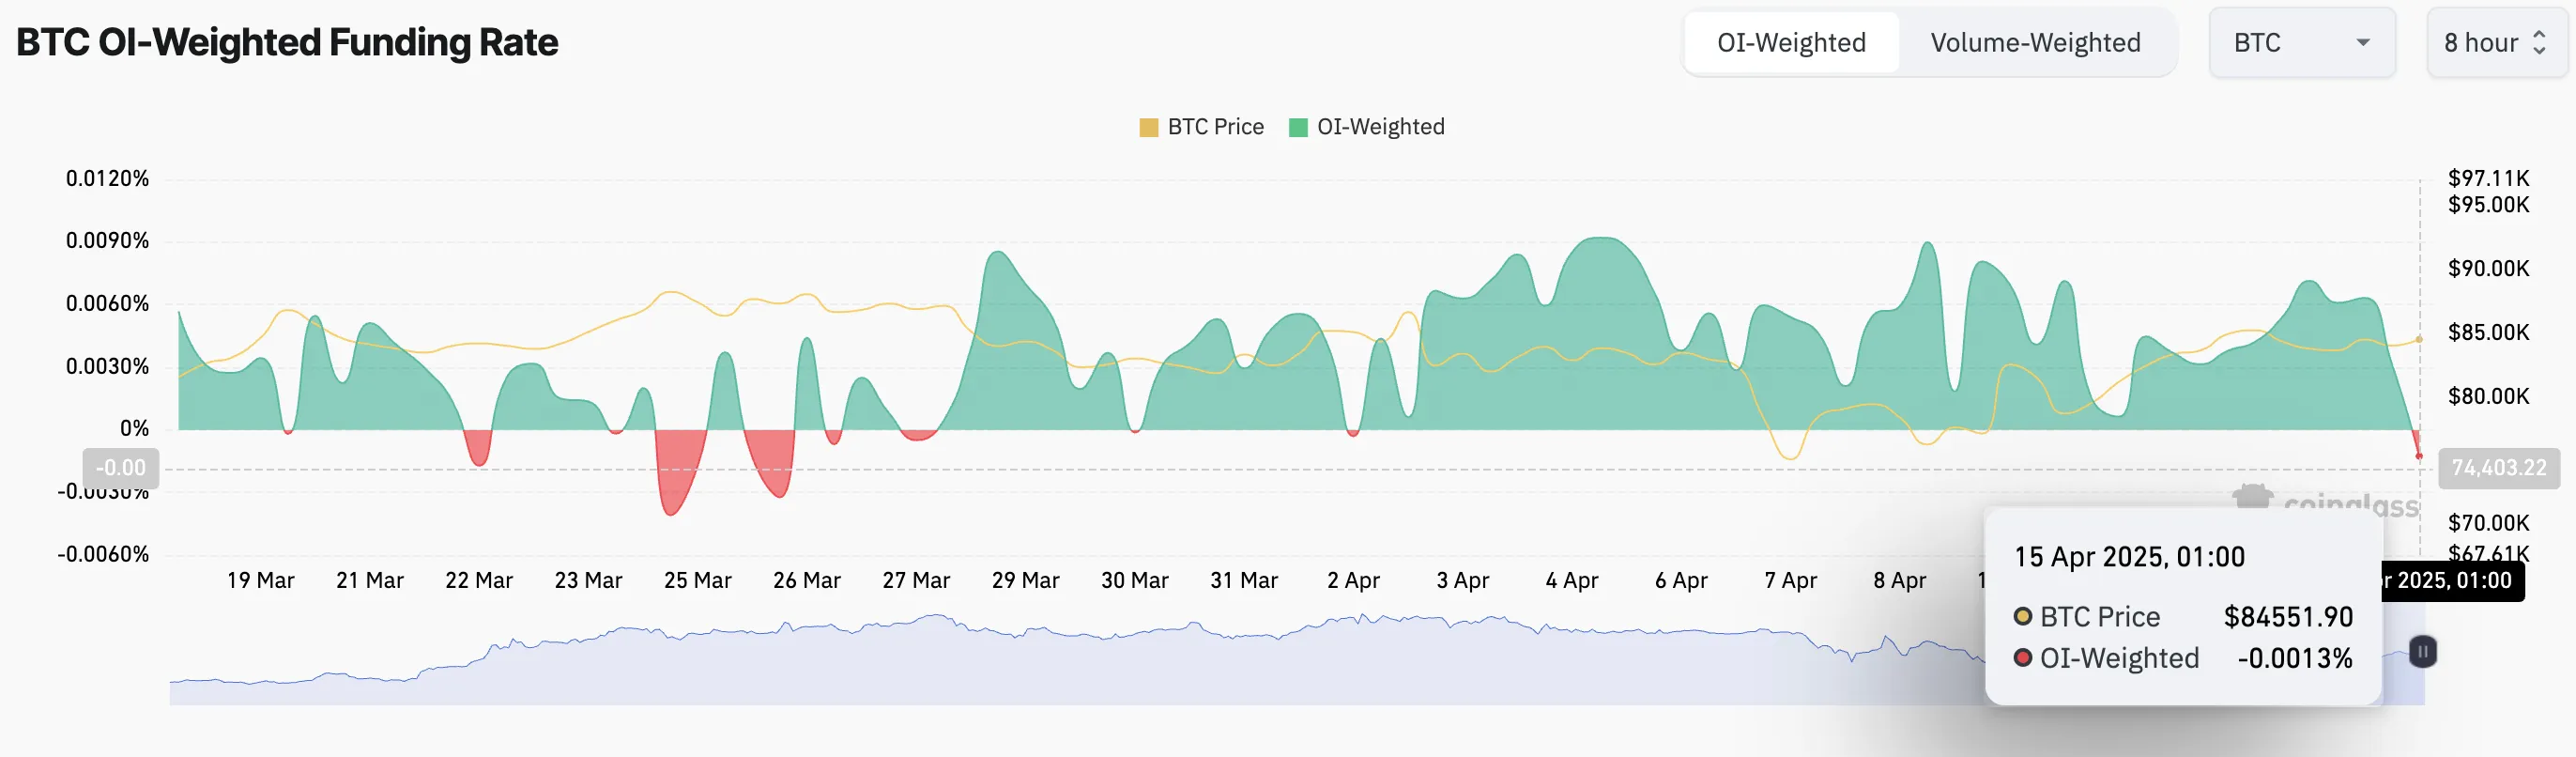
This means that more BTC traders are paying to hold short positions than longs, suggesting that a growing number of market participants are betting on a potential pullback despite the modest inflows into spot ETFs.
Moreover, the mood remains cautious on the options side. Today, there are more put contracts than calls, signaling that some traders may be hedging their bets or anticipating further downside, even as other indicators turn bullish.

Still, for BTC ETFs, any inflow after two weeks of silence feels like a win. With the broader market sentiment toward the coin turning increasingly bullish, it remains to be seen if this trend could persist for the remainder of the week.
Disclaimer
In line with the Trust Project guidelines, this price analysis article is for informational purposes only and should not be considered financial or investment advice. BeInCrypto is committed to accurate, unbiased reporting, but market conditions are subject to change without notice. Always conduct your own research and consult with a professional before making any financial decisions. Please note that our Terms and Conditions, Privacy Policy, and Disclaimers have been updated.

Cardano Buyers Eye $0.70 as ADA Rallies 10%

XRP Price Could Regain Momentum—Is a Bullish Reversal in Sight?

SEC Delays Decision On Staking For Grayscale’s Ethereum ETFs
Bitcoin ETFs End Dry Spell with Fresh Capital

Shiba Inu Burn Rate Blows Up 2000%; Is SHIB Price Gearing Up For A Pump?

Trump’s Tariffs Spark Search for Jerome Powell’s Successor

2.52 Million Altcoins Are Ruining Crypto’s Future

Animoca Brands Valuation Tanks 75% In Two Years, Here’s Why

Crypto exchange BingX hacked for $43 million

Are The Big Players Losing Interest?

Hong Kong’s Securities Association Tips Authorities On Crypto Self-Regulation

Coinbase cbBTC Set to go Live on Solana
2.52 Million Altcoins Are Ruining Crypto’s Future
Animoca Brands Valuation Tanks 75% In Two Years, Here’s Why
Crypto exchange BingX hacked for $43 million
Are The Big Players Losing Interest?
Hong Kong’s Securities Association Tips Authorities On Crypto Self-Regulation
Coinbase cbBTC Set to go Live on Solana
-

 Market23 hours ago
XRP Outflows Cross $300 Million In April, Why The Price Could Crash Further
-

 Altcoin24 hours ago
Binance Breaks Silence Amid Mantra (OM) 90% Price Crash
-
 Altcoin21 hours ago
XRP Price Climbs Again, Will XRP Still Face a Death Cross?
-

 Market22 hours ago
FLR Token Hits Weekly High, Outperforms Major Coins
-
 Altcoin20 hours ago
Analyst Predicts Dogecoin Price Rally To $0.29 If This Level Holds
-

 Market19 hours ago
Solana Futures Traders Eye $147 as SOL Recovers
-

 Market24 hours ago
User Data from Major Crypto Exchanges Leaked to Dark Web
-

 Market16 hours ago
MENAKI Leads Cat Themed Tokens