
Market
SHIB Price Jumps 8%, But Whale Holdings Hit 2-Year Low

Shiba Inu (SHIB) price is up 8% in the last seven days as it attempts to recover from a 25% decline over the past month. Currently sitting at a $9.5 billion market cap, SHIB is working its way back toward the $10 billion mark, solidifying its position as the second-largest meme coin, only behind Dogecoin (DOGE).
Despite this short-term gain, key indicators show mixed signals, with RSI failing to reach overbought levels and whale holdings continuing to decline. Whether SHIB can sustain its recovery or face further downside will depend on its ability to break key resistance levels and regain stronger buying momentum.
SHIB RSI Failed to Reach 70 Yesterday
Shiba Inu RSI is currently at 51.6 after rising to 67.6 yesterday. This movement shows that buying momentum increased but failed to push RSI into the overbought zone.
The fact that RSI reached its highest level since January 17 without surpassing 70 suggests that SHIB buying pressure was strong but not overwhelming. Now that RSI has dropped back to a neutral level, price action could stabilize before deciding on its next move.
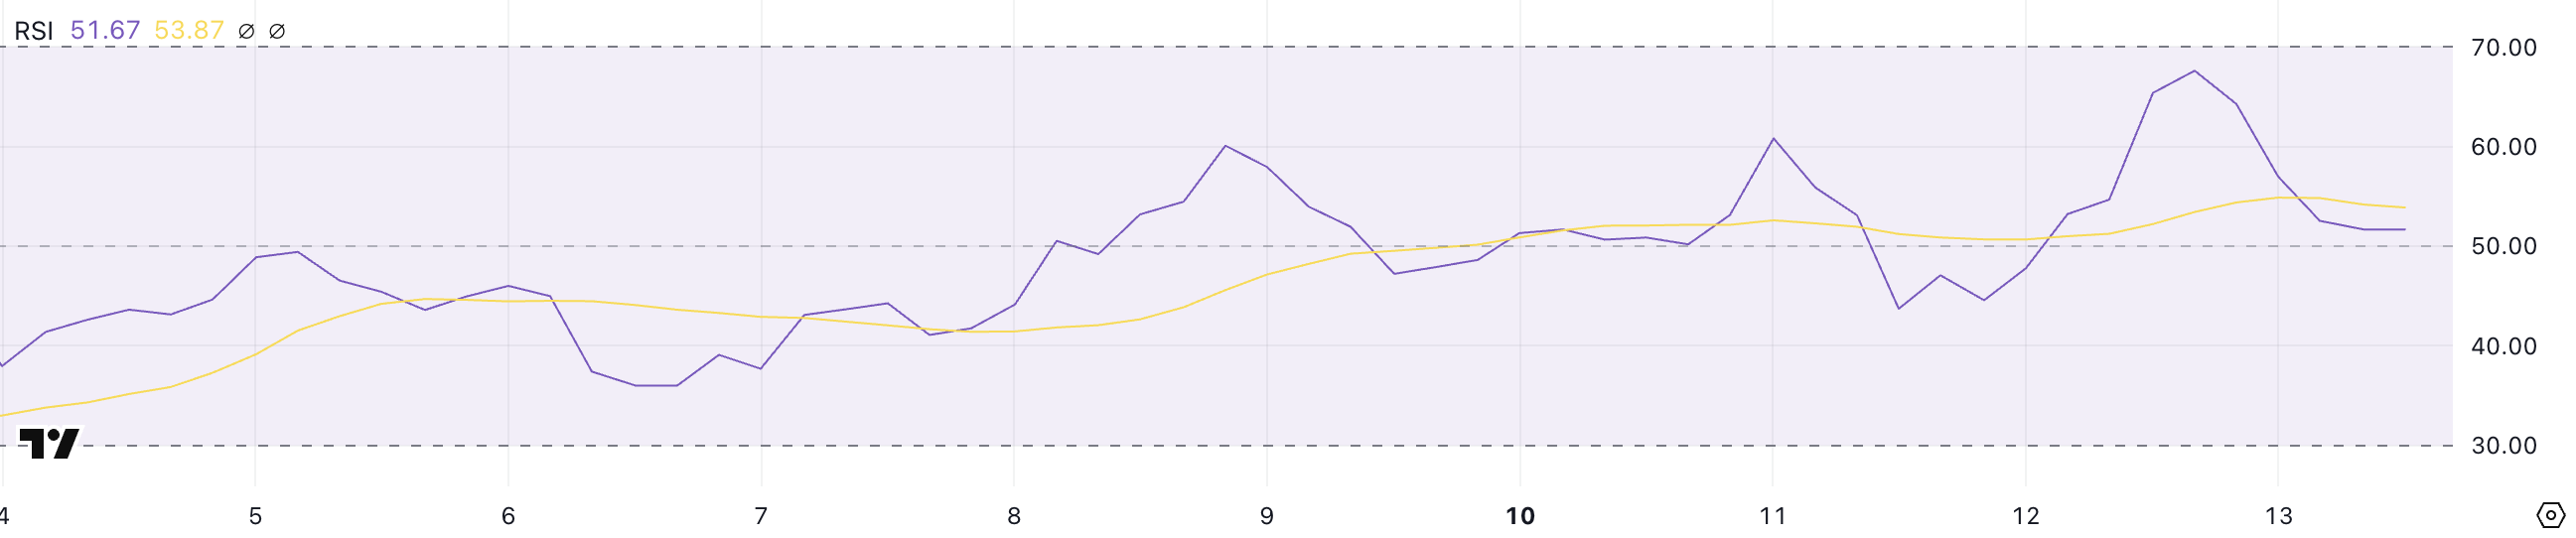
The RSI measures momentum on a scale where values above 70 indicate overbought conditions, and values below 30 suggest oversold levels. With SHIB RSI at 51.6, it is in a neutral zone, meaning there is no clear bullish or bearish dominance.
The failure to enter the overbought zone could mean that upside momentum is fading, which might lead to consolidation or a slight pullback. However, if buying pressure resumes and RSI climbs again, SHIB price could attempt another breakout.
Shiba Inu Whales Reached Its Lowest Level Since 2022
The number of SHIB whales – addresses holding at least 1,000,000,000 SHIB – has dropped to 10,546, the lowest level since July 2022. This decline indicates that large holders have been reducing their positions, which could signal weakening confidence among major investors.
Since whales often influence price action due to the size of their holdings, a sustained decrease in their numbers can indicate lower long-term accumulation and potential selling pressure.
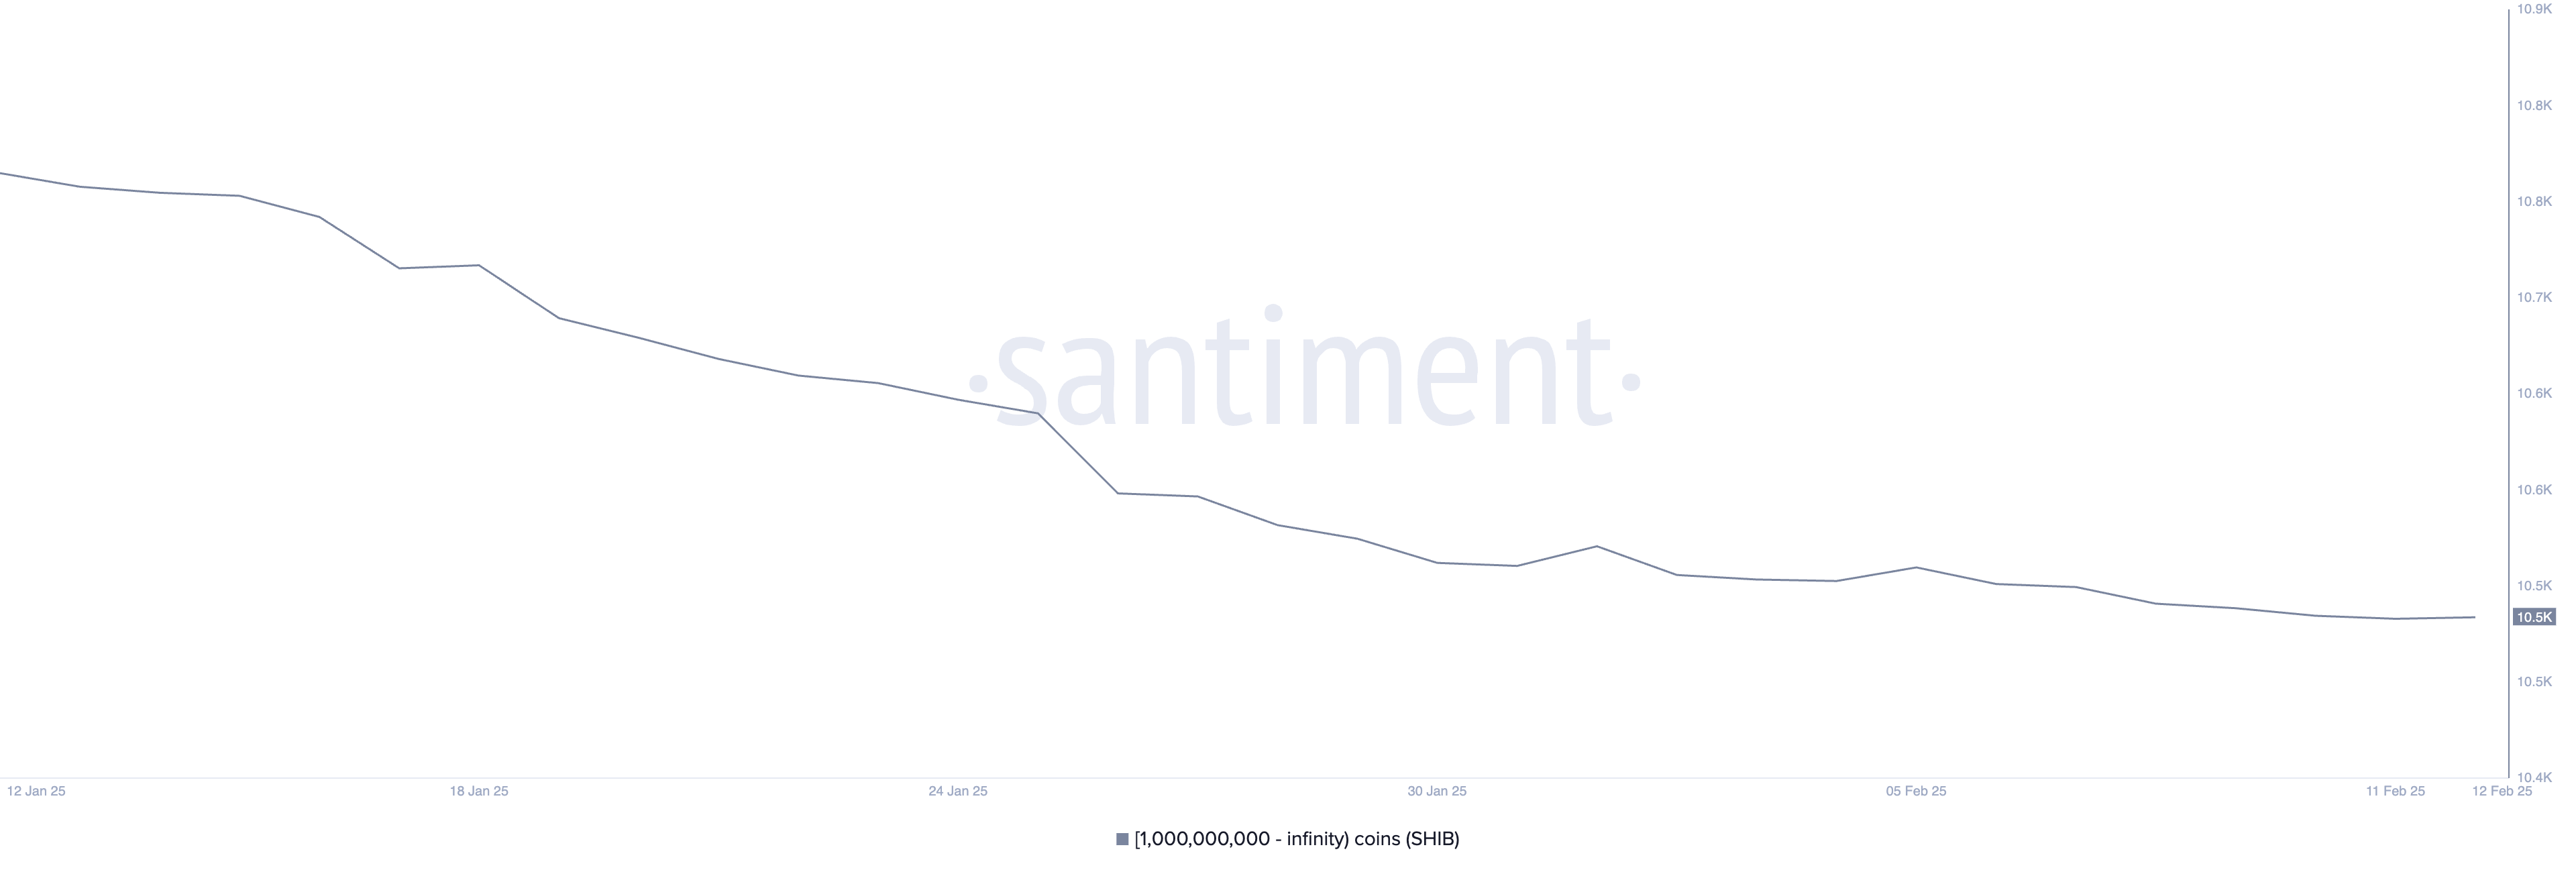
Tracking whale activity is crucial because these large holders can impact liquidity, volatility, and overall market sentiment. The number of Shiba Inu whales started declining heavily in mid-January, falling from 10,840 on January 12 to 10,628 by January 26.
While the pace of this decline has slowed in recent days, the trend is still downward. If this pattern continues, it could limit SHIB price ability to sustain strong rallies, as fewer large investors are accumulating, potentially leading to weaker price support.
SHIB Price Prediction: Will SHIB Continue to Drop?
SHIB EMA lines show that short-term trends remain below long-term ones, maintaining a bearish structure. However, the gap between them has started to narrow compared to previous weeks, which could signal a potential shift in momentum.
If this trend continues, it may indicate that selling pressure is weakening, opening the door for a possible recovery.
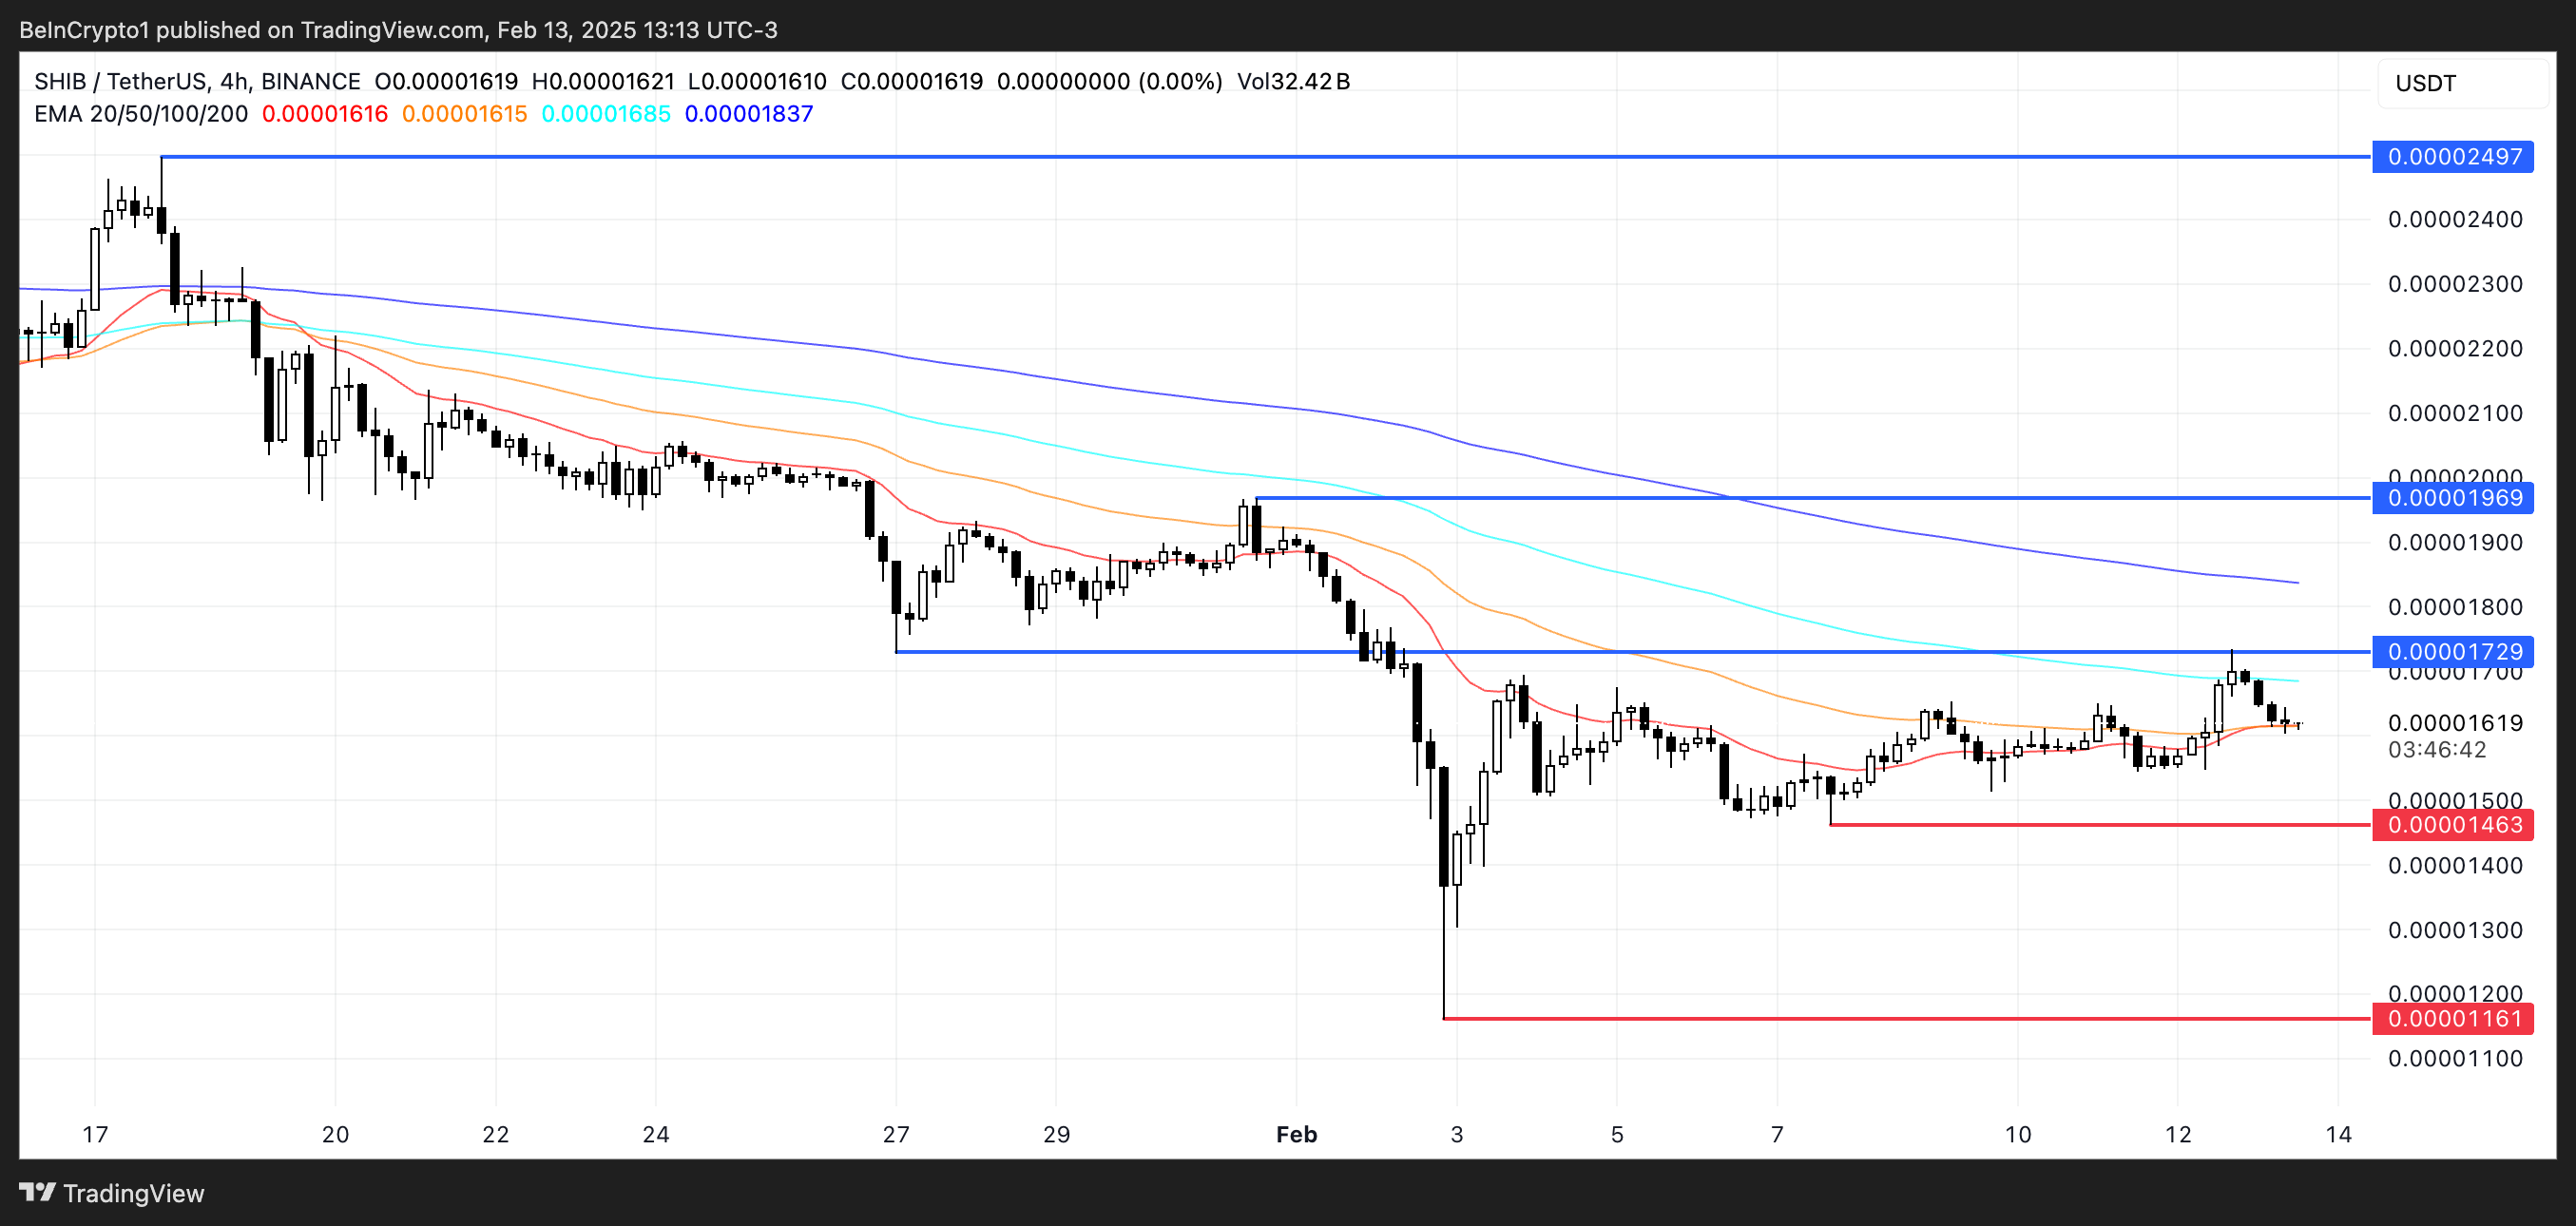
If SHIB price can establish an uptrend, it could test the resistance at $0.0000172, a level it recently failed to break. A successful breakout could lead to a push toward $0.0000196, with a strong uptrend potentially reclaiming $0.0000249, its highest price since mid-January.
On the other hand, if bearish momentum strengthens again, SHIB could fall toward the $0.0000146 support. Losing this level could accelerate the decline to $0.0000116, marking a possible 27.9% drop.
Disclaimer
In line with the Trust Project guidelines, this price analysis article is for informational purposes only and should not be considered financial or investment advice. BeInCrypto is committed to accurate, unbiased reporting, but market conditions are subject to change without notice. Always conduct your own research and consult with a professional before making any financial decisions. Please note that our Terms and Conditions, Privacy Policy, and Disclaimers have been updated.


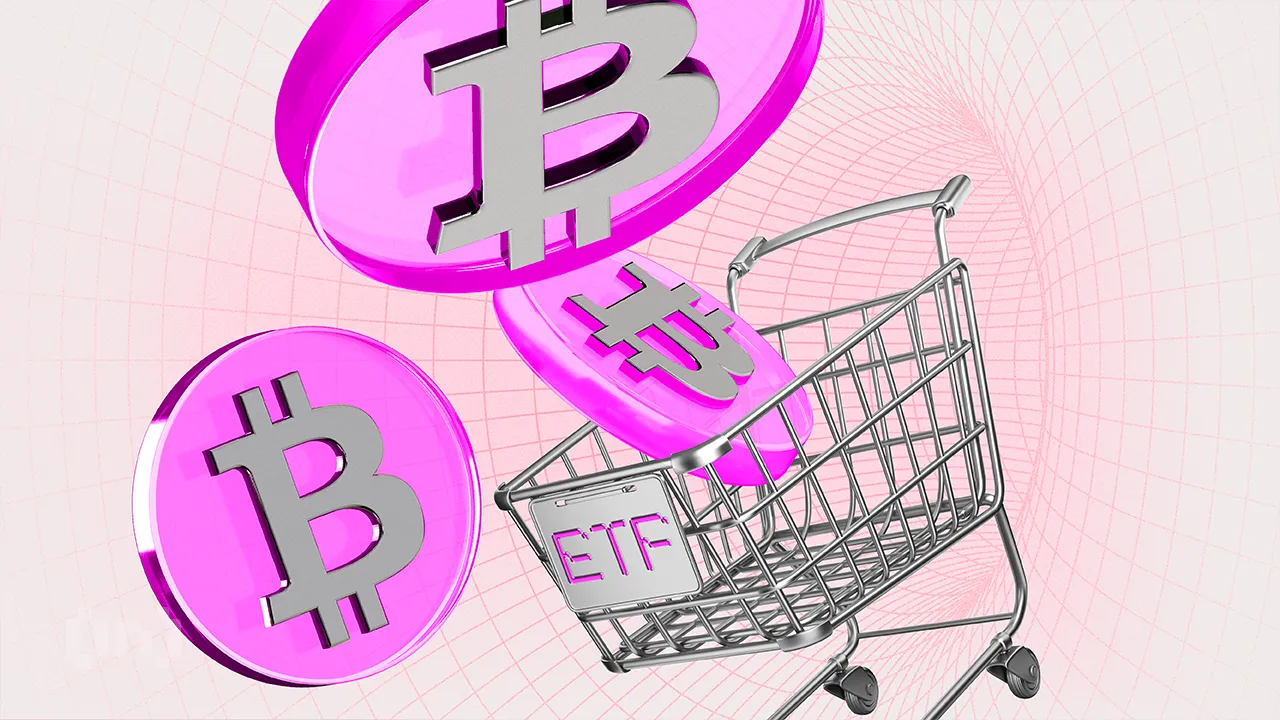
After seven straight days of outflows, institutional investors seem to have rekindled their love for Bitcoin ETFs. Since April 2, US-listed spot Bitcoin ETFs have posted net inflows for the first time, drawing $1.47 million in fresh capital on Monday.
While this figure is modest, it marks a notable shift in sentiment and the first sign of renewed institutional appetite for Bitcoin exposure through regulated funds.
Bitcoin ETFs End 7-Day Drought With Modest Inflows
Last week, Bitcoin investment funds recorded $713.30 million in net outflows as the broader cryptocurrency market struggled to stay afloat amid the growing impact of Donald Trump’s escalating trade war rhetoric.
But the tide may be starting to turn.
On Monday, U.S.-listed spot BTC ETFs recorded $1.47 million in net inflows, marking the first capital flow into these funds since April 2. While the amount is modest, it breaks a nearly two-week drought and could signal a gradual shift in institutional sentiment toward BTC.

The largest daily net inflow came from BlackRock’s IBIT, attracting $36.72 million. This brings its total cumulative net inflows to $39.60 billion.
On the other hand, Fidelity’s FBTC recorded the largest net outflow on Monday, shedding $35.25 million in a single day.
BTC Derivatives Market Heats Up Despite Cautious Options Flow
On the derivatives side, BTC’s futures open interest has edged higher over the past 24 hours, signaling increased derivatives activity.
At press time, this sits at $56 billion, rising by 2% in the past day. Notably, during the same period, BTC’s period has climbed by 1.22%.

BTC’s futures open interest refers to the total number of outstanding futures contracts that have yet to be settled. When it rises during a price uptick like this, it suggests that new money is entering the market to support the upward move, potentially reinforcing bullish momentum.
However, there’s a catch. While open interest in BTC futures has increased, the nature of these new positions appears to be bearish. This is evident in the coin’s funding rate, which has now flipped negative for the first time since April 2.
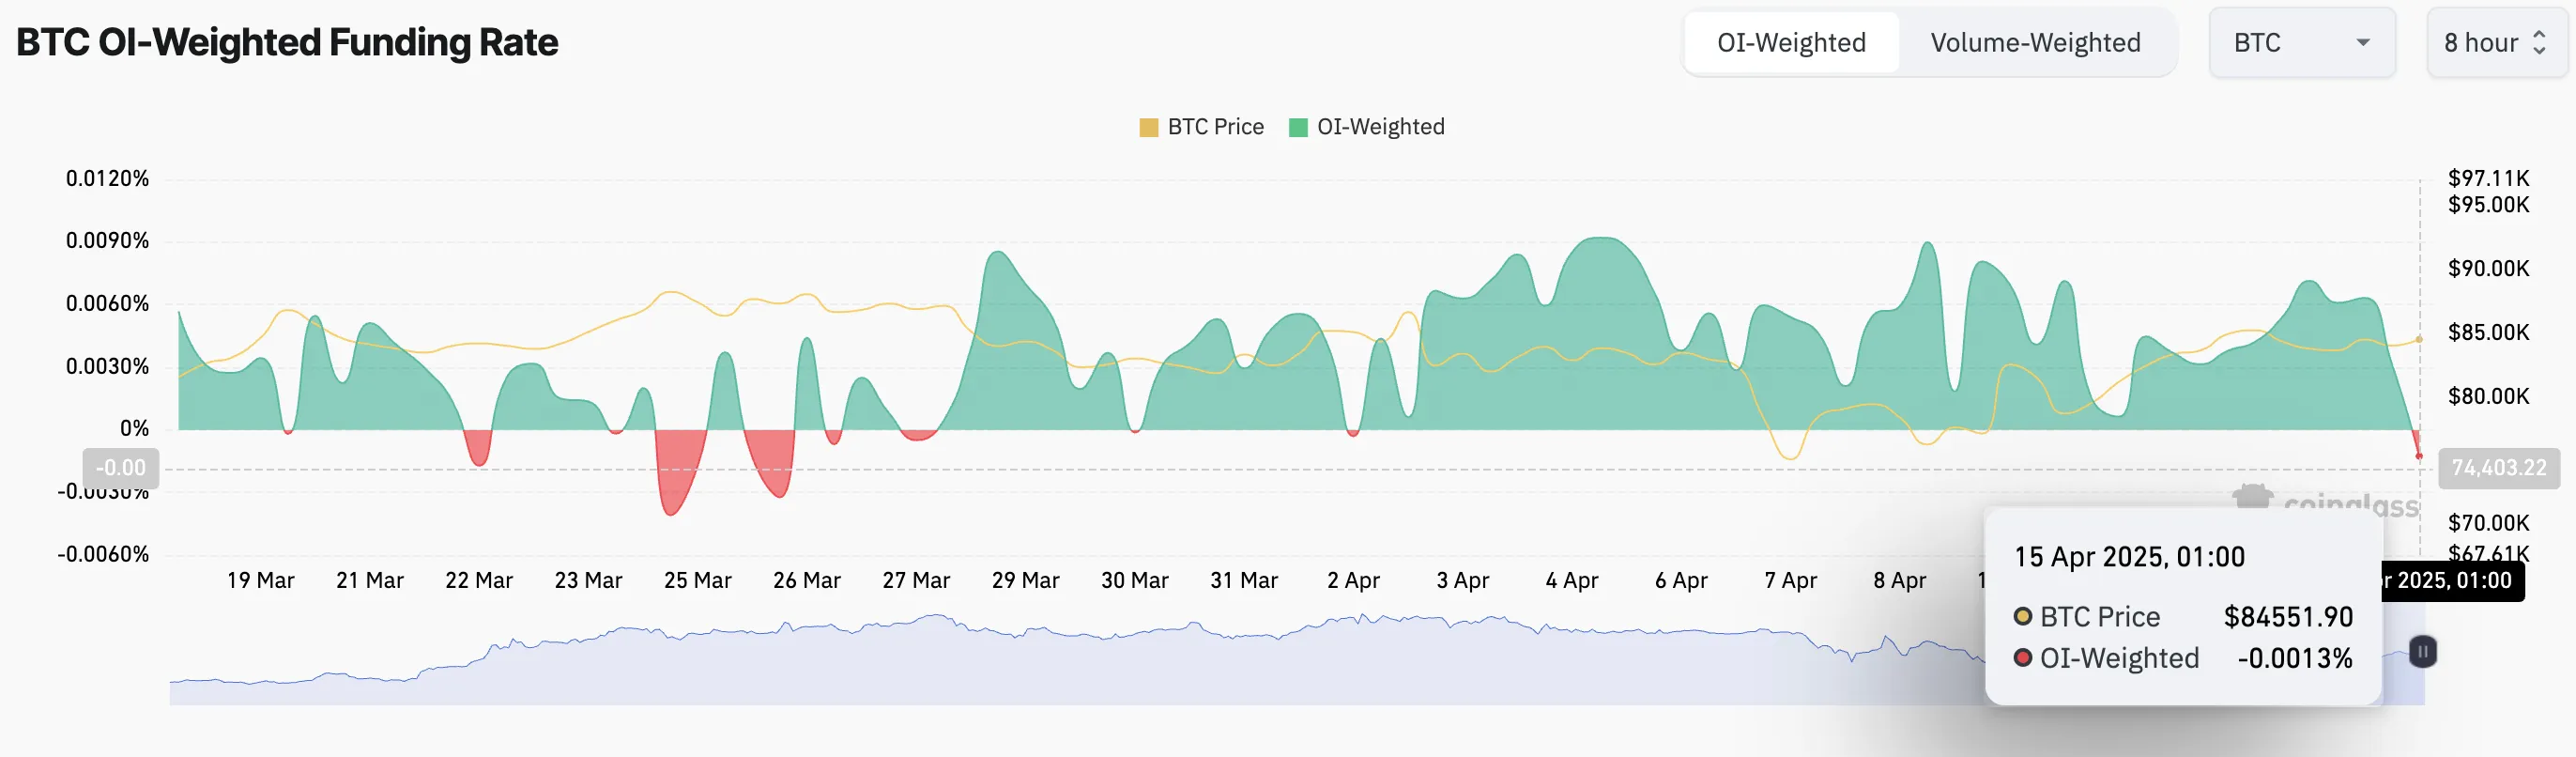
This means that more BTC traders are paying to hold short positions than longs, suggesting that a growing number of market participants are betting on a potential pullback despite the modest inflows into spot ETFs.
Moreover, the mood remains cautious on the options side. Today, there are more put contracts than calls, signaling that some traders may be hedging their bets or anticipating further downside, even as other indicators turn bullish.

Still, for BTC ETFs, any inflow after two weeks of silence feels like a win. With the broader market sentiment toward the coin turning increasingly bullish, it remains to be seen if this trend could persist for the remainder of the week.
Disclaimer
In line with the Trust Project guidelines, this price analysis article is for informational purposes only and should not be considered financial or investment advice. BeInCrypto is committed to accurate, unbiased reporting, but market conditions are subject to change without notice. Always conduct your own research and consult with a professional before making any financial decisions. Please note that our Terms and Conditions, Privacy Policy, and Disclaimers have been updated.


The Trump administration is gearing up for significant economic shifts, with its proposed tariffs said to be setting the stage for a potential overhaul of the Federal Reserve’s (Fed) leadership.
Like Gary Gensler’s ouster at the SEC (Securities and Exchange Commission), reports indicate that Fed chair Jerome Powell may face a similar fate with discussions starting long before his term ends.
Jerome Powell’s Exit Planned As Trump Tariffs Spell Economic Hardship
Treasury Secretary Scott Bessent announced the Trump administration’s plans to interview candidates to replace Fed Chair Jerome Powell.
Notably, Powell’s term as Fed chair ends in May 2026, over a year out. With almost 13 months left, experts suggest the administration’s move may be a strategic response to the economic turbulence expected from Trump’s aggressive tariff policies in 2025.
The sentiment is that the Trump administration may pave the way for a new Fed Chair to steer the economy through 2026 with interest rate cuts and stimulus measures.
“The interest rates affect credit cards, they’ll affect auto loans, the bottom 50% of Americans over the past two years have gotten crushed by these high interest rates. We’re set on bringing interest rates down,” Bessent claimed in a televised interview.
Trump’s tariff proposals, including a 125% tax on Chinese imports, are projected to impact the US economy substantially. According to a Tax Foundation study published on April 11, 2025, these tariffs could reduce US GDP by 1.3% in the long run.
The study also estimates tariffs will amount to an average tax increase of $1,300 per US household in 2025. This adds pressure on consumers already grappling with inflationary concerns.
Combined with foreign retaliation affecting $330 billion of US exports, the overall GDP reduction could reach 1.0%. This highlights the economic challenges the administration anticipates in the coming year.
Trump Administration Prepares For 2026 Economic Recovery
This report comes a month after Bessent presented Fed Chair Jerome Powell as a significant obstacle. He alluded that Powell impeded the Trump administration’s determination to lower interest rates.
Indeed, the Federal Open Market Committee (FOMC), led by Powell, has rejected interest rate cuts. They maintain this stance until they are comfortable with inflation cooling.
The Fed also made significant downward revisions to its 2025 economic projections. They painted a picture of weaker growth and persistent inflation.
According to economists, the Trump Administration is bracing for “economic weakness” in 2025 due to the tariffs. However, it sees 2026 as a year of recovery through monetary policy adjustments.
“This sets up perfectly for 2026 to be the year of interest rate cuts and economic stimulus, with the newly appointed Fed Chair,” The Kobeissi Letter said.
Therefore, the timing of Powell’s replacement aligns with these economic projections. A new Fed Chair, potentially more aligned with Trump’s economic agenda, could facilitate interest rate cuts and stimulus to counteract the tariff-induced slowdown.
Jerome Powell has served as Fed Chair since 2018. He has maneuvered a complex economic environment, which included high inflation and the post-pandemic recovery.
His second term, confirmed in May 2022, has been characterized by efforts to balance the Fed’s dual mandate of stable prices and full employment. However, this has been met with criticism, including from President Trump, for not being accommodative enough.
“The Fed would be much better off cutting rates as US tariffs start to transition (ease) their way into the economy. Do the right thing,” Trump shared on Truth Social.
The early search for his successor indicates the administration’s desire for a Fed Chair who might be more amenable to its policy goals.
Disclaimer
In adherence to the Trust Project guidelines, BeInCrypto is committed to unbiased, transparent reporting. This news article aims to provide accurate, timely information. However, readers are advised to verify facts independently and consult with a professional before making any decisions based on this content. Please note that our Terms and Conditions, Privacy Policy, and Disclaimers have been updated.

CoinGecko conducted a recent survey on AI user opinions, particularly centered around Proof of Personhood (PoP). The overwhelming majority of users want to distinguish humans from AI and are open to adopting PoP.
Proof of Personhood (PoP) is a mechanism designed to verify that a user is a unique human being—not a bot, not an AI, and not a duplicate identity. Many users feel it’s increasingly critical as generative AI and autonomous agents proliferate across digital platforms.
Is Personhood the Next Big Trend in AI?
AI projects have seen declining popularity over the past months, largely due to macroeconomic factors and other narratives dominating the Web3 space. Yet, AI agent development remains strong.
AI agents are now highly integrated into crypto Twitter and social media. They are driving conversations, changing narratives, and even creating dialog. So, the concept of personhood has become a critical discussion among the crypto community.
Most recently, CoinGecko conducted a survey on AI-related opinions and identifying personhood.
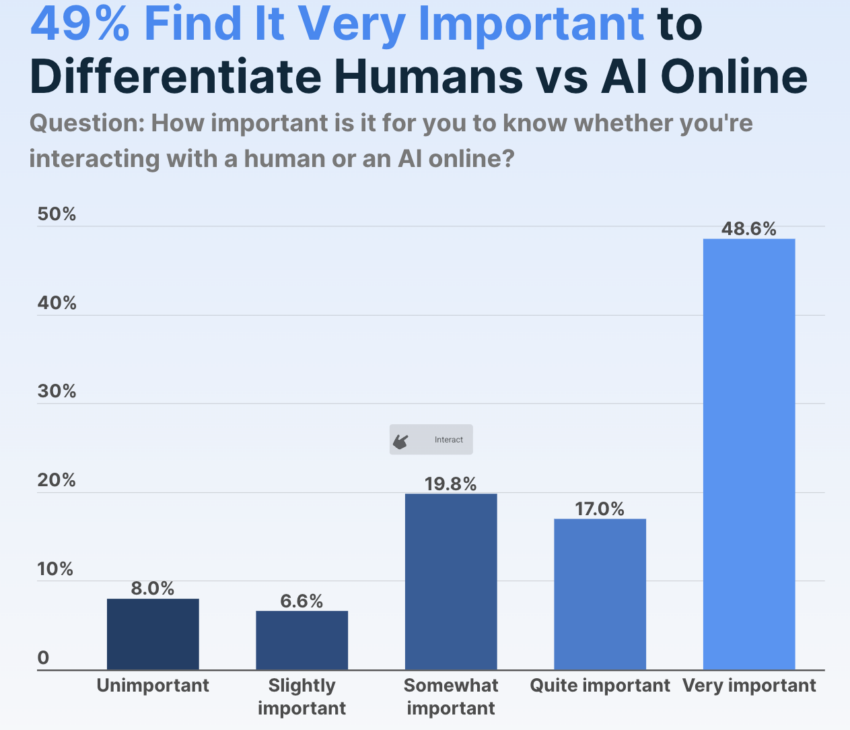
CoinGecko’s data shows that most AI users firmly believe that it’s important to know if they’re interacting with a human. Nearly half of respondents think this task is “very important,” and 92% think it’s at least somewhat important.
This can help explain why Proof of Personhood (PoP), a concept pioneered by Sam Altman’s Worldcoin, has remained an enduring idea in the AI space.
What’s the problem, then? Although this survey shows that AI users want to identify personhood, that doesn’t mean that everyone is willing to adopt PoP methods as currently devised or understood.
Nearly half of users were willing or somewhat willing to try them, but it was a far smaller margin than the other question.
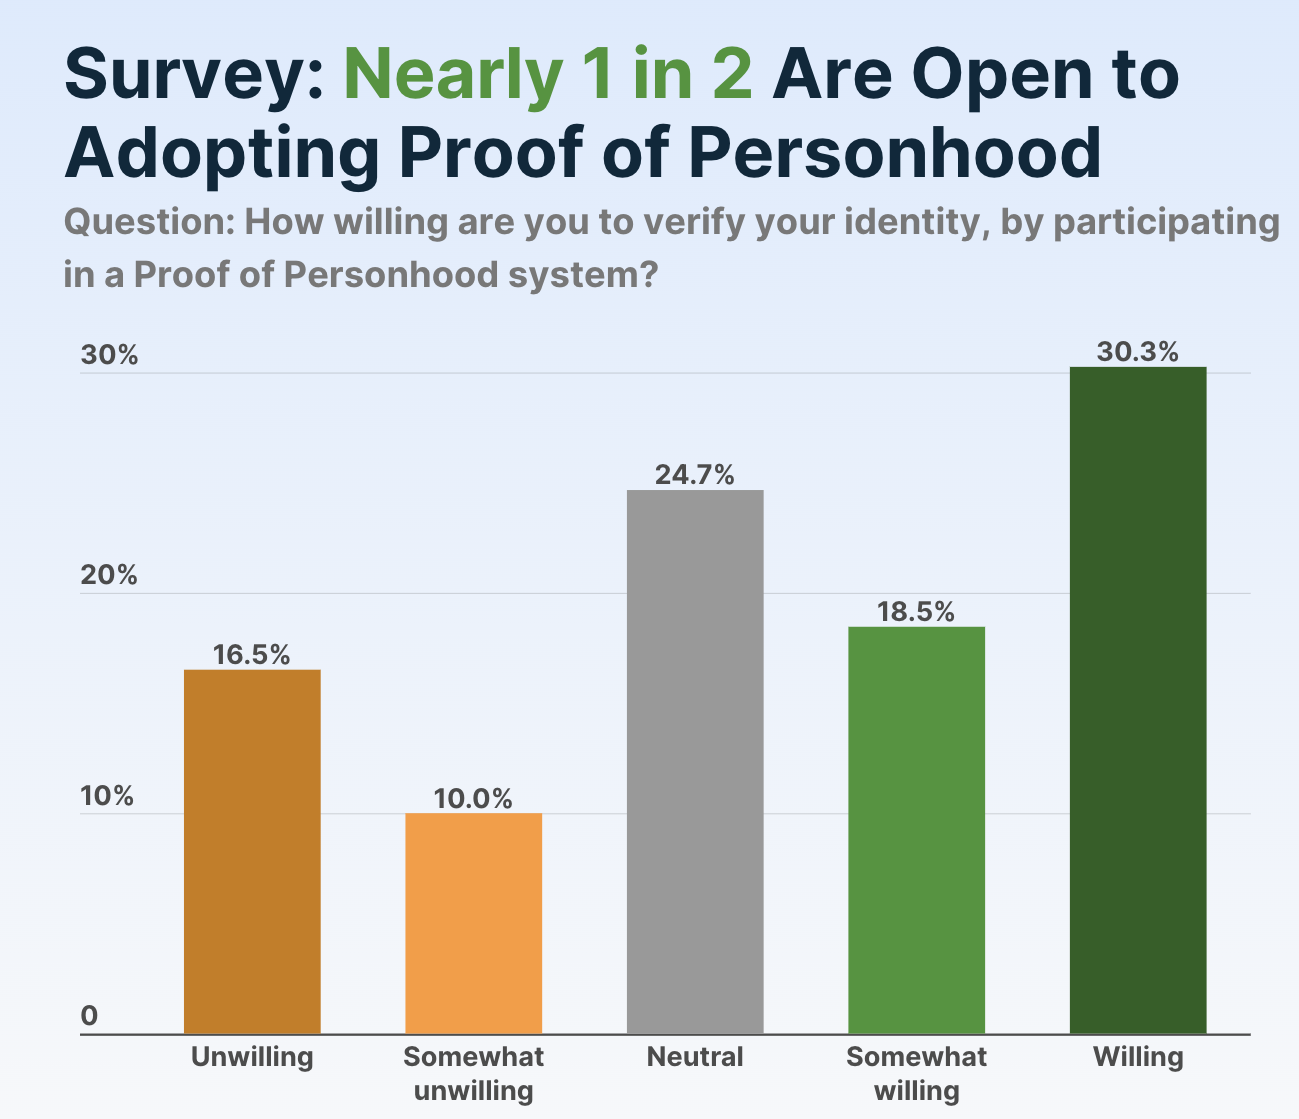
Furthermore, the survey determined that only 30.3% of respondents believe that it’s very important to distinguish humans from AI and are also willing to adopt Proof of Personhood methods.
On the other hand, 18.3% thought identifying humans was important but were neutral or actively opposed to PoP.
The survey did not apparently describe specific PoP protocols from any one project. PoP generally involves using non-traditional forms of verification, such as biometric data, social media profiles, or other methods that are difficult to fake or replicate, but there isn’t a single industry standard yet.
Considering that another CoinGecko survey identified declining interest in AI investment, this polling discrepancy could present a problem. AI users are mostly unified as to what the issue is, but the proposed solutions are much more controversial.
A heavy-handed approach to the personhood question could turn users away from AI. This is far from ideal in the current market.
Still, it’s important not to overstate the level of controversy. Although less than half of AI users want to adopt Proof of Personhood, the pool of hostile respondents was comparatively small.
There’s a substantial number of ambivalent people, and they may respond well to new protocols, marketing campaigns, or other incentives.
Overall, it’s evident that PoP is becoming a key discussion point in the Web3 community. As autonomous agents gain influence, PoP might serve as a firewall between digital manipulation and genuine participation.
Disclaimer
In adherence to the Trust Project guidelines, BeInCrypto is committed to unbiased, transparent reporting. This news article aims to provide accurate, timely information. However, readers are advised to verify facts independently and consult with a professional before making any decisions based on this content. Please note that our Terms and Conditions, Privacy Policy, and Disclaimers have been updated.

SEC Delays Decision On Staking For Grayscale’s Ethereum ETFs
Bitcoin ETFs End Dry Spell with Fresh Capital
Shiba Inu Burn Rate Blows Up 2000%; Is SHIB Price Gearing Up For A Pump?

Trump’s Tariffs Spark Search for Jerome Powell’s Successor

CoinGecko Conduct Survey on AI and Proof of Personhood

Expert Urges Pi Network To Learn From The OM Crash Ahead Of Open Mainnet Transition

2.52 Million Altcoins Are Ruining Crypto’s Future

Animoca Brands Valuation Tanks 75% In Two Years, Here’s Why

Crypto exchange BingX hacked for $43 million

Are The Big Players Losing Interest?

Hong Kong’s Securities Association Tips Authorities On Crypto Self-Regulation

Coinbase cbBTC Set to go Live on Solana
2.52 Million Altcoins Are Ruining Crypto’s Future
Animoca Brands Valuation Tanks 75% In Two Years, Here’s Why
Crypto exchange BingX hacked for $43 million
Are The Big Players Losing Interest?
Hong Kong’s Securities Association Tips Authorities On Crypto Self-Regulation
Coinbase cbBTC Set to go Live on Solana
-

 Market21 hours ago
XRP Outflows Cross $300 Million In April, Why The Price Could Crash Further
-
 Altcoin19 hours ago
XRP Price Climbs Again, Will XRP Still Face a Death Cross?
-

 Altcoin22 hours ago
Binance Breaks Silence Amid Mantra (OM) 90% Price Crash
-

 Market20 hours ago
FLR Token Hits Weekly High, Outperforms Major Coins
-

 Bitcoin19 hours ago
Crypto Outflows Hit $795 Million On Trump’s Tariffs & Market Fear
-

 Market19 hours ago
Auto.fun Launchpad Set to Debut Amid Fierce Market Rivalry
-
 Altcoin18 hours ago
Analyst Predicts Dogecoin Price Rally To $0.29 If This Level Holds
-

 Market23 hours ago
Bitcoin Price Rises Steadily—But Can the Rally Hold This Time??