
Market
Bitcoin Pepe, BTC, and Solana

Crypto majors including Bitcoin remain under pressure amid a neutral market sentiment. However, revolutionary projects within the sector are thriving as savvy investors look for cheaper alternatives with great growth potential.
Bitcoin Pepe, the first meme ICO on the Bitcoin network has captured the attention of crypto enthusiasts, surpassing $1 million within the first 6 hours of its presale. Its early adopters acknowledge that its unique approach of merging the meme culture with Solana’s speed and Bitcoin’s security will yield hefty returns ahead of its launch in Q2’25.
Bitcoin price to remain range-bound amid a neutral market sentiment
Bitcoin price has remained in consolidation; trading in the red for the third consecutive week. At a fear & greed index of 47, which points to a neutral market sentiment, the crypto major may remain range-bound in the absence of a key near-term catalyst.
In the short term, the range between the support level of $93,500 and the resistance zone of $100,898.95 remains worth watching. Indeed, below this range, this thesis will be invalid. If successful at breaking the current resistance, bitcoin bulls will have their eyes on the next target at $102,954.12.
Bitcoin Pepe’s unique trifactor positions it for fastest-growing ICO of 2025
Bitcoin Pepe, the first meme ICO on the Bitcoin network, has already raised over $1.7 million within the first 48 hours of its presale. Indeed, this is the playing field that meme coin enthusiasts have hungered for.
On the one hand, Bitcoin is highly valued as the main alternative to fiat currency. Besides, it is considered as a safe haven and hedge against inflation.
While its Proof-of-Work (PoW) system assures Bitcoin’s unmatched security, it results in slower transaction speed of up to 60 minutes. In comparison, it takes about 0.5 seconds for a transaction to be completed on Solana with up to 65,000 transactions processed in a second.
Bitcoin Pepe has merged the two while propelling the meme culture; a trifactor that has captured the attention of crypto enthusiasts. The project leverages on Bitcoin’s security and Solana’s super speed while integrating the ultra-popular meme culture.
It is this ideal setup that has sparked immense interest among crypto enthusiasts. Amid the heightened FOMO, savvy investors understand that the current price of $0.0232 may be the lowest for the BPEP token moving forward.
It is currently at stage 3 of the total 30 stages on its 2025 roadmap, which also includes launching a decentralized exchange (DEX) and L2 Bridge. As it achieves these developments, its value is set to skyrocket. As such, this is the best opportunity for cryptocurrency enthusiasts to amass some BPEP tokens. Buy the Bitcoin Pepe here.
Solana price will need steady rebounding to ratify trend reversal
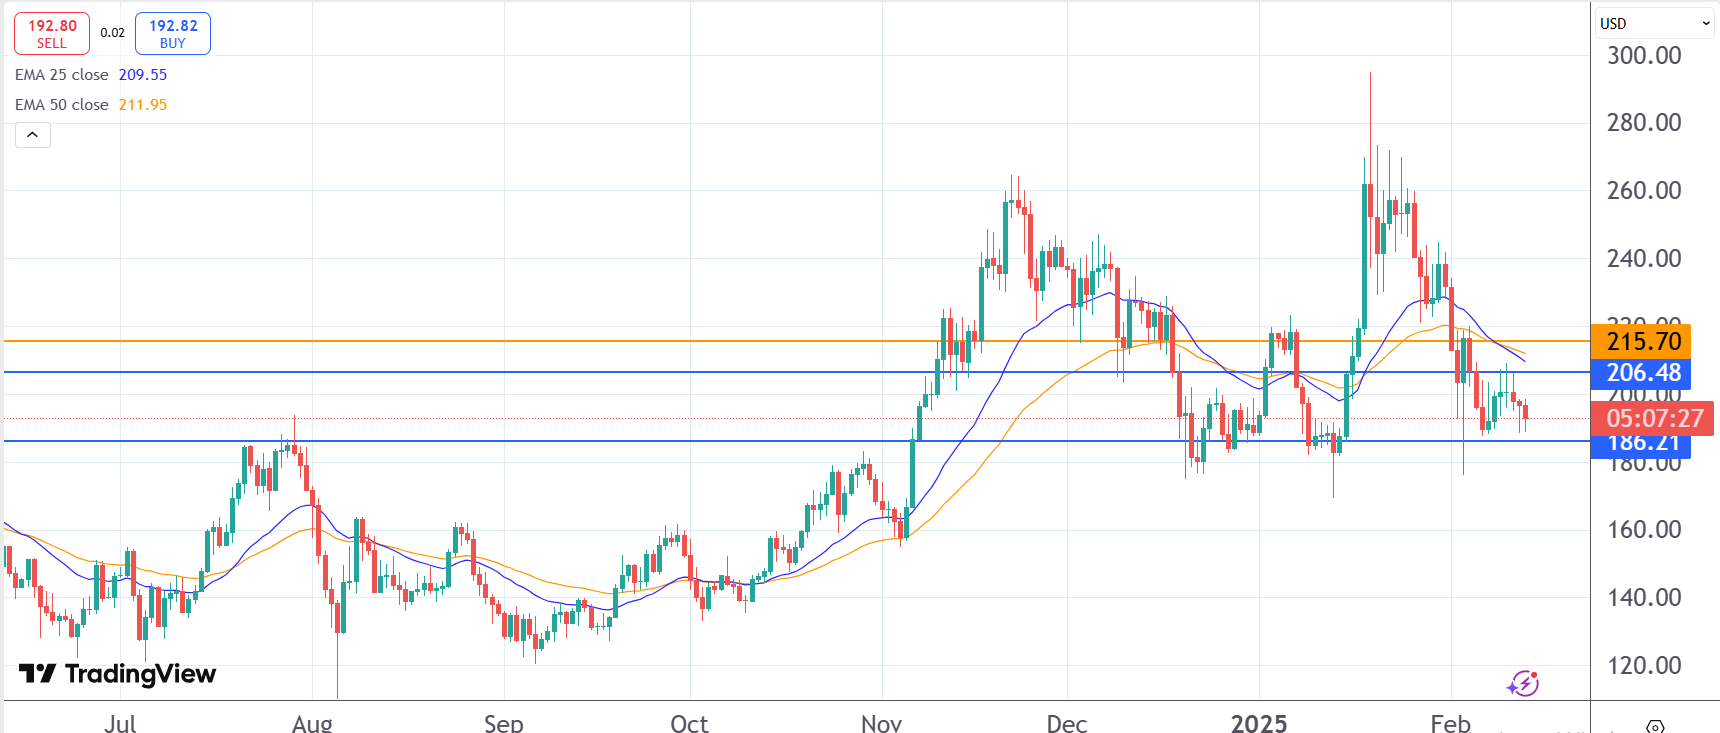
Solana price is set for its fourth week of losses despite the recent rebounding that cut across crypto majors. While the selling pressure may remain a headwind in the near term, improvement of the market sentiment may flip its plight as it leverages on its super speed and low transaction fees.
In the meantime, the bulls are keen on defending the support at $186.21. On the upside, additional momentum may have it break the resistance at $206.48. However, a rebound past $215.70 to rubberstamp a trend reversal.


Hyperliquid (HYPE) price has dropped more than 6% in the last 24 hours, despite the launch of HyperEVM, which aims to expand the platform’s DeFi capabilities. The integration of Ethereum Virtual Machine (EVM) functionality is expected to bring programmability to Hyperliquid’s trading ecosystem.
However, technical indicators show signs of weakness, with momentum fading and bearish signals emerging. Whether HyperEVM can drive renewed buying pressure or if the ongoing downtrend continues will be critical in determining HYPE price next major move.
Hyperliquid Rolls Out HyperEVM, as It Continues To Make Millions of Dollars Per Day
Hyperliquid has launched HyperEVM, marking a major step toward integrating smart contract functionality into its high-speed financial system. The upgrade brings Ethereum Virtual Machine (EVM) compatibility, allowing for decentralized applications while maintaining the platform’s trading experience.
The initial mainnet release includes security backed by HyperBFT consensus, seamless transfers between native HYPE and HyperEVM HYPE, and a canonical WHYPE system contract to facilitate DeFi activity.
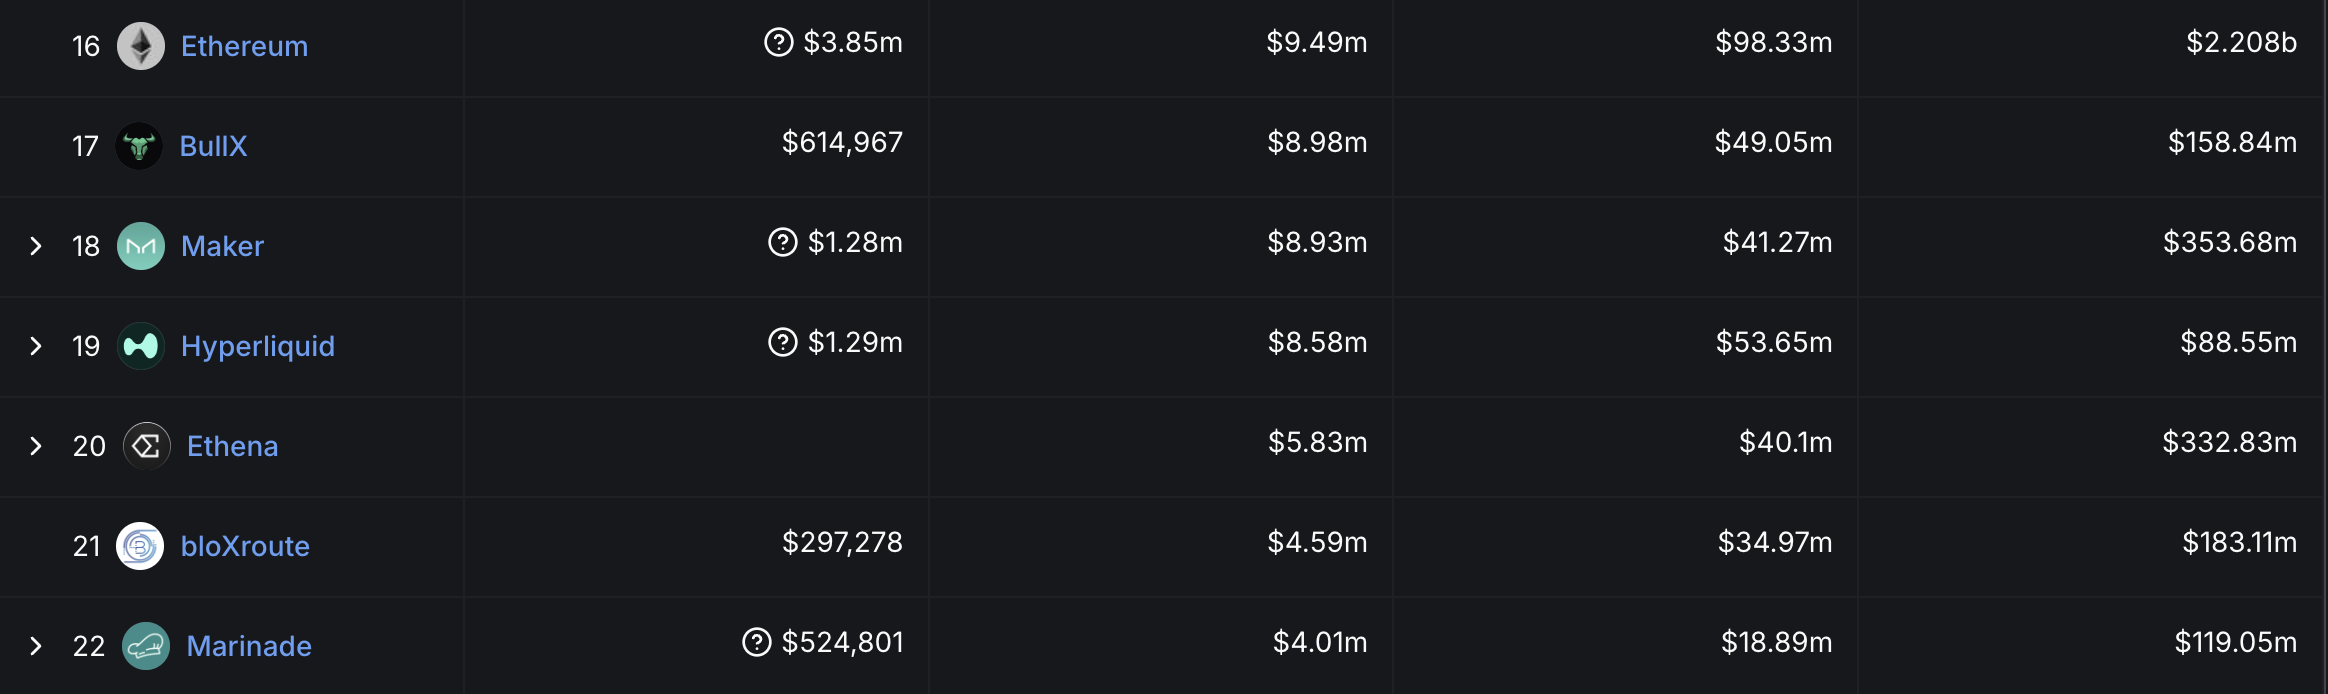
Hyperliquid continues to solidify its position as one of the most relevant players in crypto right now, ranking among the top 20 highest-earning applications in the past week.
The platform generated over $8.5 million in revenue in the last seven days, surpassing notable projects like Ethena and Marinade, while closing in on Maker, BullX, and Ethereum.
Hyperliquid Indicators Suggest Bullish Pressure Is Not Dominant
HYPE DMI shows that its ADX has dropped to 10.6, down from 18.9 four days ago, signaling a weakening trend. An ADX reading below 20 typically suggests a lack of strong directional momentum, meaning the current market movement lacks conviction.
Meanwhile, +DI (23.3) remains slightly above -DI (21.4), indicating that bullish pressure is still present but not dominant.
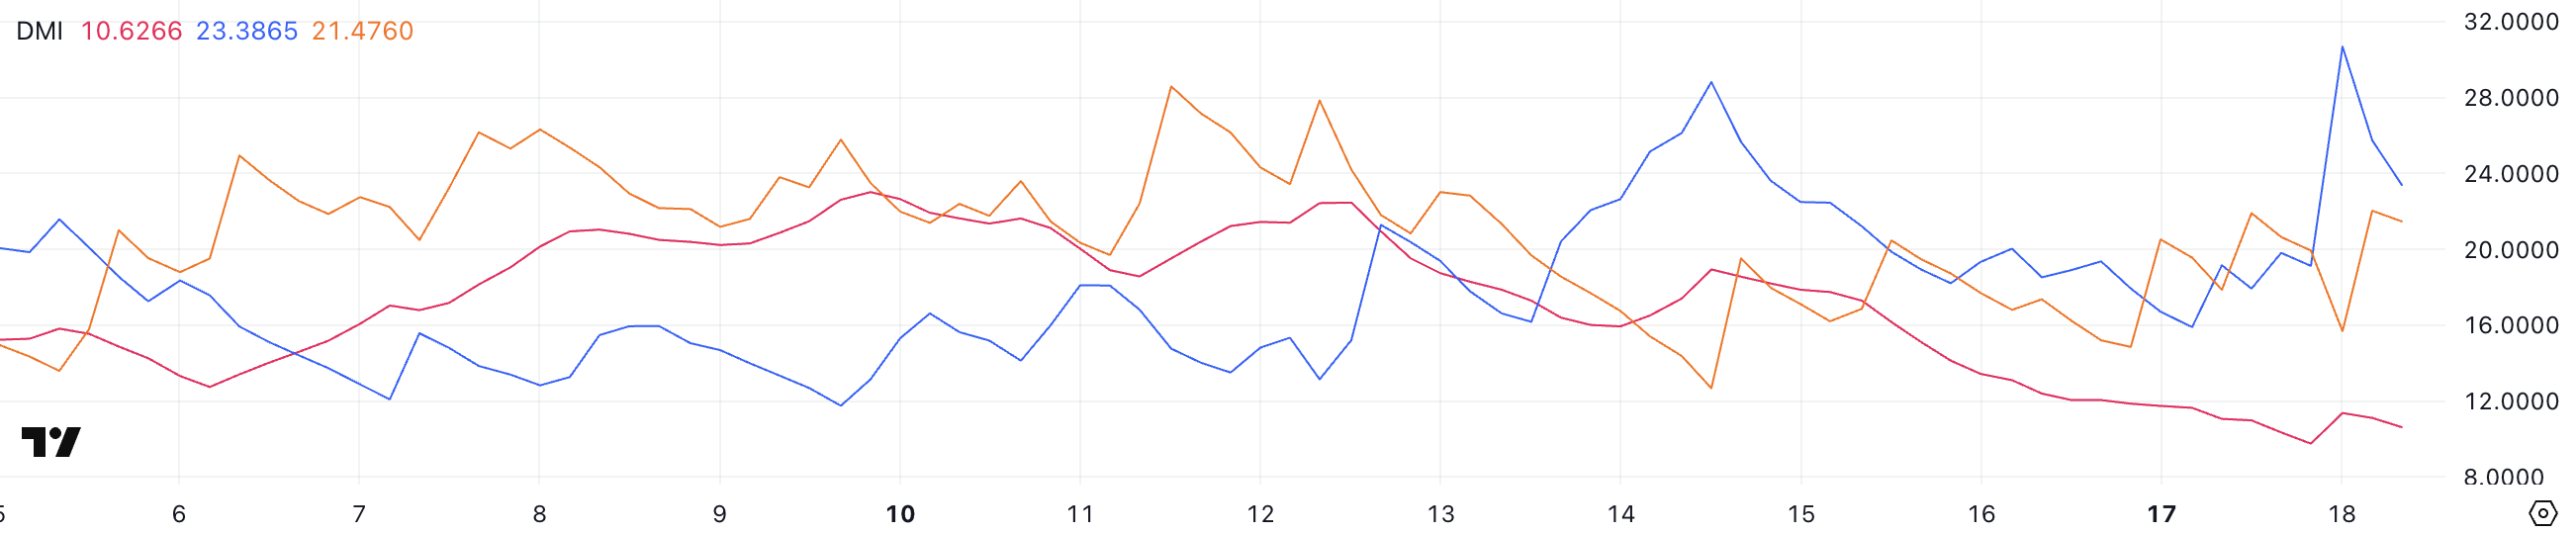
However, with short-term EMA lines trending downward despite being above long-term EMAs, the market could be at risk of further weakness. If the short-term EMAs continue declining, a bearish crossover could form, reinforcing downside pressure.
HYPE’s RSI has also dropped significantly, falling to 33.1 from 68 in just four days, reflecting a rapid loss of bullish momentum. While the current reading remains above the 30 threshold for oversold conditions, the sharp decline suggests that sellers have been in control.
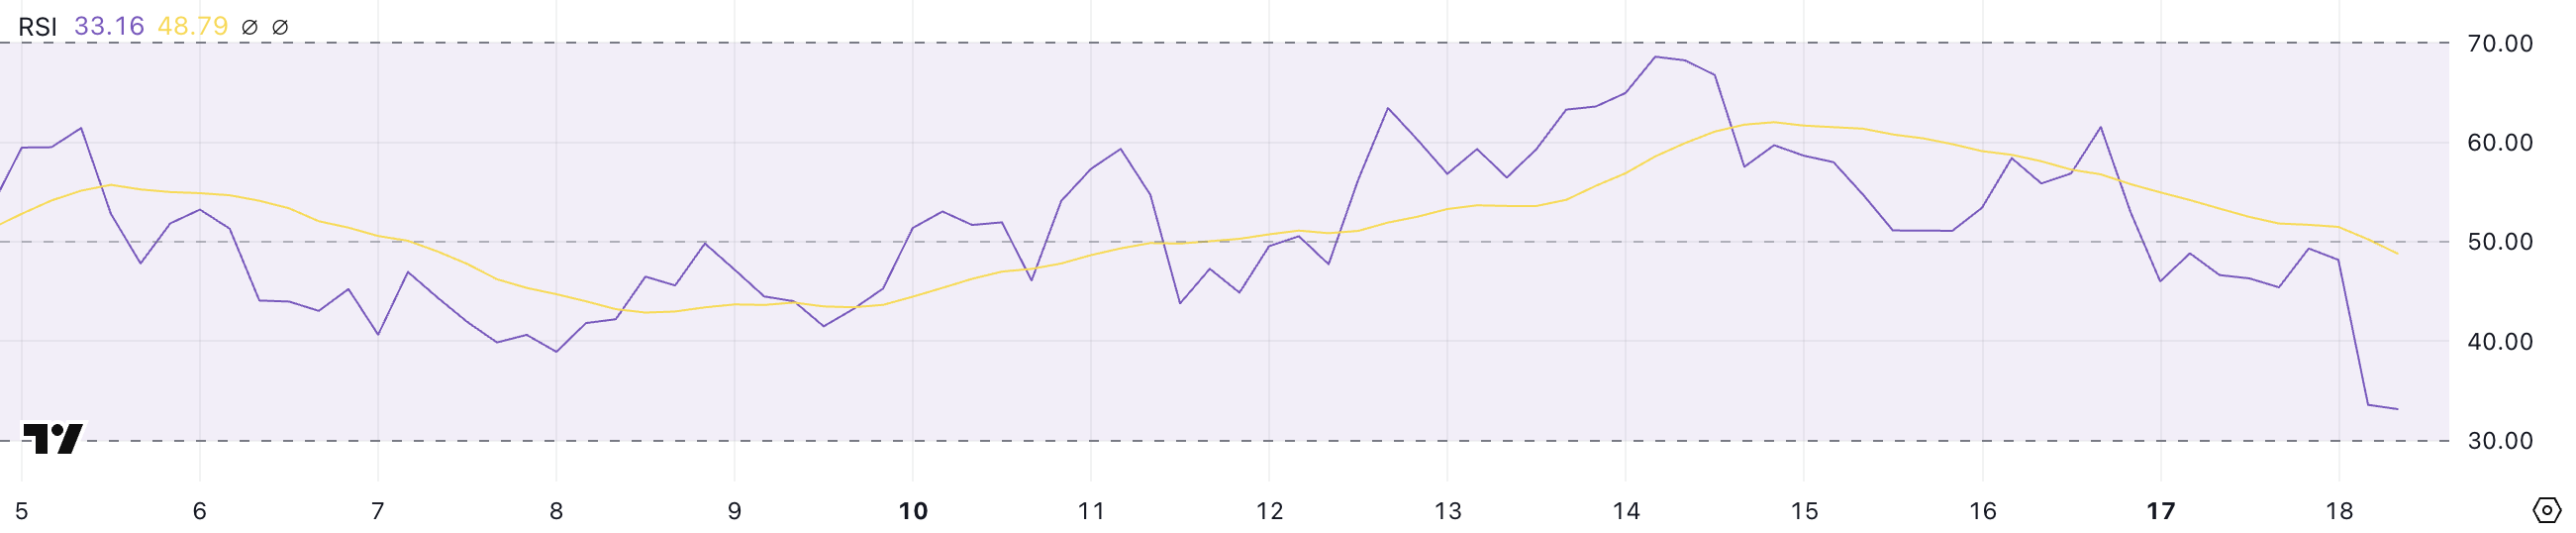
If RSI continues falling, HYPE price could enter oversold territory, potentially triggering a bounce if buyers step in. However, if bearish momentum persists, it may signal further downside before any meaningful recovery occurs.
The combination of weakening trend strength and falling RSI suggests that HYPE is in a fragile position, with traders watching closely for signs of stabilization or further decline.
HYPE Price Prediction: Will Hyperliquid Rise Above $30?
HYPE’s EMA lines indicate that a death cross could be forming soon, as short-term EMAs are trending downward and approaching a crossover below long-term EMAs.
This is typically a bearish signal that suggests weakening momentum and the potential for further downside. If the downtrend continues, HYPE price could test support at $22.5. If that level fails, the price may drop further to $20 or even $18.89, marking the first time it has fallen below $20 since late January.
A confirmed death cross would reinforce selling pressure, making a recovery more difficult in the short term.
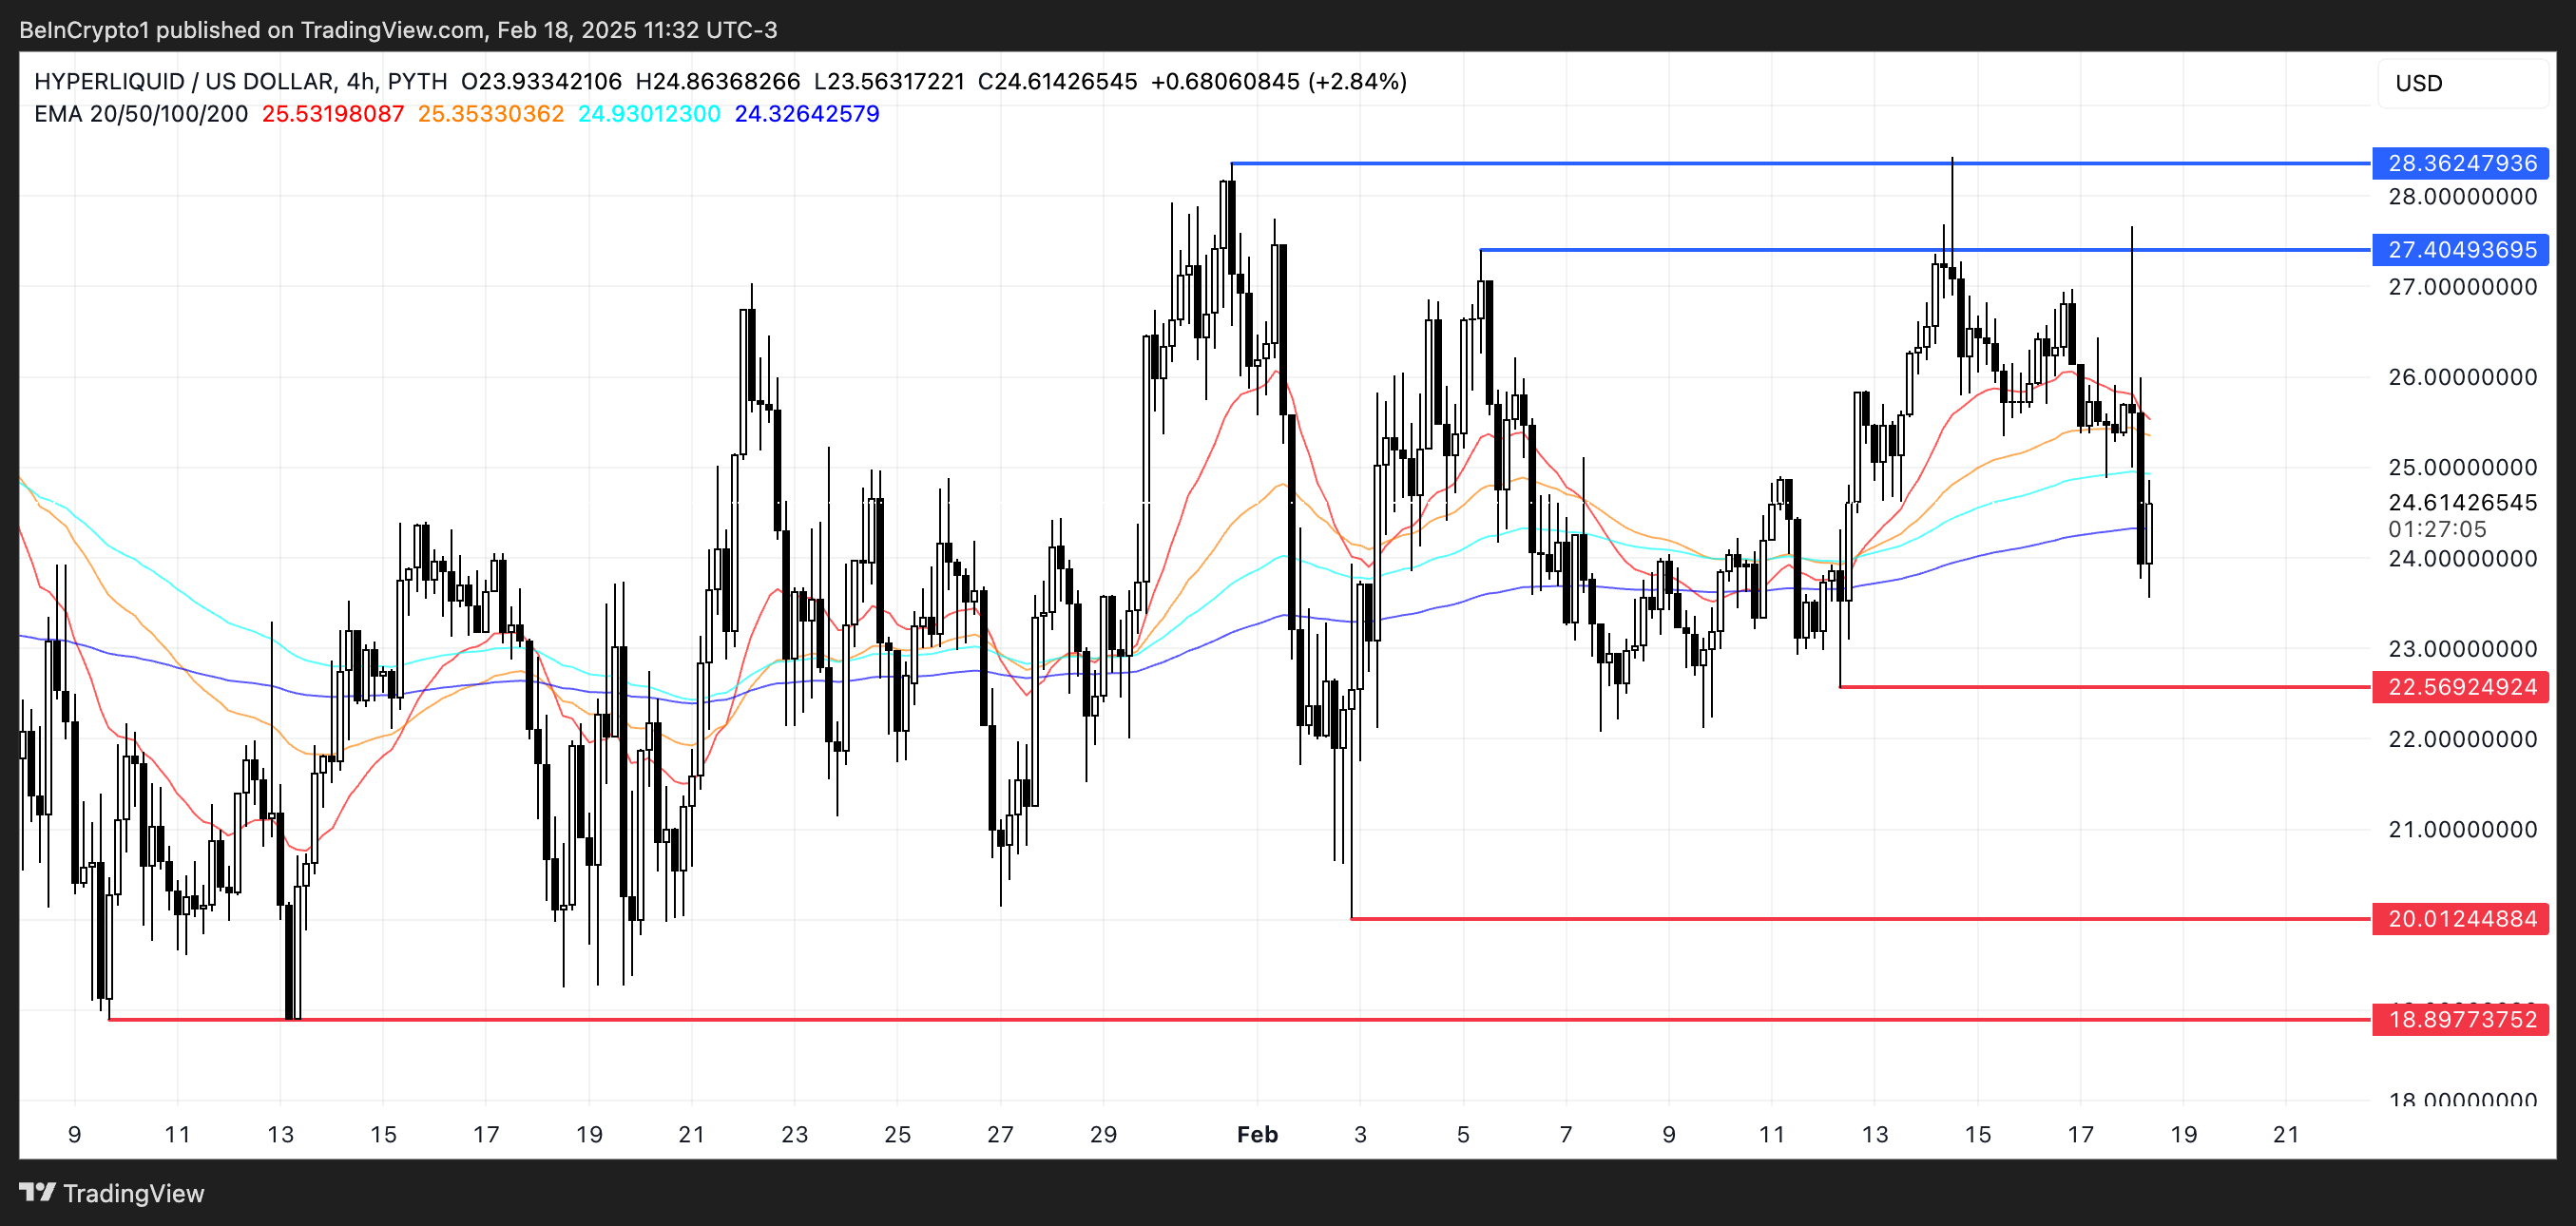
However, if the launch of HyperEVM sparks renewed buying interest, Hyperliquid could regain bullish momentum and push toward $27.4 as the first major resistance.
A breakout above that level could lead to a test of $28.3, and if sustained bullish momentum follows, HYPE price could rise past $30, a level not seen since December 2024.
The market’s reaction to HyperEVM’s launch will be key in determining whether HYPE breaks out of its current downtrend or continues facing pressure.
Disclaimer
In line with the Trust Project guidelines, this price analysis article is for informational purposes only and should not be considered financial or investment advice. BeInCrypto is committed to accurate, unbiased reporting, but market conditions are subject to change without notice. Always conduct your own research and consult with a professional before making any financial decisions. Please note that our Terms and Conditions, Privacy Policy, and Disclaimers have been updated.

XRP price has dropped nearly 4% in the last 24 hours and is down 21% over the past 30 days, bringing its market cap to $144 billion. The decline comes as key technical indicators flash warning signs, with the Chaikin Money Flow (CMF) hitting its lowest level since June 2022 and active addresses dropping by 53% in the past month.
Additionally, XRP’s EMA lines are forming a death cross, signaling the potential for further downside if the trend continues. With momentum weakening, XRP now faces a critical moment, as traders watch whether the price stabilizes or risks a deeper correction.
XRP CMF Is Breaking Negative Records
XRP Chaikin Money Flow (CMF) has dropped to -0.27, continuing a steady decline from 0.30 three days ago.
The CMF indicator measures buying and selling pressure by analyzing both price and volume. Values above zero indicate accumulation, and below zero signal distribution.
A sustained decline in CMF suggests that selling pressure is increasing, with more capital flowing out of XRP than into it. This downward trend reflects weakening bullish momentum and could indicate that investors are offloading their positions.
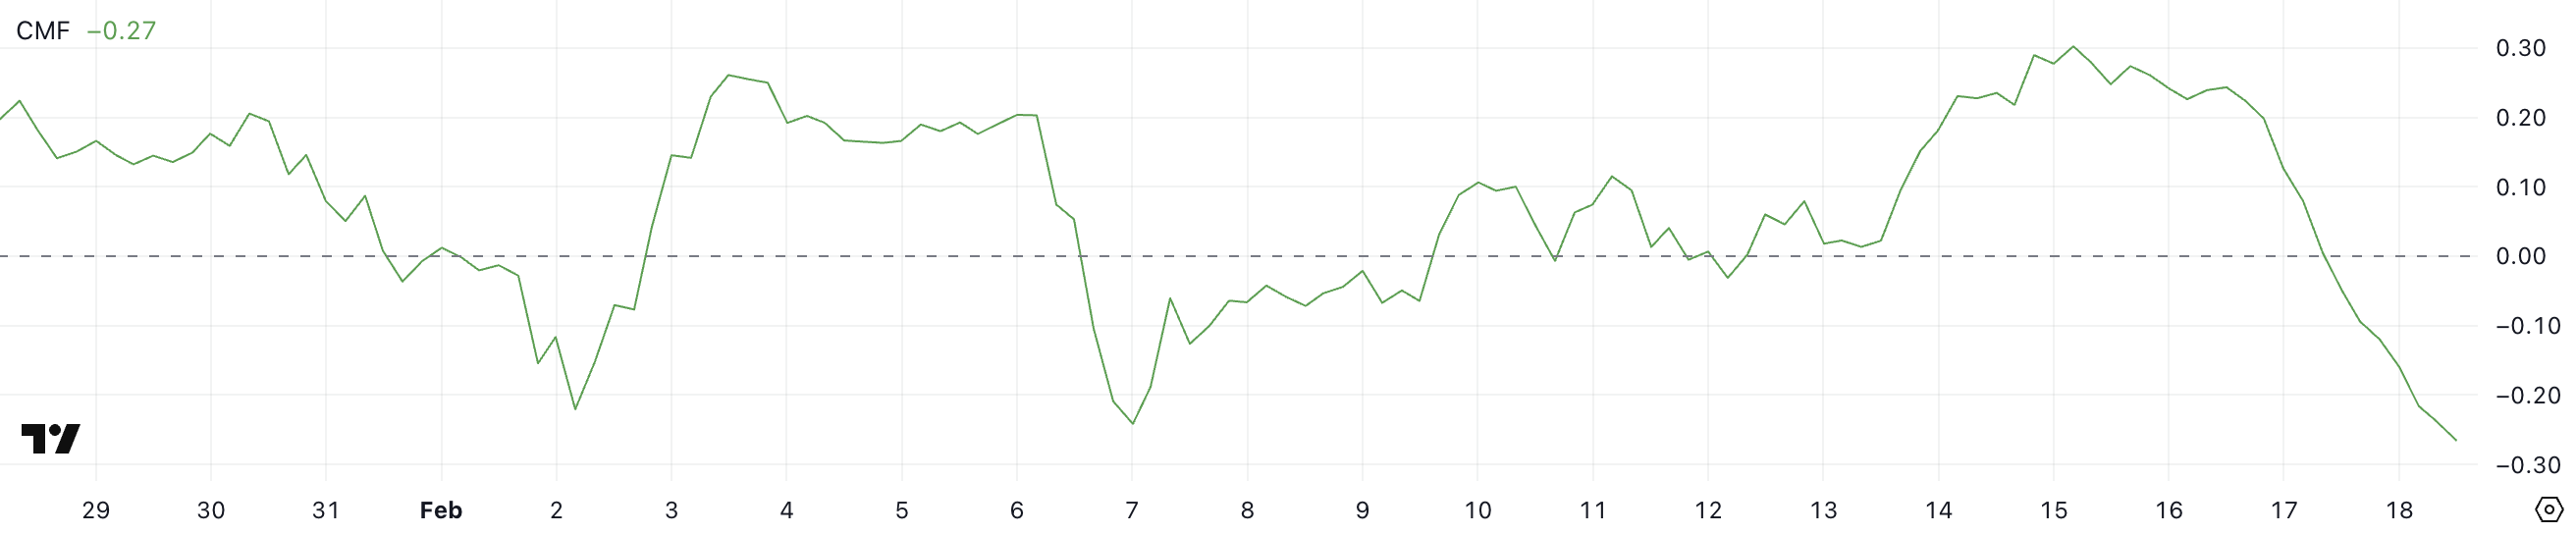
This is XRP lowest CMF reading since June 2022, a concerning signal for price action. Historically, prolonged negative CMF levels have preceded extended downtrends, as they indicate persistent capital outflows.
If the indicator remains in negative territory or continues to decline, XRP could face further selling pressure, increasing the risk of deeper price losses.
However, if CMF starts recovering and moves closer to zero, it could suggest stabilization, giving bulls a chance to regain control. For now, XRP remains in a vulnerable position, with traders closely watching whether selling pressure will intensify or ease in the coming days.
XRP Active Addresses Corrected By 53% In the Last Month
XRP 7-day active addresses have plummeted to 190,470, marking a sharp 53% decline from the 407,000 recorded on January 20. This metric tracks the number of unique addresses involved in transactions over a seven-day period, serving as a key indicator of network activity and overall user engagement.
A drop of this magnitude suggests reduced participation from traders and investors, potentially signaling waning interest or lower transaction demand.
Such a decline can often coincide with weaker price action, as fewer active addresses generally mean lower liquidity and less on-chain activity driving market movements.
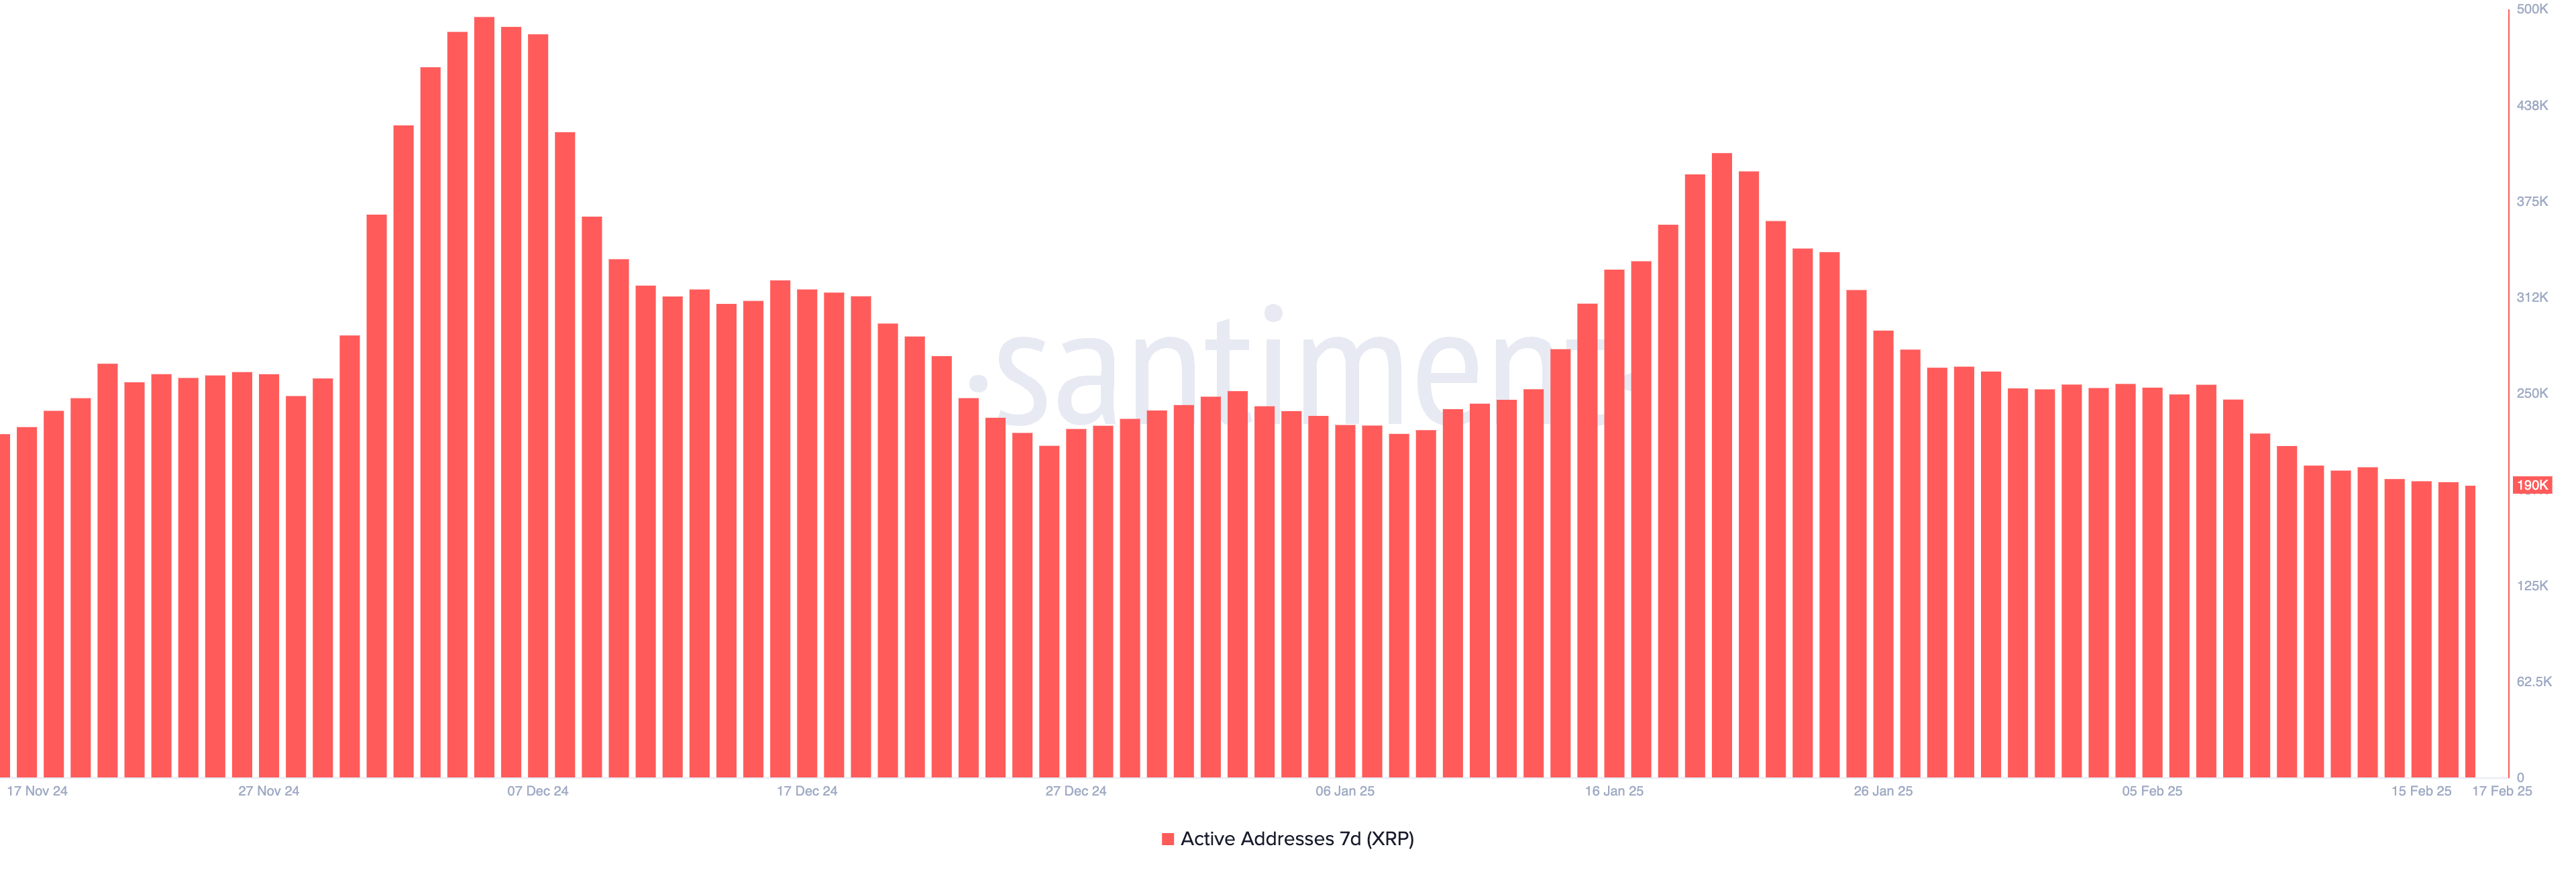
This is XRP’s lowest 7-day active address count since November 14, 2024, reinforcing concerns about declining user engagement. Historically, prolonged declines in this metric have preceded periods of price stagnation or downside pressure, as reduced network activity often reflects fading momentum.
If active addresses continue falling, it could indicate weakening investor confidence, making it harder for XRP to sustain any significant bullish moves.
However, if this metric stabilizes or starts rebounding, it could suggest a renewed interest in the asset, potentially supporting price recovery efforts. For now, XRP remains in a cautious phase, with traders monitoring whether activity will pick up or continue declining.
XRP Price Prediction: Will XRP Face a 29% Further Correction?
XRP’s EMA lines are forming a death cross, with short-term moving averages crossing below long-term ones, signaling a potential bearish trend.
A confirmed death cross often suggests that downside momentum is strengthening, increasing the likelihood of further XRP price declines.
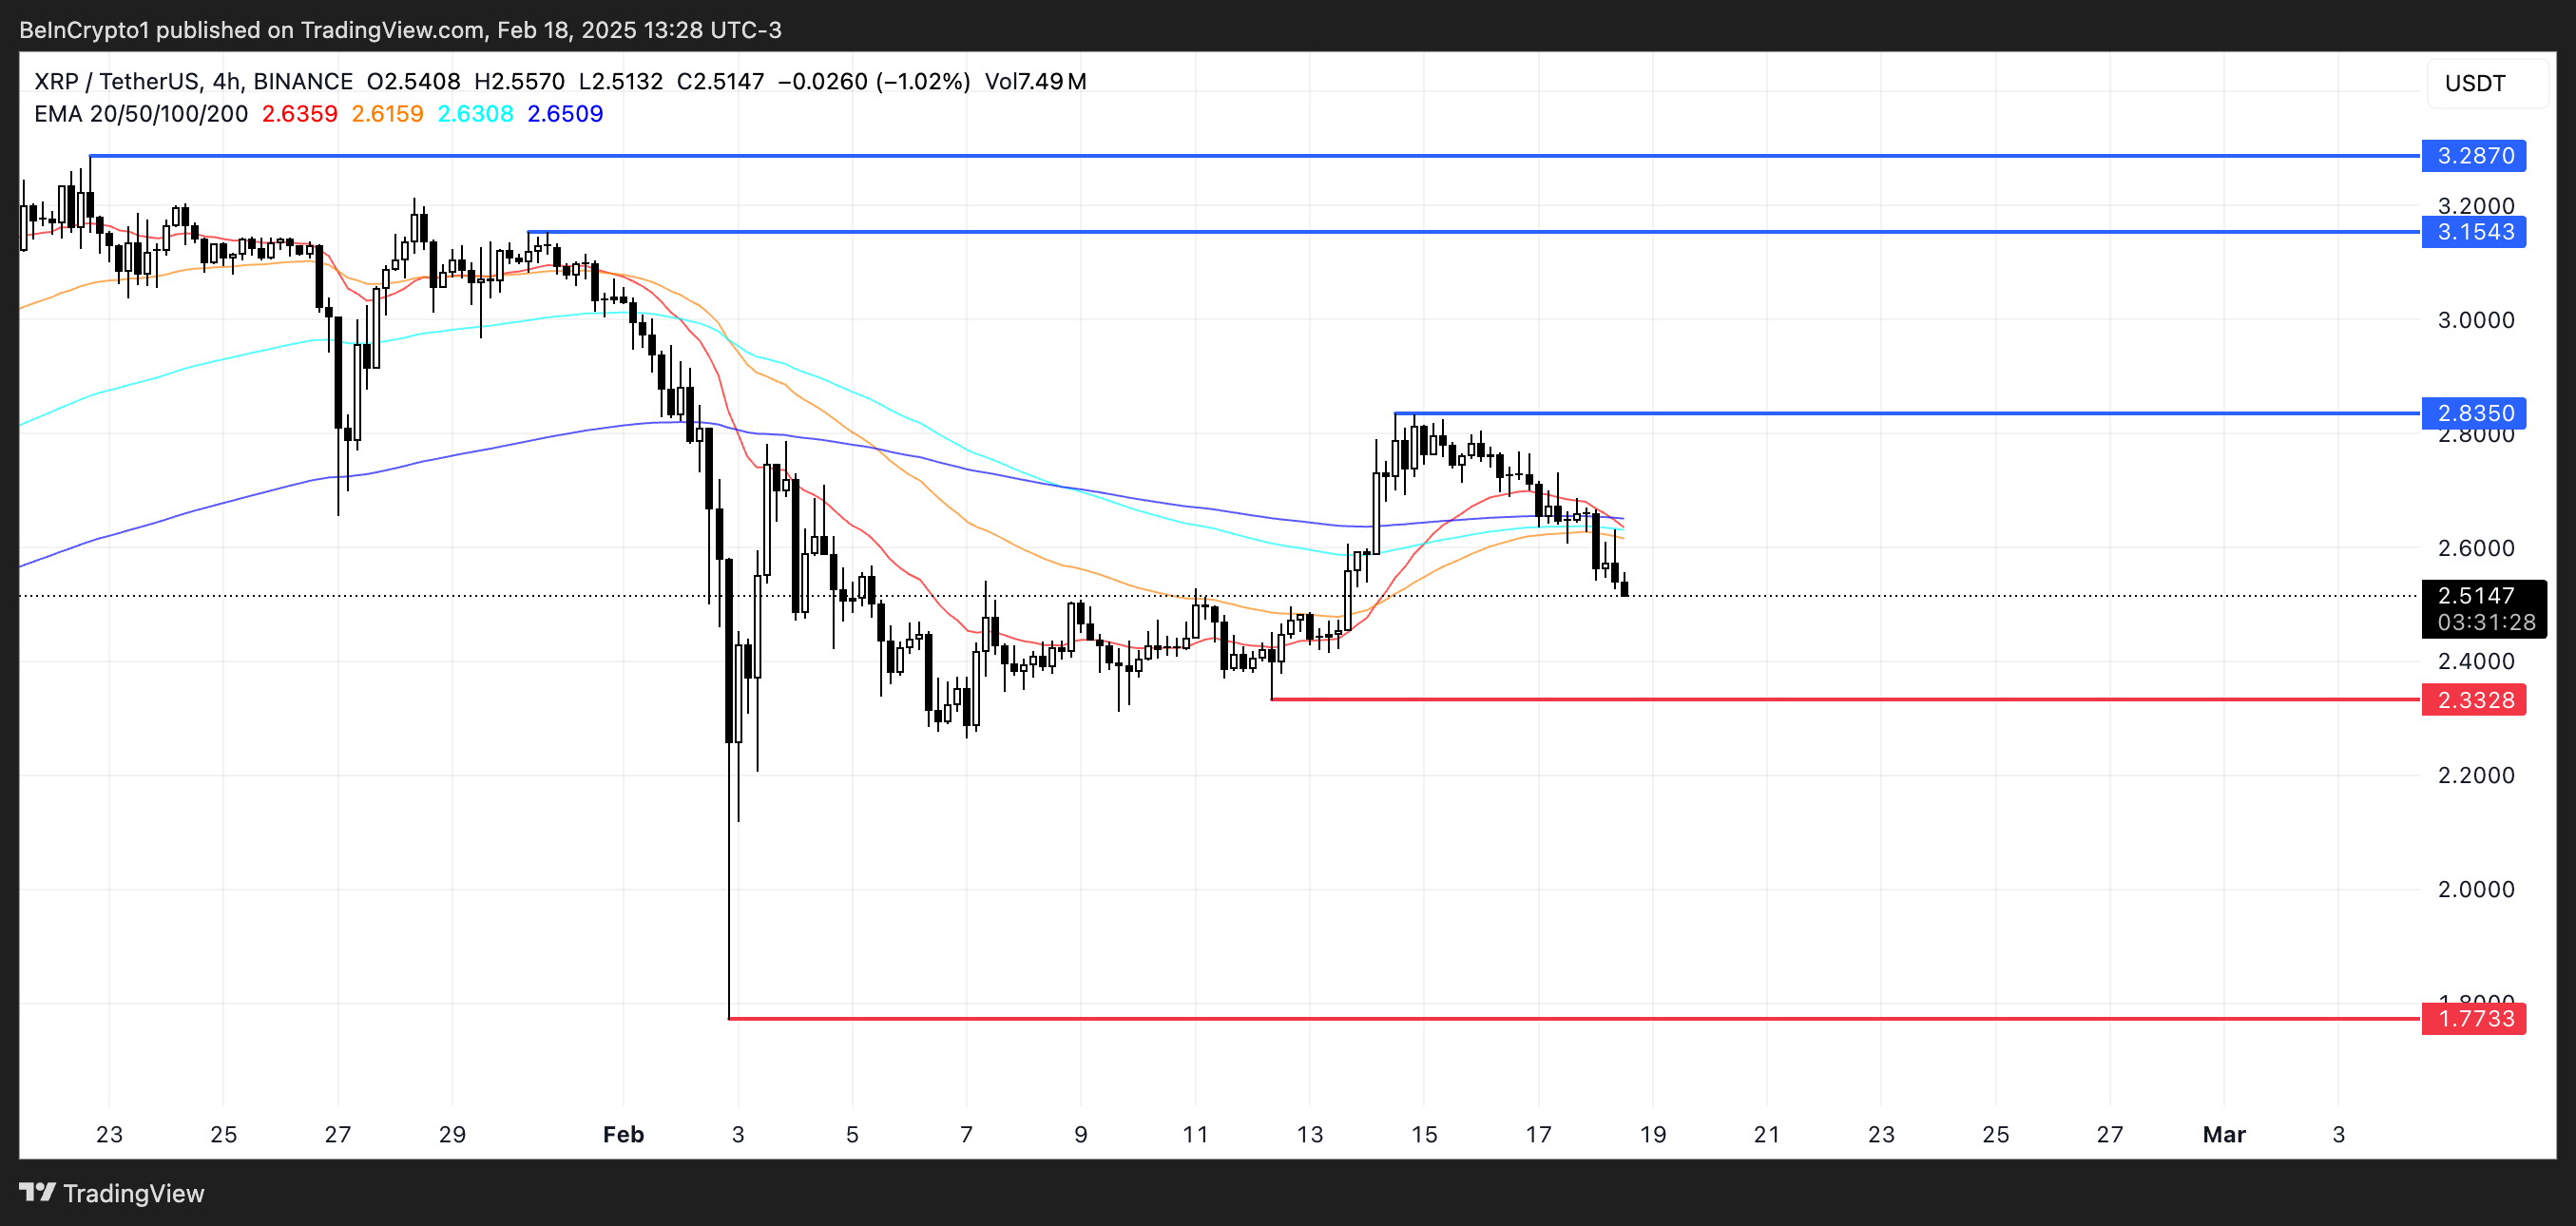
If the sell-off intensifies, XRP price could test support at $2.33, and a breakdown below that level could trigger a 29% correction down to $1.77. Such a move would reinforce bearish sentiment and could lead to extended weakness unless buyers step in to defend key levels.
However, if XRP can reverse this trend and regain bullish momentum, it could challenge the $2.83 resistance level.
A successful breakout above this zone could pave the way for a rally toward $3.15. If momentum persists, XRP could push as high as $3.28, marking its first move above $3 in February 2025.
Disclaimer
In line with the Trust Project guidelines, this price analysis article is for informational purposes only and should not be considered financial or investment advice. BeInCrypto is committed to accurate, unbiased reporting, but market conditions are subject to change without notice. Always conduct your own research and consult with a professional before making any financial decisions. Please note that our Terms and Conditions, Privacy Policy, and Disclaimers have been updated.

Story (IP) price has surged more than 10% in the last 24 hours as excitement builds around its newly launched mainnet. Story was one of the most anticipated crypto launches of the year, backed by $134 million in funding from investors like Andreessen Horowitz and Polychain Capital.
With strong momentum driving its price action, technical indicators suggest that IP is at an important point. Its market cap crossed $500 million before seeing a brief correction. Whether it continues its rally toward new highs or faces resistance and pulls back will depend on how traders react to key support and resistance levels.
Story ADX Shows the Uptrend Is Very Strong
Story is trending after the official launch of its Layer-1 mainnet, with its recent surge triggering a strong increase in ADX. The Average Directional Index (ADX), which measures trend strength regardless of direction, has climbed from 25 yesterday to 43 today.
Its price raised more than 11% in the last 24 hours, making it the best-performing altcoin of the day.
Typically, an ADX reading above 25 confirms a strong trend, while values below 20 indicate weak or choppy price action. The current rise suggests that momentum is picking up, with increased trading activity and a sustained directional move.
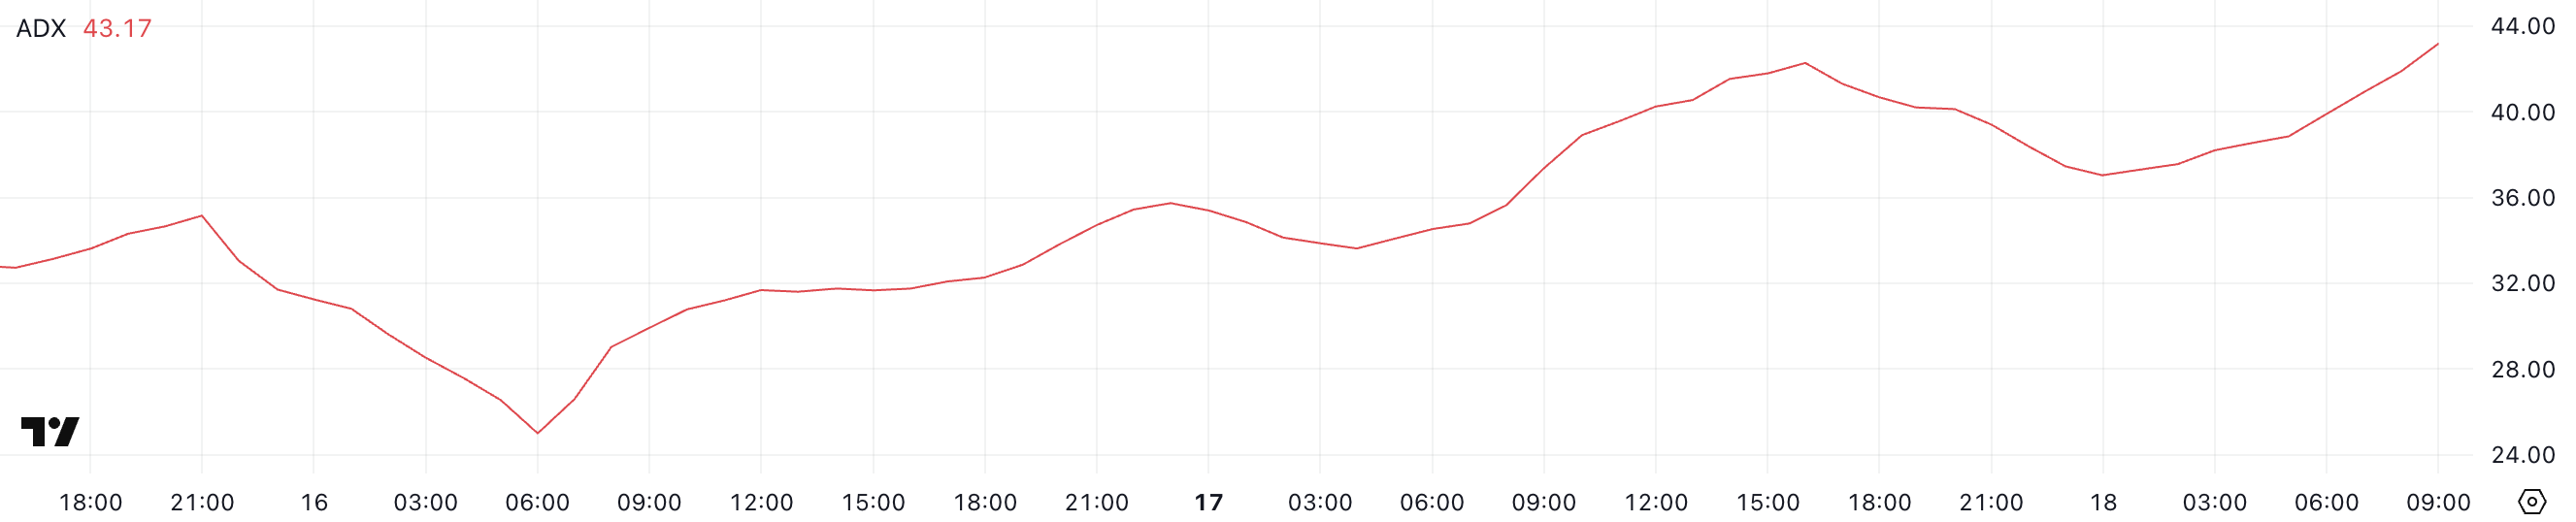
With ADX now at 43, the trend remains strong, reinforcing bullish sentiment. This means buyers are in control, and the price could continue its upward trajectory if momentum holds. If ADX continues rising, it could support further gains and signal an extended trend.
However, if ADX starts declining, it may suggest that Story (IP) momentum is fading, which could lead to consolidation or even a potential reversal.
A drop in ADX alongside price weakness would be an early warning of trend exhaustion, while a stabilization in ADX at high levels would indicate that the market is still in a strong phase.
IP BBTrend Is Still Very Positive, But Stable
IP’s BBTrend has remained positive for more than a day, reaching a peak of 14.3 before pulling back to 10.6. This comes after a strong recovery from its February 16 low, when it hit a negative peak of -29.
BBTrend (Bollinger Band Trend) is an indicator that measures price direction relative to its Bollinger Bands, helping to identify trend strength and potential reversals.
Positive values indicate bullish momentum, while negative values suggest a downtrend. Extreme readings often signal overbought or oversold conditions.
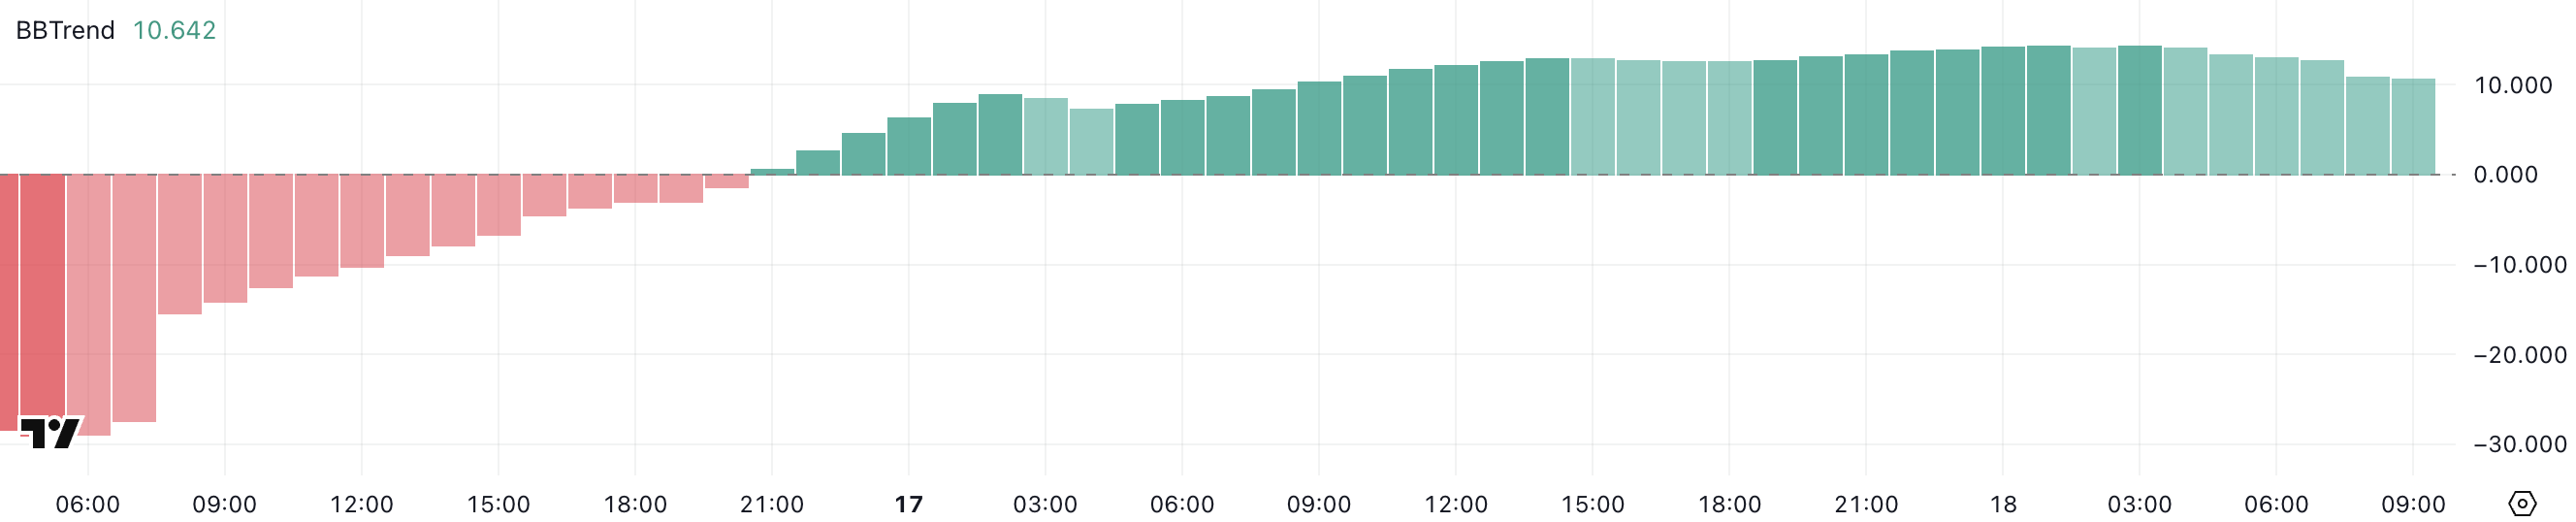
With BBTrend now at 10.6, the indicator remains in bullish territory, but its decline from 14.3 suggests that momentum is cooling off. This could mean that buying pressure is fading, leading to either a period of consolidation or a potential shift in trend.
If BBTrend stabilizes around this level, the uptrend may continue, but a further drop could indicate growing weakness. Traders will be watching closely to see if the pullback is temporary or the beginning of a larger move downward.
IP Price Prediction: Can Story Reach $2.30 Soon?
Story (IP), which is placing it between the intersection of Intellectual Property and Artificial Intelligence, is currently trading between a resistance at $2.12 and a support at $1.90, staying within a key price range. If the uptrend weakens and $1.90 is lost, the next major support lies at $1.79.
A continued downtrend could push the price further toward $1.58 or even $1.40, signaling a deeper correction. These levels will be critical in determining whether buyers step in to defend the trend or if selling pressure intensifies.
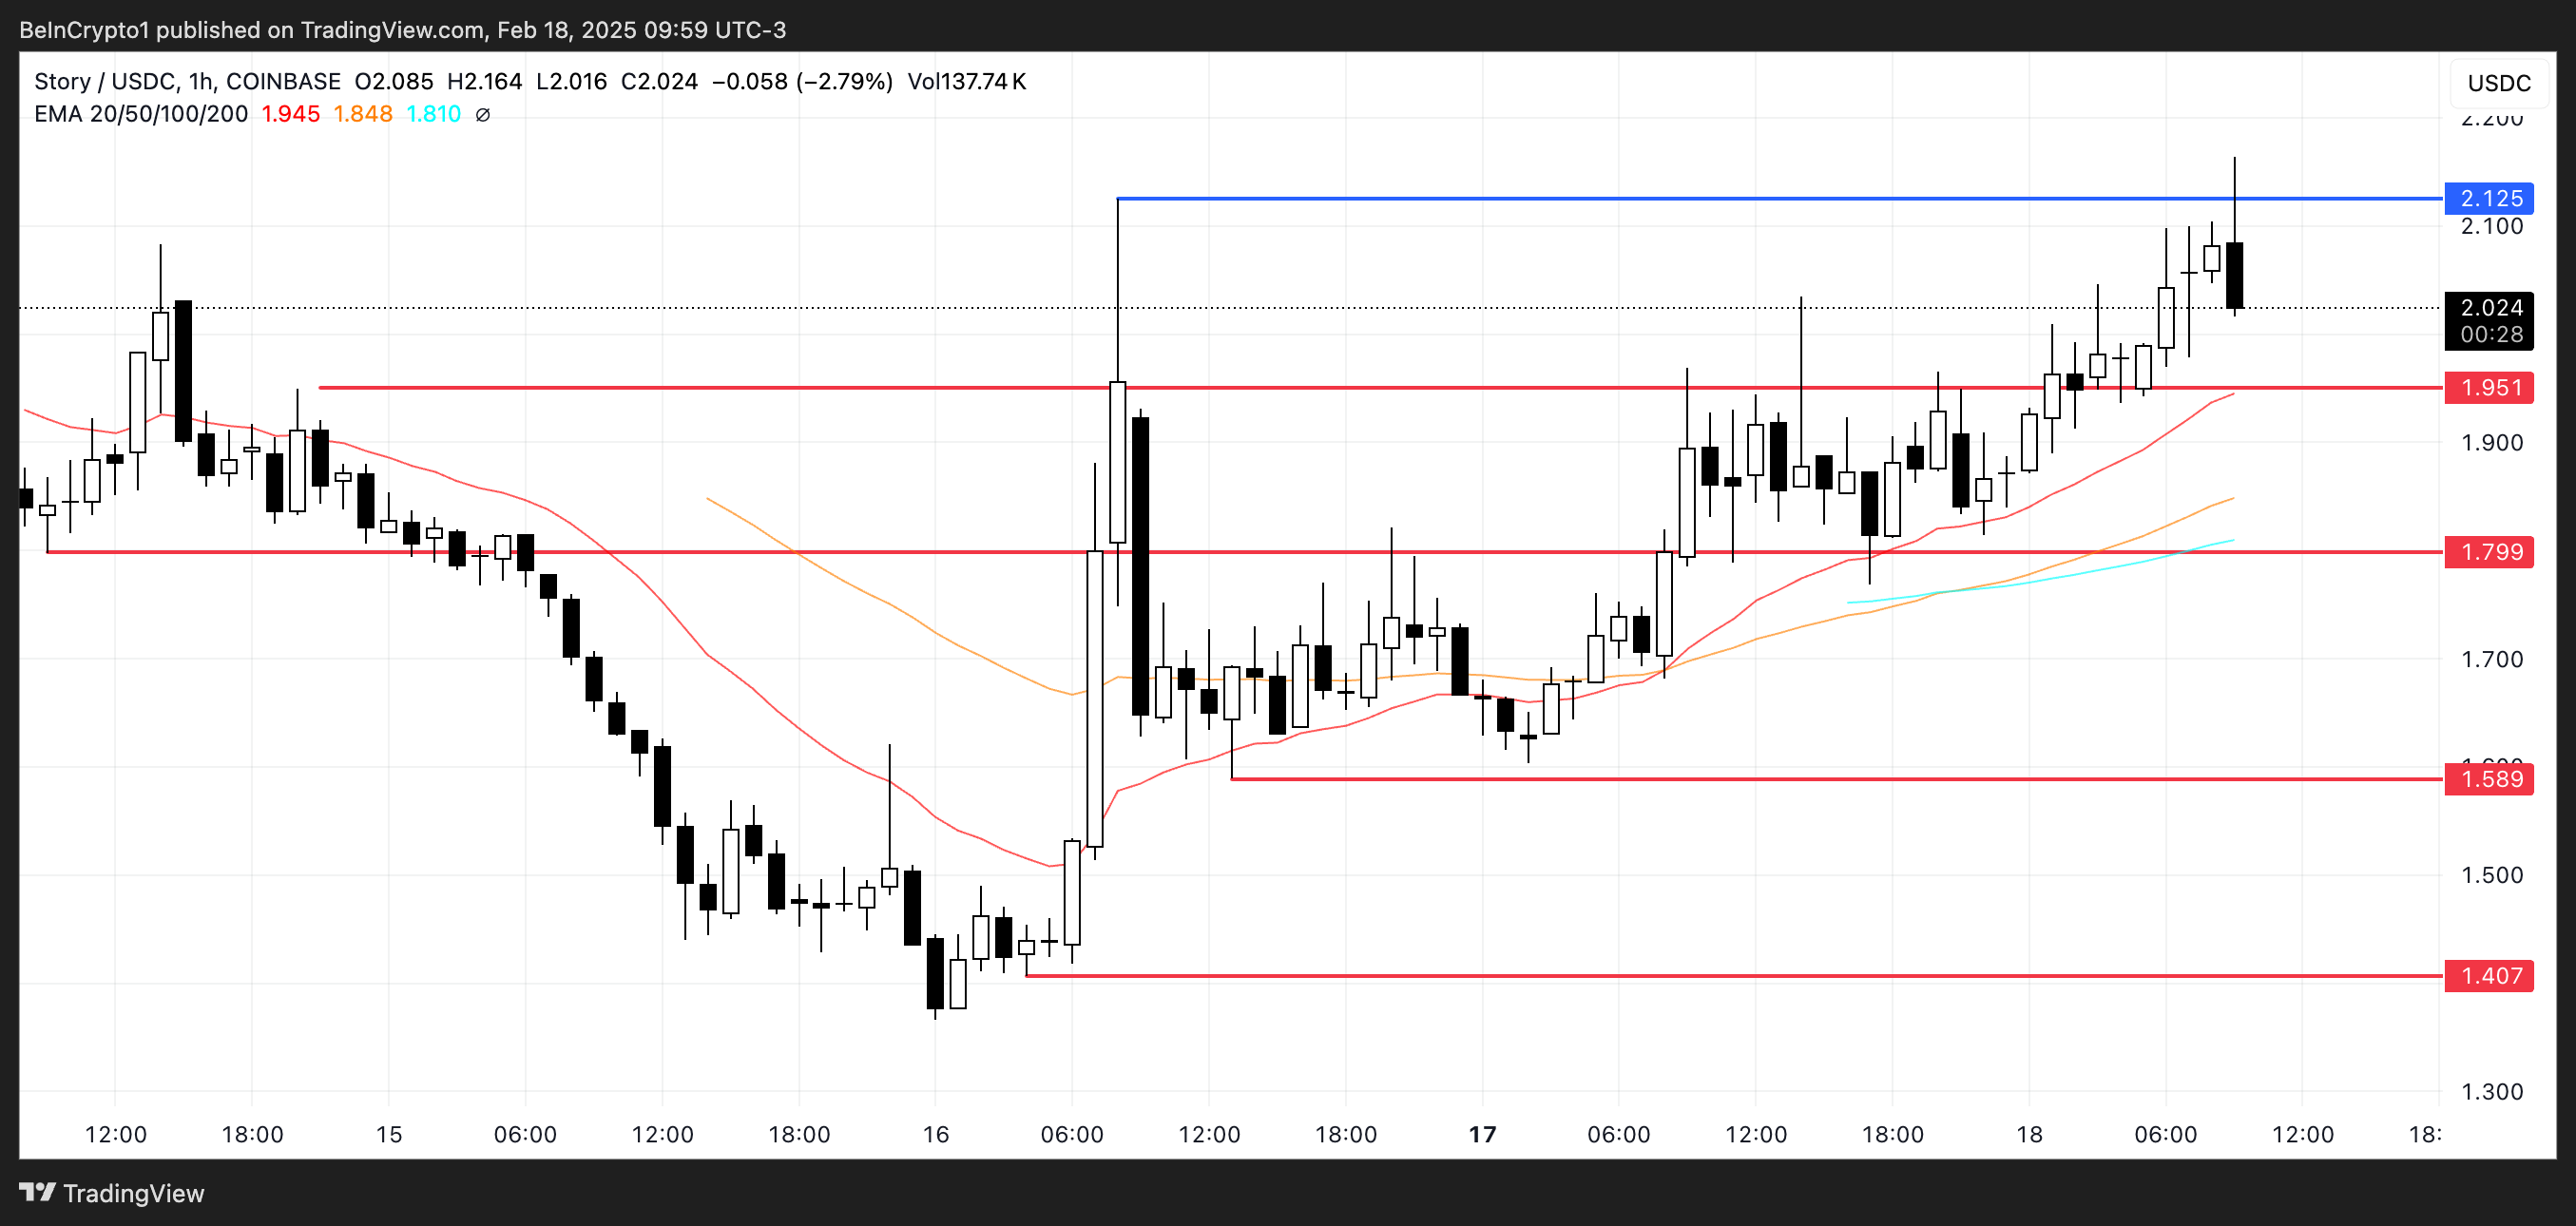
On the other hand, if the uptrend holds strong, the altcoin could test the $2.12 resistance. A breakout above this level could confirm bullish momentum and open the door for a move toward $2.20 or even $2.30.
In this case, buyers would remain in control, and price action could extend higher.
Disclaimer
In line with the Trust Project guidelines, this price analysis article is for informational purposes only and should not be considered financial or investment advice. BeInCrypto is committed to accurate, unbiased reporting, but market conditions are subject to change without notice. Always conduct your own research and consult with a professional before making any financial decisions. Please note that our Terms and Conditions, Privacy Policy, and Disclaimers have been updated.

HYPE Price Drops 6% Despite HyperEVM Launch—What’s Next?

XRP Price Struggles Amid 53% Drop in Active Wallets

IP Price Surges 11%, Market Cap Now Crossing $500 Million

Tether Co-Founder Builds Pi Protocol, A Competing Stablecoin
XRP Price Eyes $5 As US SEC Acknowledges Bitwise’s XRP ETF

President Milei’s LIBRA Interview Revealed to Be Fraudulent

2.52 Million Altcoins Are Ruining Crypto’s Future

Animoca Brands Valuation Tanks 75% In Two Years, Here’s Why

Crypto exchange BingX hacked for $43 million

Are The Big Players Losing Interest?

Hong Kong’s Securities Association Tips Authorities On Crypto Self-Regulation

Coinbase cbBTC Set to go Live on Solana
2.52 Million Altcoins Are Ruining Crypto’s Future
Animoca Brands Valuation Tanks 75% In Two Years, Here’s Why
Crypto exchange BingX hacked for $43 million
Are The Big Players Losing Interest?
Hong Kong’s Securities Association Tips Authorities On Crypto Self-Regulation
Coinbase cbBTC Set to go Live on Solana
-
 Market12 hours ago
The Fed is expected to cut interest rates twice in 2025, what might this mean for the Bitcoin price?
-

 Market23 hours ago
Argentina President Milei Denies Promoting LIBRA Meme Coin
-

 Market19 hours ago
Solana (SOL) Dips Into the Red – Healthy Correction or Trend Reversal?
-

 Market17 hours ago
XRP Price Pulls Back From Highs—Are Bulls Still in Control?
-

 Market24 hours ago
AMMs, Trading Bots, and Perpetuals
-

 Market16 hours ago
Meteora Cofounder Ben Chow Resigns Amid Libra Fallout
-

 Market8 hours ago
2-Month High Inflows And HODLing To Drive Cardano Price Rally
-

 Market21 hours ago
Bitcoin Price Pulls Back to Support—Breakdown or Bounce Ahead?