
Market
Ethereum Price Gearing Up for Gains—Can Bulls Sustain The Momentum?

Ethereum price is moving higher above the $2,600 zone. ETH might gain bullish momentum if it clears the $2,800 resistance zone.
- Ethereum started a fresh increase above the $2,650 resistance level.
- The price is trading above $2,680 and the 100-hourly Simple Moving Average.
- There was a break above a key bearish trend line with resistance at $2,680 on the hourly chart of ETH/USD (data feed via Kraken).
- The pair could start a decent upward move if it settles above $2,780 and $2,800.
Ethereum Price Eyes More Gains
Ethereum price remained supported above the $2,500 level, like Bitcoin. ETH formed a base and recently started a fresh increase above the $2,600 and $2,620 resistance levels.
There was a break above a key bearish trend line with resistance at $2,680 on the hourly chart of ETH/USD. The bulls pumped the pair above the $2,700 level. It traded as high as $2,794 before there was a minor pullback. The price dipped below the $2,750 level.
There was a move below the 23.6% Fib retracement level of the upward wave from the $2,550 swing low to the $2,794 high. Ethereum price is now trading above $2,680 and the 100-hourly Simple Moving Average.
On the upside, the price seems to be facing hurdles near the $2,750 level. The first major resistance is near the $2,780 level. The main resistance is now forming near $2,800 or $2,820. A clear move above the $2,820 resistance might send the price toward the $2,920 resistance.

An upside break above the $2,920 resistance might call for more gains in the coming sessions. In the stated case, Ether could rise toward the $3,000 resistance zone or even $3,050 in the near term.
Another Decline In ETH?
If Ethereum fails to clear the $2,780 resistance, it could start another decline. Initial support on the downside is near the $2,675 level or the 50% Fib retracement level of the upward wave from the $2,550 swing low to the $2,794 high. The first major support sits near the $2,640 zone.
A clear move below the $2,640 support might push the price toward the $2,600 support. Any more losses might send the price toward the $2,550 support level in the near term. The next key support sits at $2,440.
Technical Indicators
Hourly MACD – The MACD for ETH/USD is losing momentum in the bullish zone.
Hourly RSI – The RSI for ETH/USD is now above the 50 zone.
Major Support Level – $2,675
Major Resistance Level – $2,780


OpenSea has confirmed plans to release its SEA token while rolling out the OS2 open beta. The upgraded platform now supports transactions across 14 blockchains, including Flow, ApeChain, Sony’s Soneium BSL, and Berachain.
The update also enables cross-chain purchases, expanding interoperability for users.
OpenSea Finally Launches Its Token
The SEA token distribution will consider historical activity on OpenSea, rather than focusing only on recent transactions. The redemption process will be straightforward, and users in the US will also have access.
In December, OpenSea established a foundation in the Cayman Islands, a move that aligns with its broader expansion efforts.
The NFT marketplace is entering the token space later than some competitors. Magic Eden introduced its ME token in December 2024, but its value dropped nearly 90% from launch. Blur’s token, released in mid-2024, faced a similar decline.
NFT marketplace tokens have struggled with adoption and price stability. OpenSea’s entry into this space raises the question of whether it can shift market sentiment or encounter the same challenges as its predecessors.
Disclaimer
In adherence to the Trust Project guidelines, BeInCrypto is committed to unbiased, transparent reporting. This news article aims to provide accurate, timely information. However, readers are advised to verify facts independently and consult with a professional before making any decisions based on this content. Please note that our Terms and Conditions, Privacy Policy, and Disclaimers have been updated.

Onyxcoin (XCN) had been in a three-week-long downtrend, erasing much of the gains it made in January. While the altcoin is preparing for a potential bullish breakout, it faces challenges in ensuring a strong recovery.
Continued outflows and investor sentiment are proving to be key hurdles for XCN’s recovery.
Onyxcoin Investors Are Pulling Back
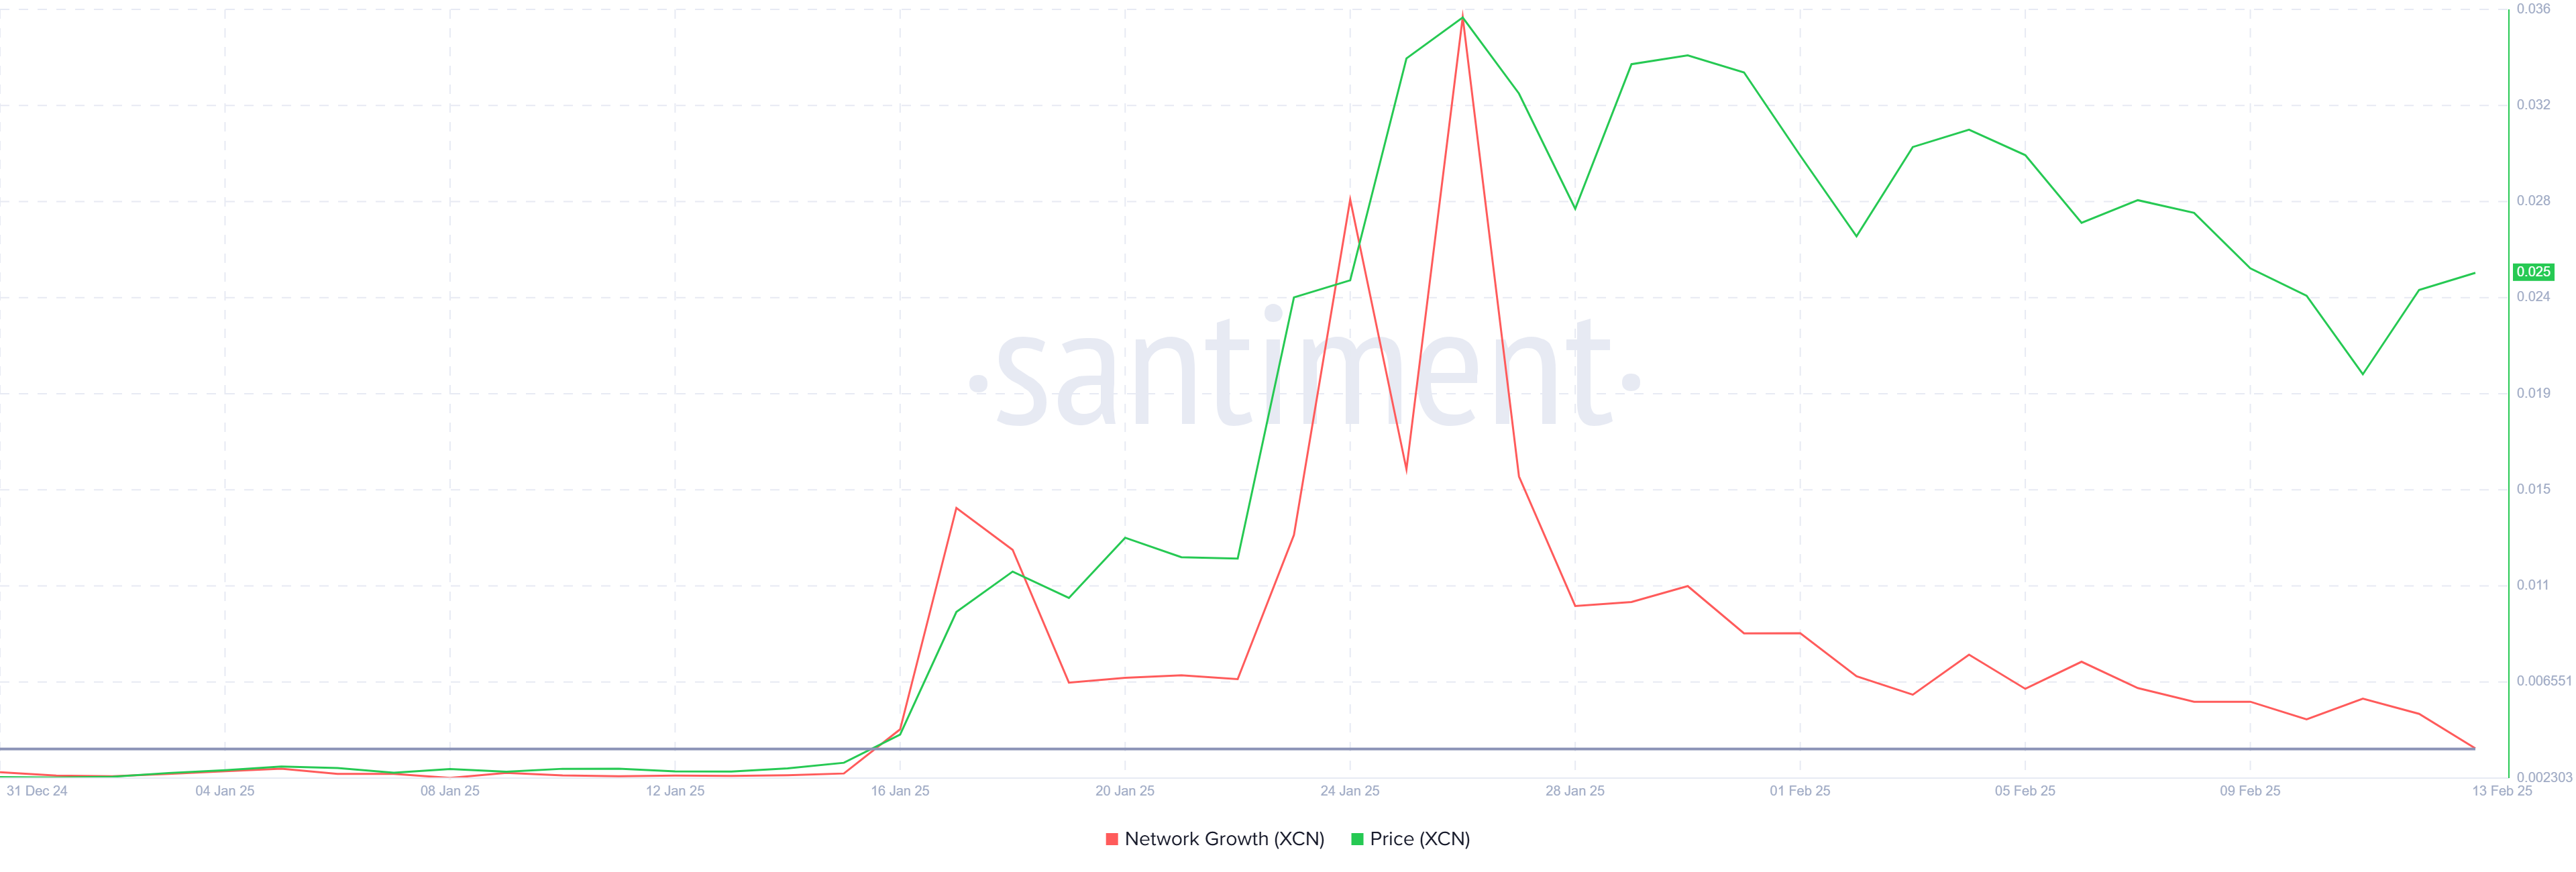
The network growth indicator for Onyxcoin has recently reached a monthly low, signaling a decrease in new addresses on the network. This metric helps gauge how well the altcoin is gaining traction among new investors. Unfortunately for XCN, the prolonged decline has resulted in a loss of interest from potential buyers.
The drop in network growth reflects waning confidence, which is impacting XCN’s ability to recover. With fewer new participants entering the market, XCN is struggling to build momentum, leaving the altcoin more vulnerable to further downside risks. For a meaningful recovery, the altcoin will need to attract fresh investor interest.
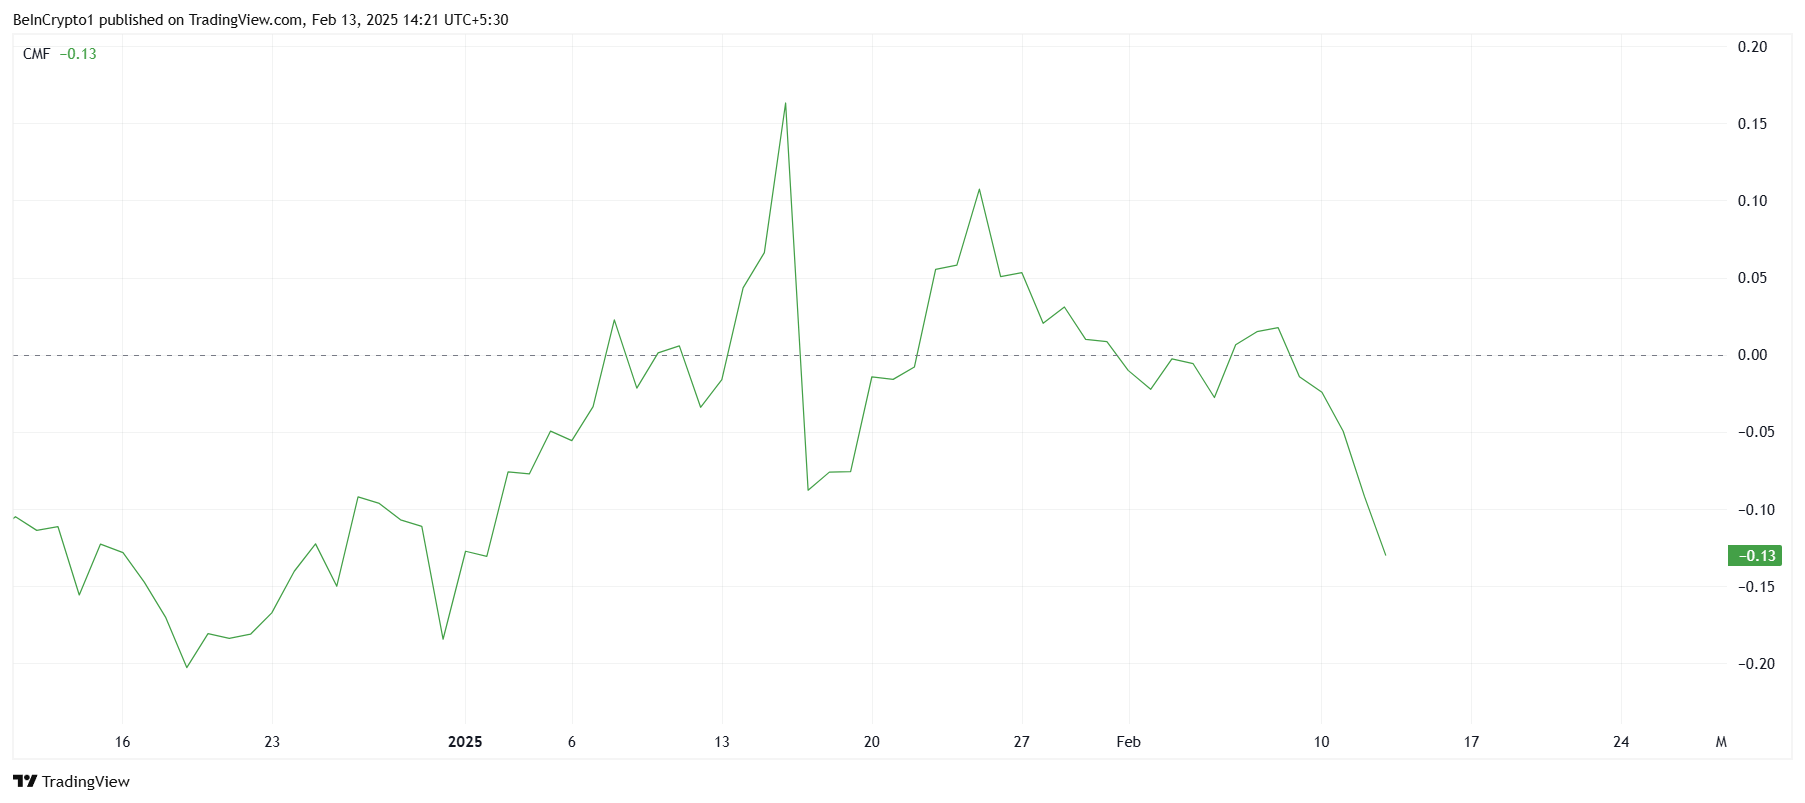
Onyxcoin’s broader momentum is showing signs of weakness, as indicated by the Chaikin Money Flow (CMF). The CMF has exhibited a sharp downtick over the last few days, suggesting that money is flowing out of the asset. This pullback could reflect growing investor frustration with the lack of price recovery.
The decline in the CMF is a sign that XCN holders are pulling their funds, possibly due to the prolonged downtrend. If this trend continues, it could delay or even prevent a full recovery, as outflows put downward pressure on the price. Without a shift in market sentiment, Onyxcoin could continue to face challenges.
XCN Price Prediction: Breakout May Not Materialize
XCN’s price is breaking out of a descending wedge pattern it had been stuck in for nearly four weeks. This bullish pattern typically signals a potential 66% rally post-breakout, with the target price set at $0.0398. However, achieving this level will depend on overcoming the challenges posed by current market conditions.
Firstly, the altcoin needs to secure $0.0237 as support. If investor behavior improves and broader market conditions become more favorable, XCN could rise toward $0.0358. However, this scenario will require stronger investor confidence and positive market cues.
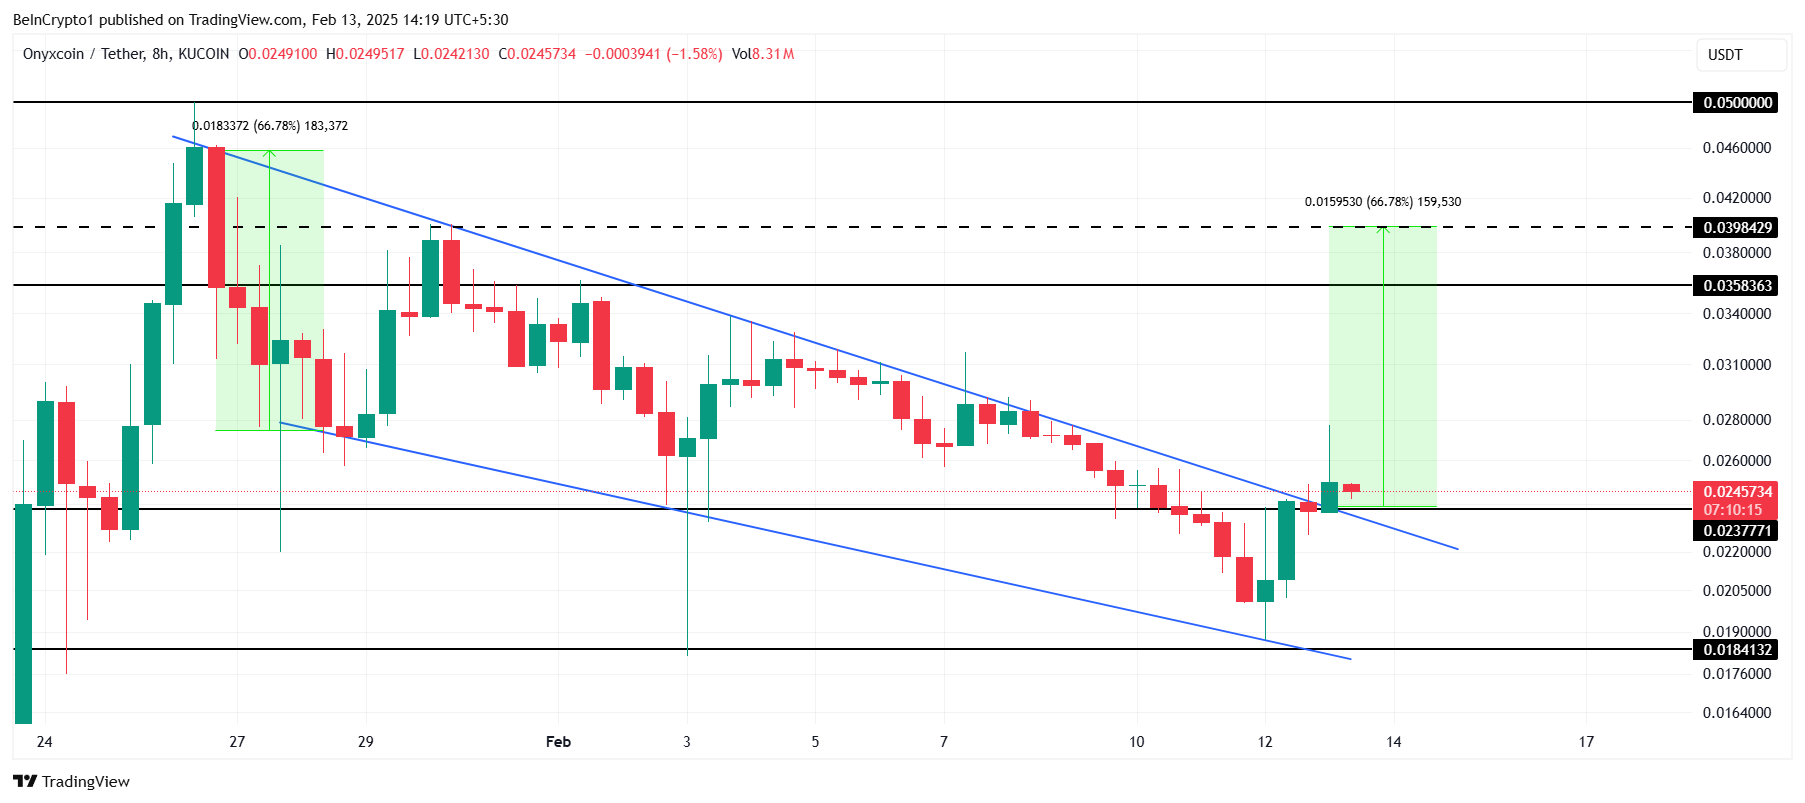
A more realistic approach, based on the current market sentiment, suggests XCN might hover around the $0.0237 level. Losing this support could result in a consolidation period, with the price potentially dropping to $0.0184. This would prolong the altcoin’s downtrend and prevent any immediate recovery.
Disclaimer
In line with the Trust Project guidelines, this price analysis article is for informational purposes only and should not be considered financial or investment advice. BeInCrypto is committed to accurate, unbiased reporting, but market conditions are subject to change without notice. Always conduct your own research and consult with a professional before making any financial decisions. Please note that our Terms and Conditions, Privacy Policy, and Disclaimers have been updated.
BNB has staged an impressive comeback, surging 40% after hitting a five-month low on February 3. The coin now trades at $698.40, adding 10% to its value over the past day.
Despite broader market consolidation, BNB has defied the trend, maintaining strong upward momentum as accumulation rises.
BNB Defies Market Headwinds
BNB plunged to a five-month low of $500 on February 3. However, despite recent market headwinds, the fifth crypto asset by market capitalization bucked the general trend and recorded an uptrend. It currently trades at $698.40, climbing by 40% in the past ten days.
An assessment of the BNB/USD one-day chart reveals that this price hike is backed by actual coin demand and not by speculative trades. For example, its Relative Strength Index (RSI) is in an upward trend above the 50-neutral line at 62.22, reflecting the buying pressure in the market.
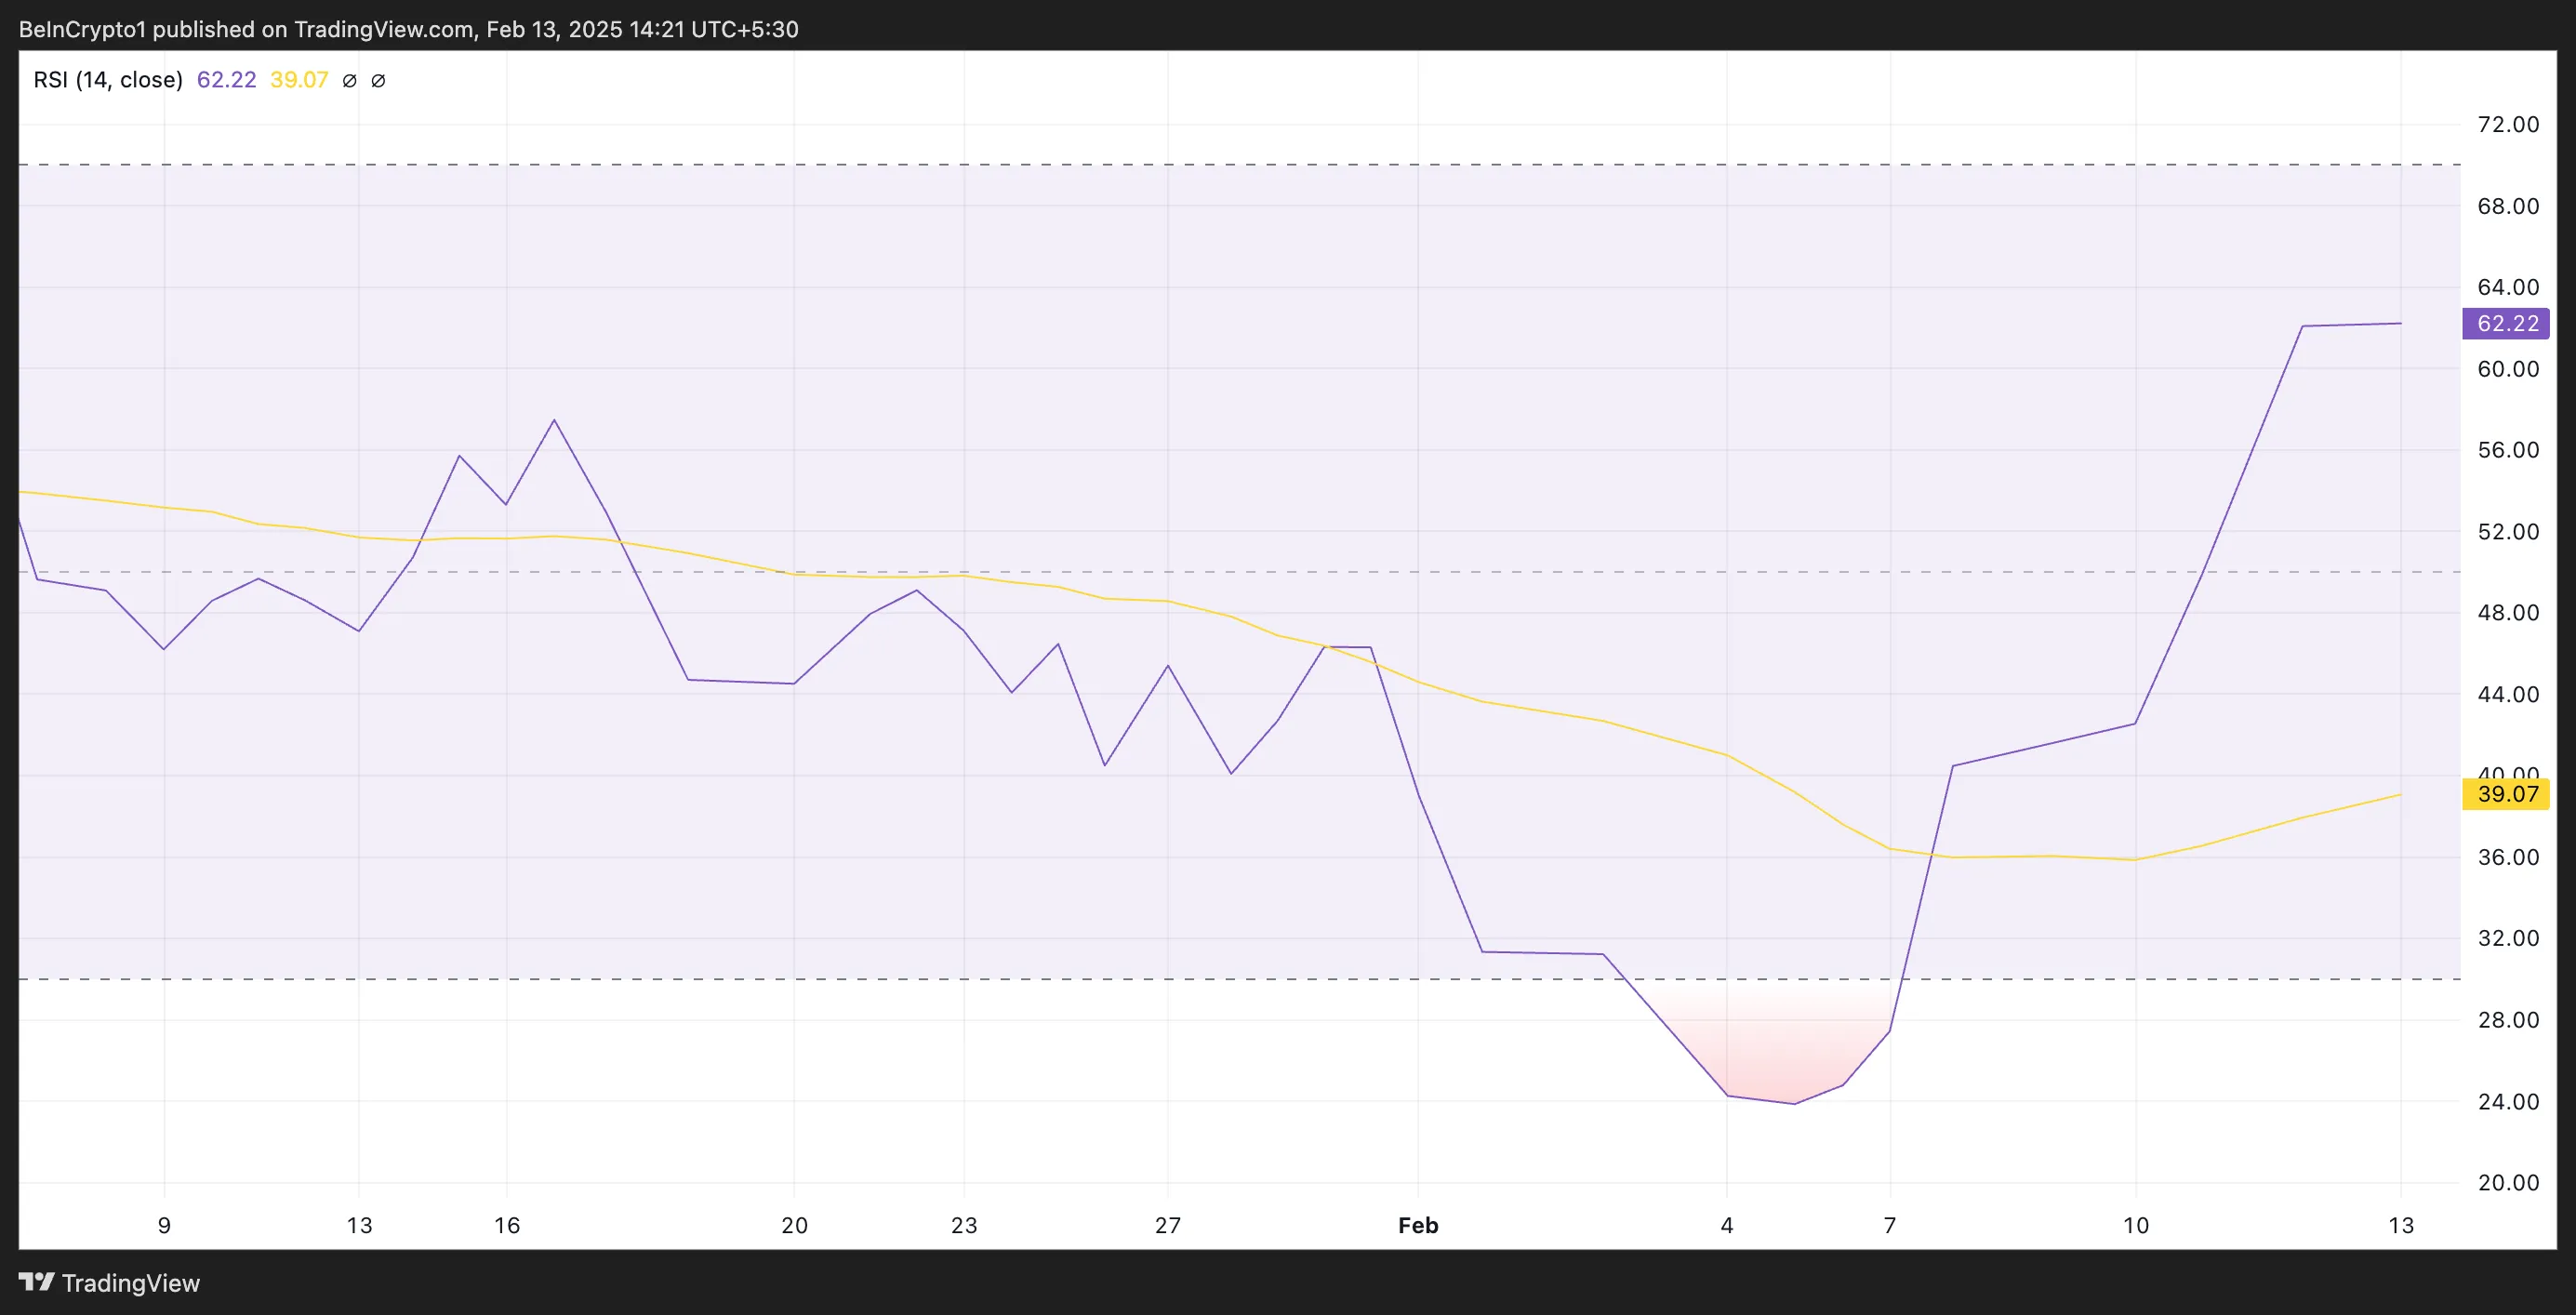
The RSI indicator measures an asset’s overbought and oversold market conditions. It ranges between 0 and 100, with values above 70 suggesting that the asset is overbought and due for a correction. On the other hand, values below 30 indicate that the asset is oversold and may witness a rebound.
At 62.22, BNB’s RSI indicates it is in bullish territory but not yet overbought. This suggests strong buying momentum with room for further upside.
Moreover, the coin’s Aroon Up Line is at 100%, highlighting the strength of the current uptrend.
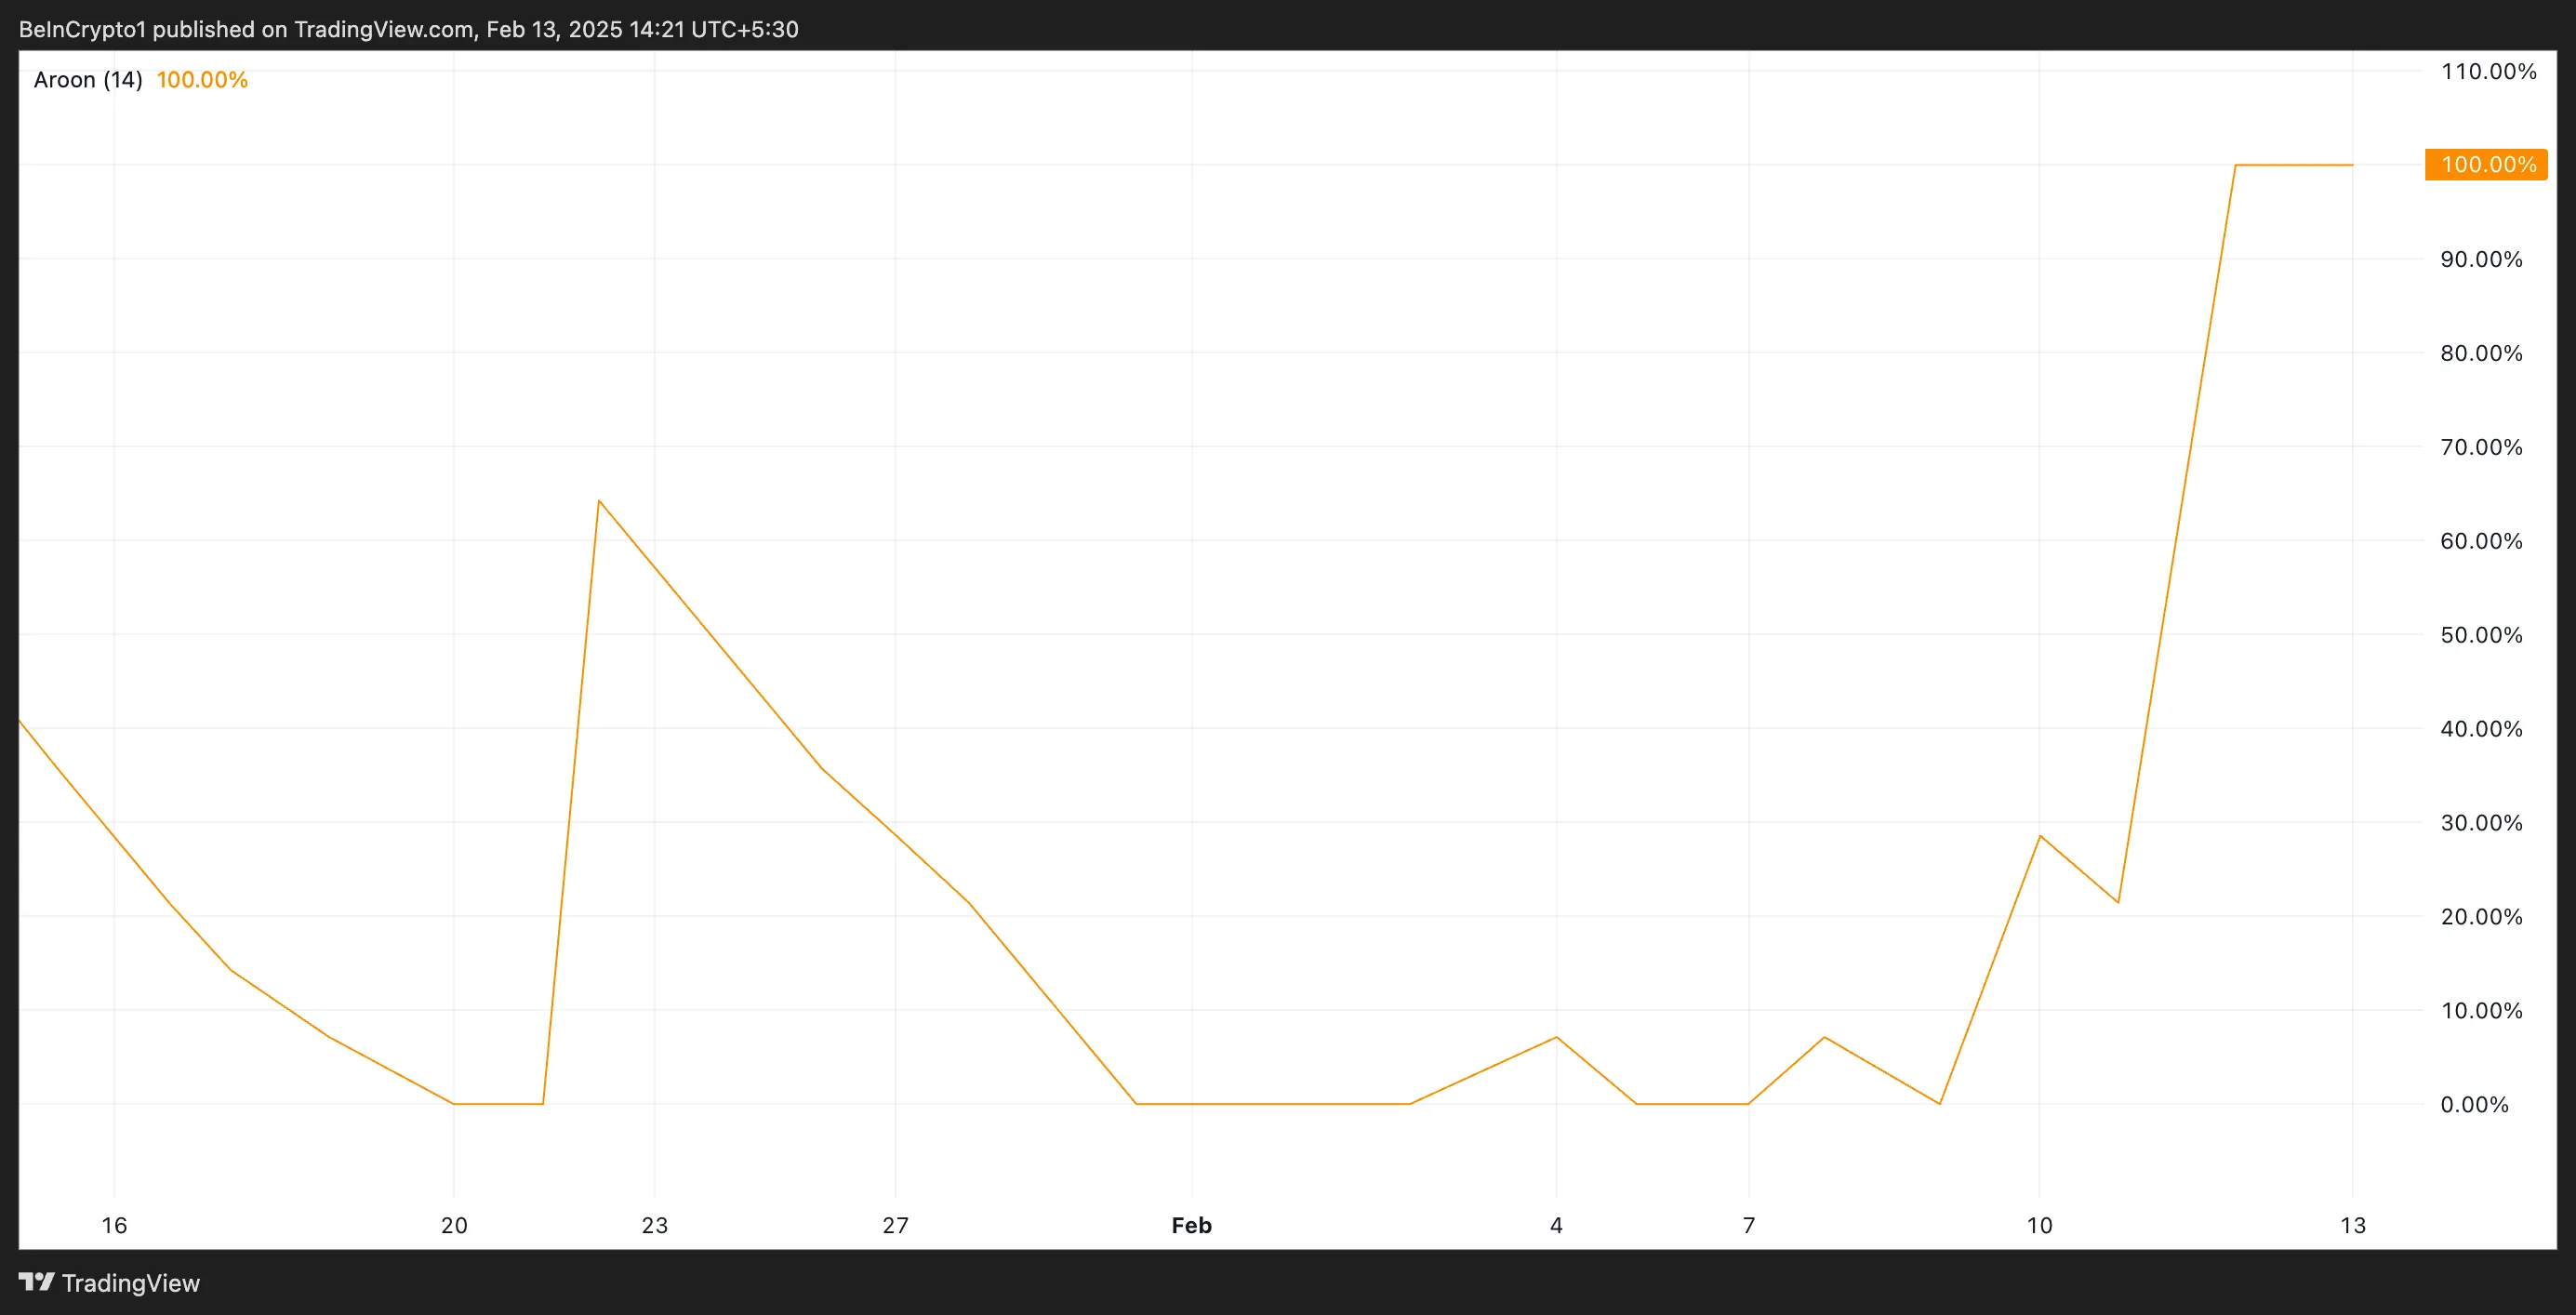
The Aroon Indicator measures an asset’s trend strength. It identifies potential reversals by tracking the time elapsed since the highest high (Aroon Up) and lowest low (Aroon Down) over a set period. When the Aroon Up line is at 100%, it signals a strong uptrend, indicating that a new high was recently reached and bullish momentum is dominant.
BNB Price Prediction: All-Time High Next?
According to readings from BNB’s Fibonacci Retracement tool, if the demand for BNB strengthens, its next price target is its all-time high of $793.86, last reached on December 4.
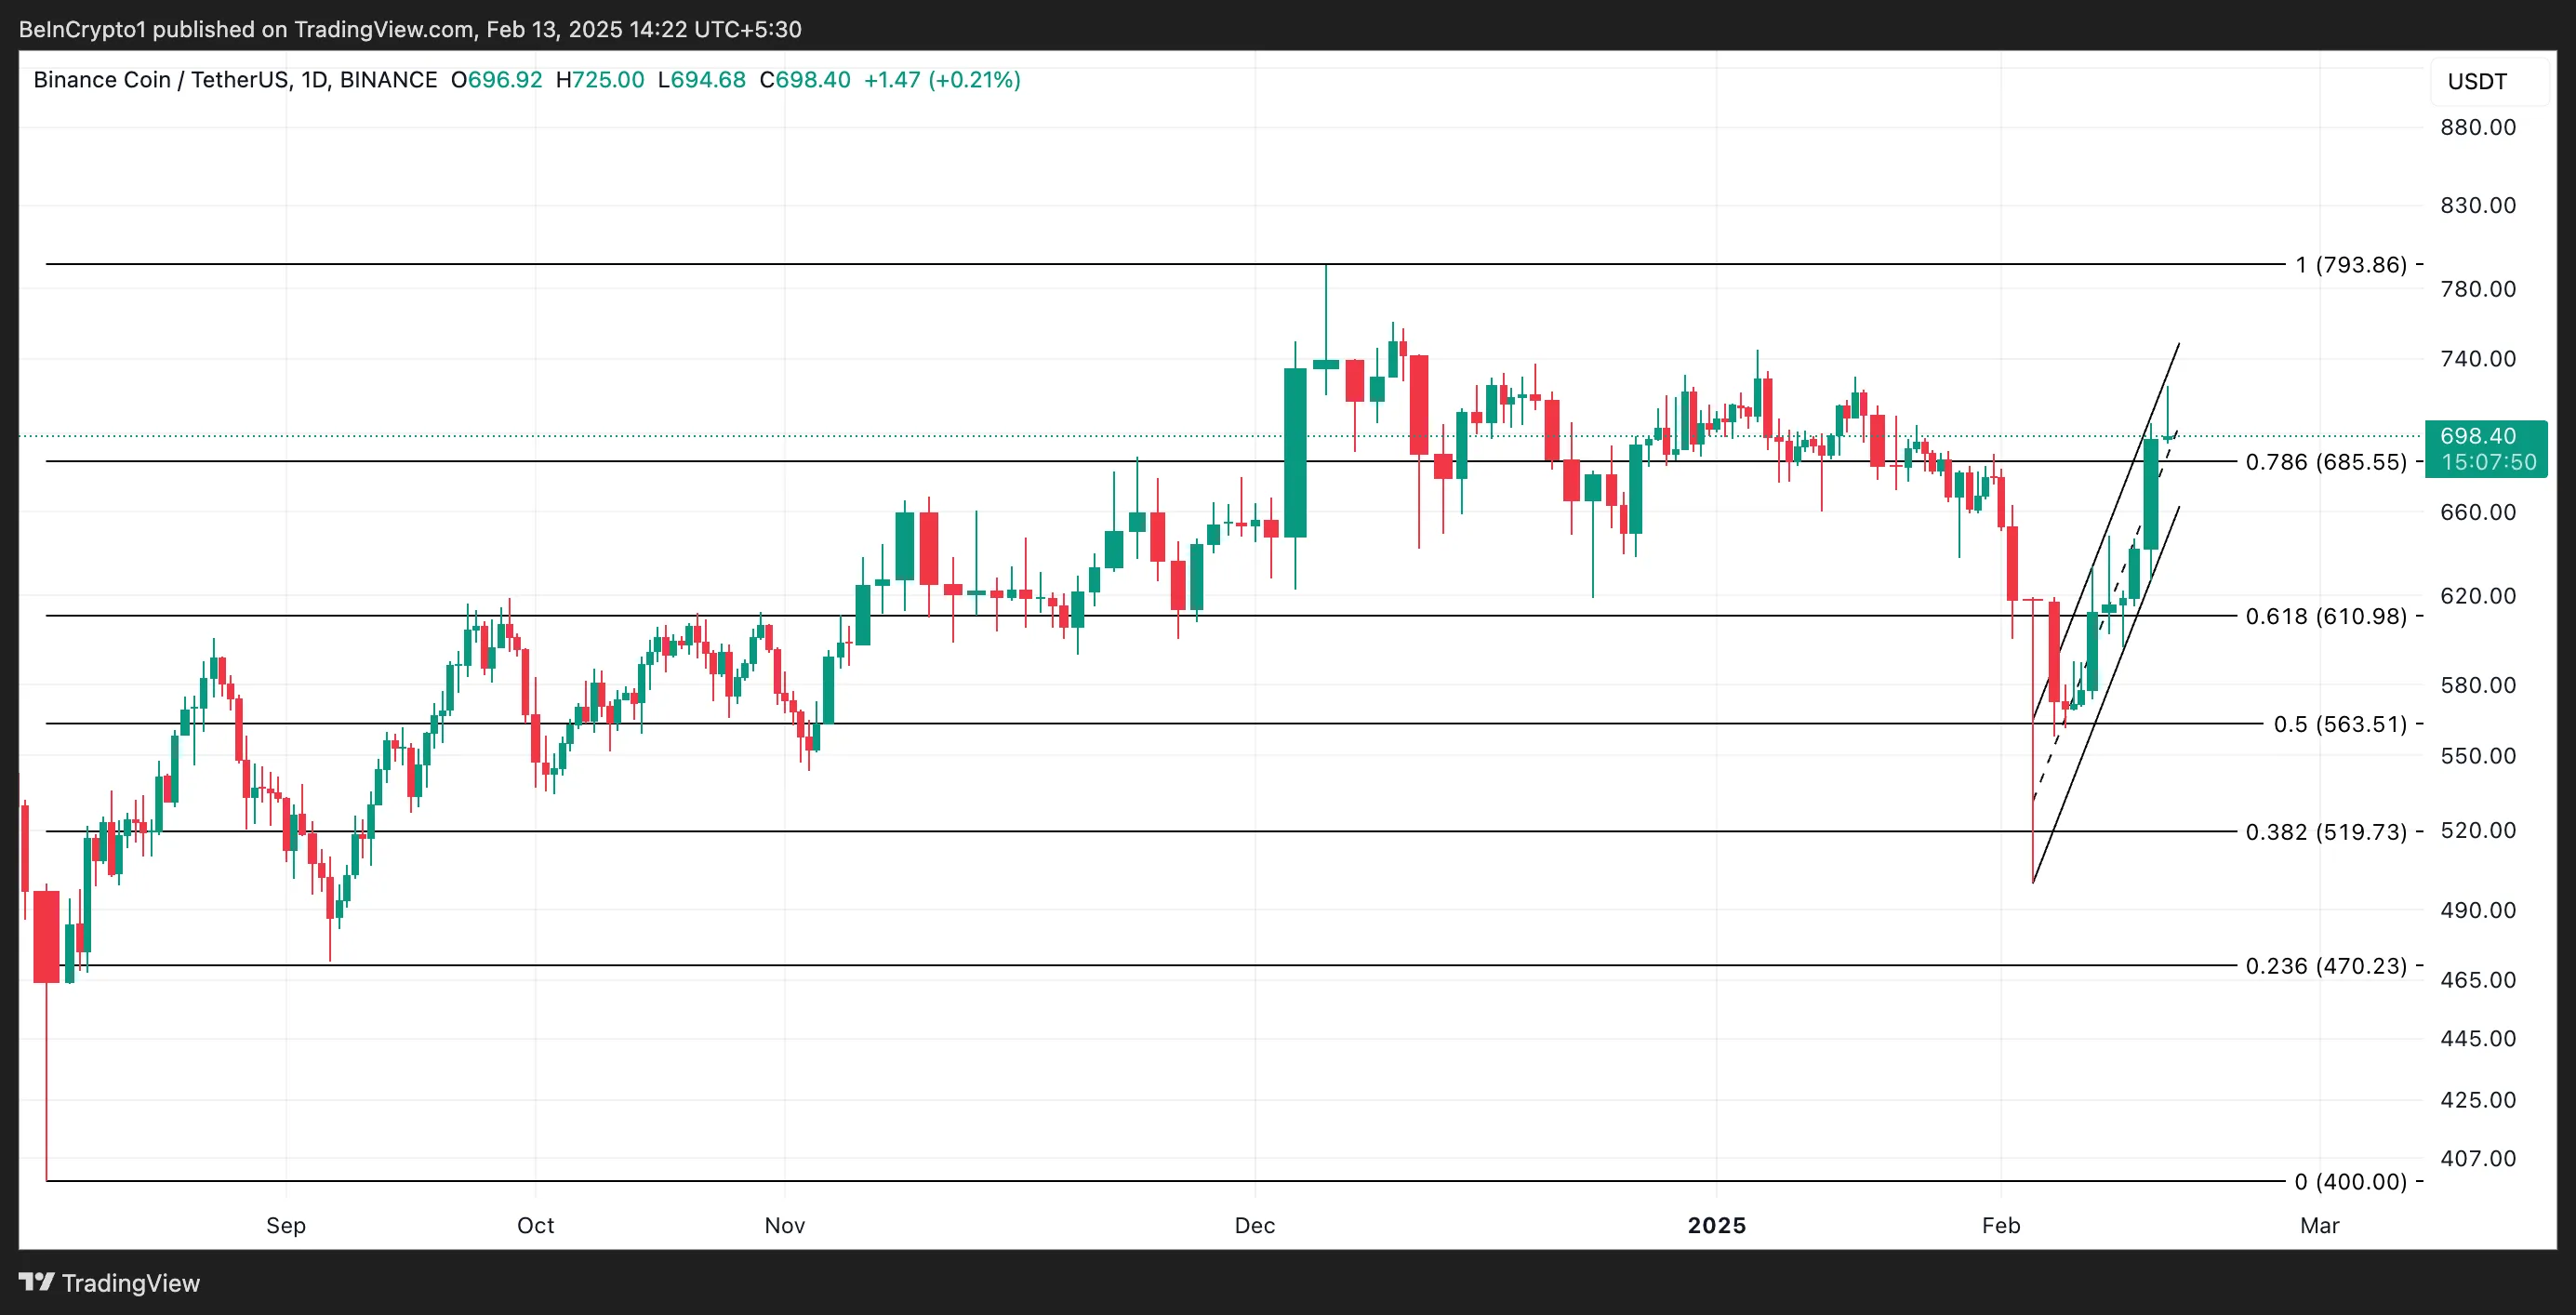
However, a reversal in the current trend will invalidate this bullish prediction. In that scenario, BNB could shed recent gains and fall to $685.55. If the bulls fail to defend this support level, its price could drop to $610.98.
Disclaimer
In line with the Trust Project guidelines, this price analysis article is for informational purposes only and should not be considered financial or investment advice. BeInCrypto is committed to accurate, unbiased reporting, but market conditions are subject to change without notice. Always conduct your own research and consult with a professional before making any financial decisions. Please note that our Terms and Conditions, Privacy Policy, and Disclaimers have been updated.

Analysts Predict Dogecoin Price To Hit $4 Amid DOGE ETF Hype
NFT Marketplace OpenSea Launches SEA Token

Best Altcoins to Buy as Staking Spot Ethereum ETFs Could Fuel a Crypto Bull Run

Onyxcoin (XCN) Price Recovery Plagued By Massive Outflows

Bitcoin Price Soars Despite US PPI Dampens Crypto Market Sentiment
BNB Price Climbs, Can It Break Its All-Time High?

2.52 Million Altcoins Are Ruining Crypto’s Future

Animoca Brands Valuation Tanks 75% In Two Years, Here’s Why

Crypto exchange BingX hacked for $43 million

Are The Big Players Losing Interest?

Hong Kong’s Securities Association Tips Authorities On Crypto Self-Regulation

Coinbase cbBTC Set to go Live on Solana
2.52 Million Altcoins Are Ruining Crypto’s Future
Animoca Brands Valuation Tanks 75% In Two Years, Here’s Why
Crypto exchange BingX hacked for $43 million
Are The Big Players Losing Interest?
Hong Kong’s Securities Association Tips Authorities On Crypto Self-Regulation
Coinbase cbBTC Set to go Live on Solana
-

 Altcoin22 hours ago
Glassnode Reveals Altcoin Devaluation Amid Bitcoin Stability
-
 Altcoin24 hours ago
Can ONDO Price Hit $2 or $5?
-
 Market23 hours ago
Can Long-Term Holders Support Price?
-
 Altcoin23 hours ago
Cardano Price Targets $0.83 Rally Amid ADA ETF Buzz, What’s Next?
-

 Altcoin10 hours ago
BTC Jumps To $97K, ETH Gains 6%, & CAKE Soars 59%
-
 Market22 hours ago
US Inflation Spurs Bitcoin ETF Outflows, Ethereum ETFs Persist
-

 Ethereum10 hours ago
Ethereum Whales Have Bought Over 600,000 ETH In The Past Week – Time For A Price Upswing?
-
 Market21 hours ago
BTC Price Struggles Under $100,000 Amid Weak Whale Buying