
Altcoin
Dogecoin Mirrors Ethereum As Social Sentiment Tanks, Is A Price Crash Brewing?

Dogecoin currently boasts a bearish outlook, having dropped below the $0.30 psychological level and is now at risk of losing the $0.20 level. This bearish outlook is further strengthened by a drop in DOGE’s social sentiment, mirroring Ethereum, which has also suffered significant price crashes.
Dogecoin Mirrors Ethereum As Social Sentiment Tanks
In an X post, on-chain analytics platform Santiment revealed that Dogecoin is mirroring Ethereum as social sentiment on these coins is “nearly non-existent.” This means that there has been a lack of significant social media interest in Dogecoin and Ethereum, with investors choosing to discuss other coins over them.
In this regard, Santiment revealed that Bitcoin is leading the way in cryptocurrency discussions on these social media platforms. Meanwhile, Cardano has also witnessed a massive rise compared to usual. On the other hand, Dogecoin and Ethereum are both basically non-existent in these crypto discussions.

This development provides a bearish outlook for Dogecoin and hints that a further price decline may be on the horizon. It is worth mentioning that the foremost meme coin has been one of the coins that has taken the most hit during the market downtrend, losing the $0.3 psychological level. This indicates that the negative social sentiment has also translated to a lack of buyers in the DOGE ecosystem to help defend certain support levels.
Besides the crash in social sentiment, on-chain metrics also paint a bearish picture for Dogecoin and hint at a price crash that could be brewing. IntoTheBlock data shows that there has been a dropping in ‘Hodlers Balance.’ These are investors who have held the meme coin for a year more. As such, long-term holders look to be losing their confidence in Dogecoin, which could spark a wave of sell-offs and lead to a massive crash for the foremost meme coin.
DOGE Is Still In An ‘Overall’ Bull Market
Despite the recent downtrend for Dogecoin, crypto analyst KrissPax has assured market participants that the foremost meme coin is still in an overall bull market. He noted that every falling wedge over the past year and a half has led to an upward trend breakout for DOGE. As such, despite the recent pullback due to inflation, fewer rate cuts, and Trump’s tariffs, the crypto analyst is confident that Dogecoin will eventually turn around and go higher.
Crypto analyst Trader Tardigrade also provided a bullish outlook for DOGE, stating that a price surge is imminent. He remarked that DOGE’s bullish falling wedge was nearing a breakout. The crypto analyst added that the meme coin often forms large falling wedge before it pumps. His accompanying chart showed that DOGE could finally pump to the much-anticipated $1 level when it breaks out to the upside.
At the time of writing, the Dogecoin price is trading at around $0.25, down almost 5% in the last 24 hours, according to data from CoinMarketCap.
Featured image from Adobe Stock, chart from Tradingview.com


Solana price could be heading toward a major drop, according to crypto analyst Ali. In a recent analysis, Ali suggested that SOL might be retesting the breakout zone from a right-angled ascending broadening pattern.
Analysis Points to Downside Potential For Solana Price
Ali’s SOL analysis expects the price to drop to $65. This bearishness comes after a period of price weakness for Solana. SOL’s price fell by 1.2% in the last 24 hours, according to recent figures.
For all we know, #Solana $SOL might be retesting the breakout zone from a right-angled ascending broadening pattern, with the $65 target still in play. pic.twitter.com/vujFJQWurz
— Ali (@ali_charts) April 16, 2025
The prediction arrives at a time for the Solana network when Canada will launch Solana ETFs today after regulatory approval by the Ontario Securities Commission (OSC).
Ali’s technical analysis focuses on a right-angled broadening ascending pattern that has appeared on Solana’s price chart. SOL, according to the analyst, is re-testing the breakout pattern area, and this could be an indication of more downside action if the level fails to act as support.
This bearish outlook is shared by some other analysts in the crypto space. SatoshiOwl noted that Solana is not looking good and that it is breaking down from trendline on 1h. However, the analyst cautioned that confirmation was still needed from 1-hour and 4-hour candle closings. The analyst suggested that Solana might retest $120 first before possibly moving higher.
Not all analysts share this bearish view, however. Trader David identified what he described as bullish signs for SOL as this channel continues to move upward. He pointed out that after a 33% correction, Solana is now on a strong support level. He expressed hope that the token will reach new heights again.
Bullish signs for $SOL as this channel continues to move upward.
Hopefully we will see Solana on heights again. After 33% correction it is now on a strong support level.#Crypto #CryptoEducation pic.twitter.com/Pvj6RAC0WS
— David (@David_W_Watt) April 16, 2025
Canadian ETF Launch Could Provide Institutional Access
Despite the bearish technical outlook from some analysts, Solana is experiencing a potentially positive development on the institutional front. The Ontario Securities Commission (OSC) has approved multiple ETF issuers to list Solana-based products in Canada, including Purpose, Evolve, CI, and 3iQ.
This regulatory clearance sets the stage for Solana ETFs to come to market. This may make the cryptocurrency available to a new generation of institutional investors who would rather have regulated investment products rather than direct exposure to cryptocurrency. The timing of this news is interesting, as it is happening during technical uncertainty in the price action of Solana.
Bloomberg ETF analyst Eric Balchunas provided some background on the upcoming launches. He clarified that Canada is preparing spot Solana ETFs to launch this week after the regulator waved the green flag to multiple issuers. He added that the ETFs will also offer staking through TD.
But the initial market reaction to this news has been muted, with the Solana price showing little positive momentum in response to the much-awaited launch of the ETF. CoinGape has also released an extensive Solana prediction for April 2025.
Vignesh Karunanidhi
Vignesh Karunanidhi is a seasoned crypto journalist with nearly 7 years of experience in the cryptocurrency industry. He has contributed to numerous publications, including WatcherGuru, BeInCrypto, Milkroad, and authored over 10,000 articles
Disclaimer: The presented content may include the personal opinion of the author and is subject to market condition. Do your market research before investing in cryptocurrencies. The author or the publication does not hold any responsibility for your personal financial loss.

The Mantra (OM) token price has surged after founder JP Mullin announced plans for a massive token burn. Mullin clarified that he intends to burn his personal team token allocation and implement a “comprehensive burn program for other parts of the OM supply.”
OM Pumps After Founder’s Burn Announcement
The OM token, which had experienced a major price drop over recent weeks, jumped from a low of $0.5115 to as high as $0.8706 following Mullin’s statement on X.
This announcement comes as OM has seen price drops of 87.0% over the past week. CoinGape has released a Mantra OM price prediction for April 2025, which could give you an idea of how the token can perform this month.
Mantra has initially shelved 300 million OM tokens for its team and core contributors. This accounts for 16.88% of the token’s nearly 1.78 billion total supply. These tokens are currently locked and were scheduled for a phased release between April 2027 and October 2029.
To be 100% clear, I am stating that I am burning MY team tokens, and we will create a comprehensive burn program for other parts of the OM supply. https://t.co/Yy6GzRBbM8
— JP Mullin (🕉, 🏘️) (@jp_mullin888) April 16, 2025
The planned burn could possibly take out a huge quantity of these tokens from the market for good. A decentralized vote could decide if all 300 million team token issuance needs to be burnt, as proposed by Mullin.
The announcement has been followed by various reactions from the Mantra community. Some members of the community believed that Mullin’s commitment was a positive development for token valuation, while others were concerned about having long-term issues.
Crypto Banter founder Ran Neuner warned against the move: “Burning the incentive may seem like a good gesture but it will hurt the team motivation long term.”
Mantra Refutes Allegations Following Price Collapse
Mullin’s token burn announcement comes at a difficult time for the project. The company has vehemently denied reports that it holds 90% of OM token supply. It has also rejected allegations of market manipulation and insider trading submitted by some community members.
Mantra explained that the latest price drop of OM occurred due to “reckless liquidations” and not due to anything the team had done. The recent history of the token indicates the size of this drop, with the charts reflecting a nearly 90% decline in value over the past month.
Major cryptocurrency exchanges OKX and Binance both experienced major OM trading activity immediately before the token’s collapse. However, both platforms have denied any wrongdoing in relation to the price crash. Binance mentioned that the crash was mainly due to cross-exchange liquidations.
They attributed the collapse to tokenomics adjustments that were made during October 2024 and abnormal market volatility that ultimately led to high-volume cross-exchange liquidations on April 13.
Vignesh Karunanidhi
Vignesh Karunanidhi is a seasoned crypto journalist with nearly 7 years of experience in the cryptocurrency industry. He has contributed to numerous publications, including WatcherGuru, BeInCrypto, Milkroad, and authored over 10,000 articles
Disclaimer: The presented content may include the personal opinion of the author and is subject to market condition. Do your market research before investing in cryptocurrencies. The author or the publication does not hold any responsibility for your personal financial loss.

Crypto Market Update: The digital assets continue to bleed as the US President Donald Trump slapped up to 245% tariff on Chinese goods. The intensifying trade war and macroeconomic concerns have continued to weigh on the investors’ sentiment, wiping off the previous gains from the digital assets space. Bitcoin price today slipped more than 2% while ETH, XRP, SOL, DOGE, and Cardano prices fell between 4% and 7%.
Crypto Market Update: Trump’s 245% Tariff On China Sparks Concerns
The crypto market slipped today after US President Donald Trump escalated the long-standing trade war with China by imposing a fresh 245% tariff on a wide range of imports. According to a White House document released in the late US hours on Tuesday, the move targets critical minerals and related products, citing national security and economic resilience as key reasons.
Meanwhile, the fact sheet stated that China now faces tariffs of up to 245% following its “retaliatory actions” and lack of cooperation. However, this is not the first volley in the tariff saga, as it continued to dampen the crypto market sentiment over the past few weeks.
Trump’s Tariff On China
For context, it began with a 20% levy, followed by a 34% hike on April 2nd. As tensions grew, Trump raised the rate again, reaching 104%. In response, China imposed an 84% tariff on the US goods.
Trump responded by increasing the US tariff to 125%. However, it has excluded certain tech products from China, which has boosted market sentiment. However, just last week, China matched that level, lifting its tariffs to 125%. The situation escalated dramatically this week with the 245% blanket tariff.
The White House cited the need to protect America’s defense sector, tech advancement, and infrastructure. As per Reuters, China exports over $400 billion worth of goods to the U.S. annually — far more than any other country. The impact of this aggressive move is now spilling over into the financial sector, including the crypto market.
How Crypto Prices Are Performing?
The global crypto market cap lost more than 2.3% from yesterday to $2.63 trillion while its one-day volume fell 6% to $73.89 billion. Besides, the fear and greed index showed a reading of 29, indicating a “Fear” momentum hovering in the market.
Notably, BTC price today fell nearly more than 2.5% to $83,368.76, while ETH price fell about 5% to $1,566. On the other hand, XRP price today was down nearly 4% to $2.04 and SOL price slipped more than 3% to $124.89.
Simultaneously, Cardano price today slipped nearly 7% to $0.6032. In the meme coins segment, DOGE price was down around 5% to $0.1528 and SHIB’s value lost around 3% to $0.00001160.
Bitcoin Whale Continues To Dump Amid Crypto Market Woes
The recent slump in BTC price also comes as Bitcoin whales appear to be losing confidence in the asset’s potential amid an intensifying trade war. Besides, speculations are also high that the whales are booking profit, reflecting a waning risk bet appetite of the investors. The US vs China tensions amid Trump’s tariff policies have weighed on the investors’ sentiment, causing a massive selloff in the market.
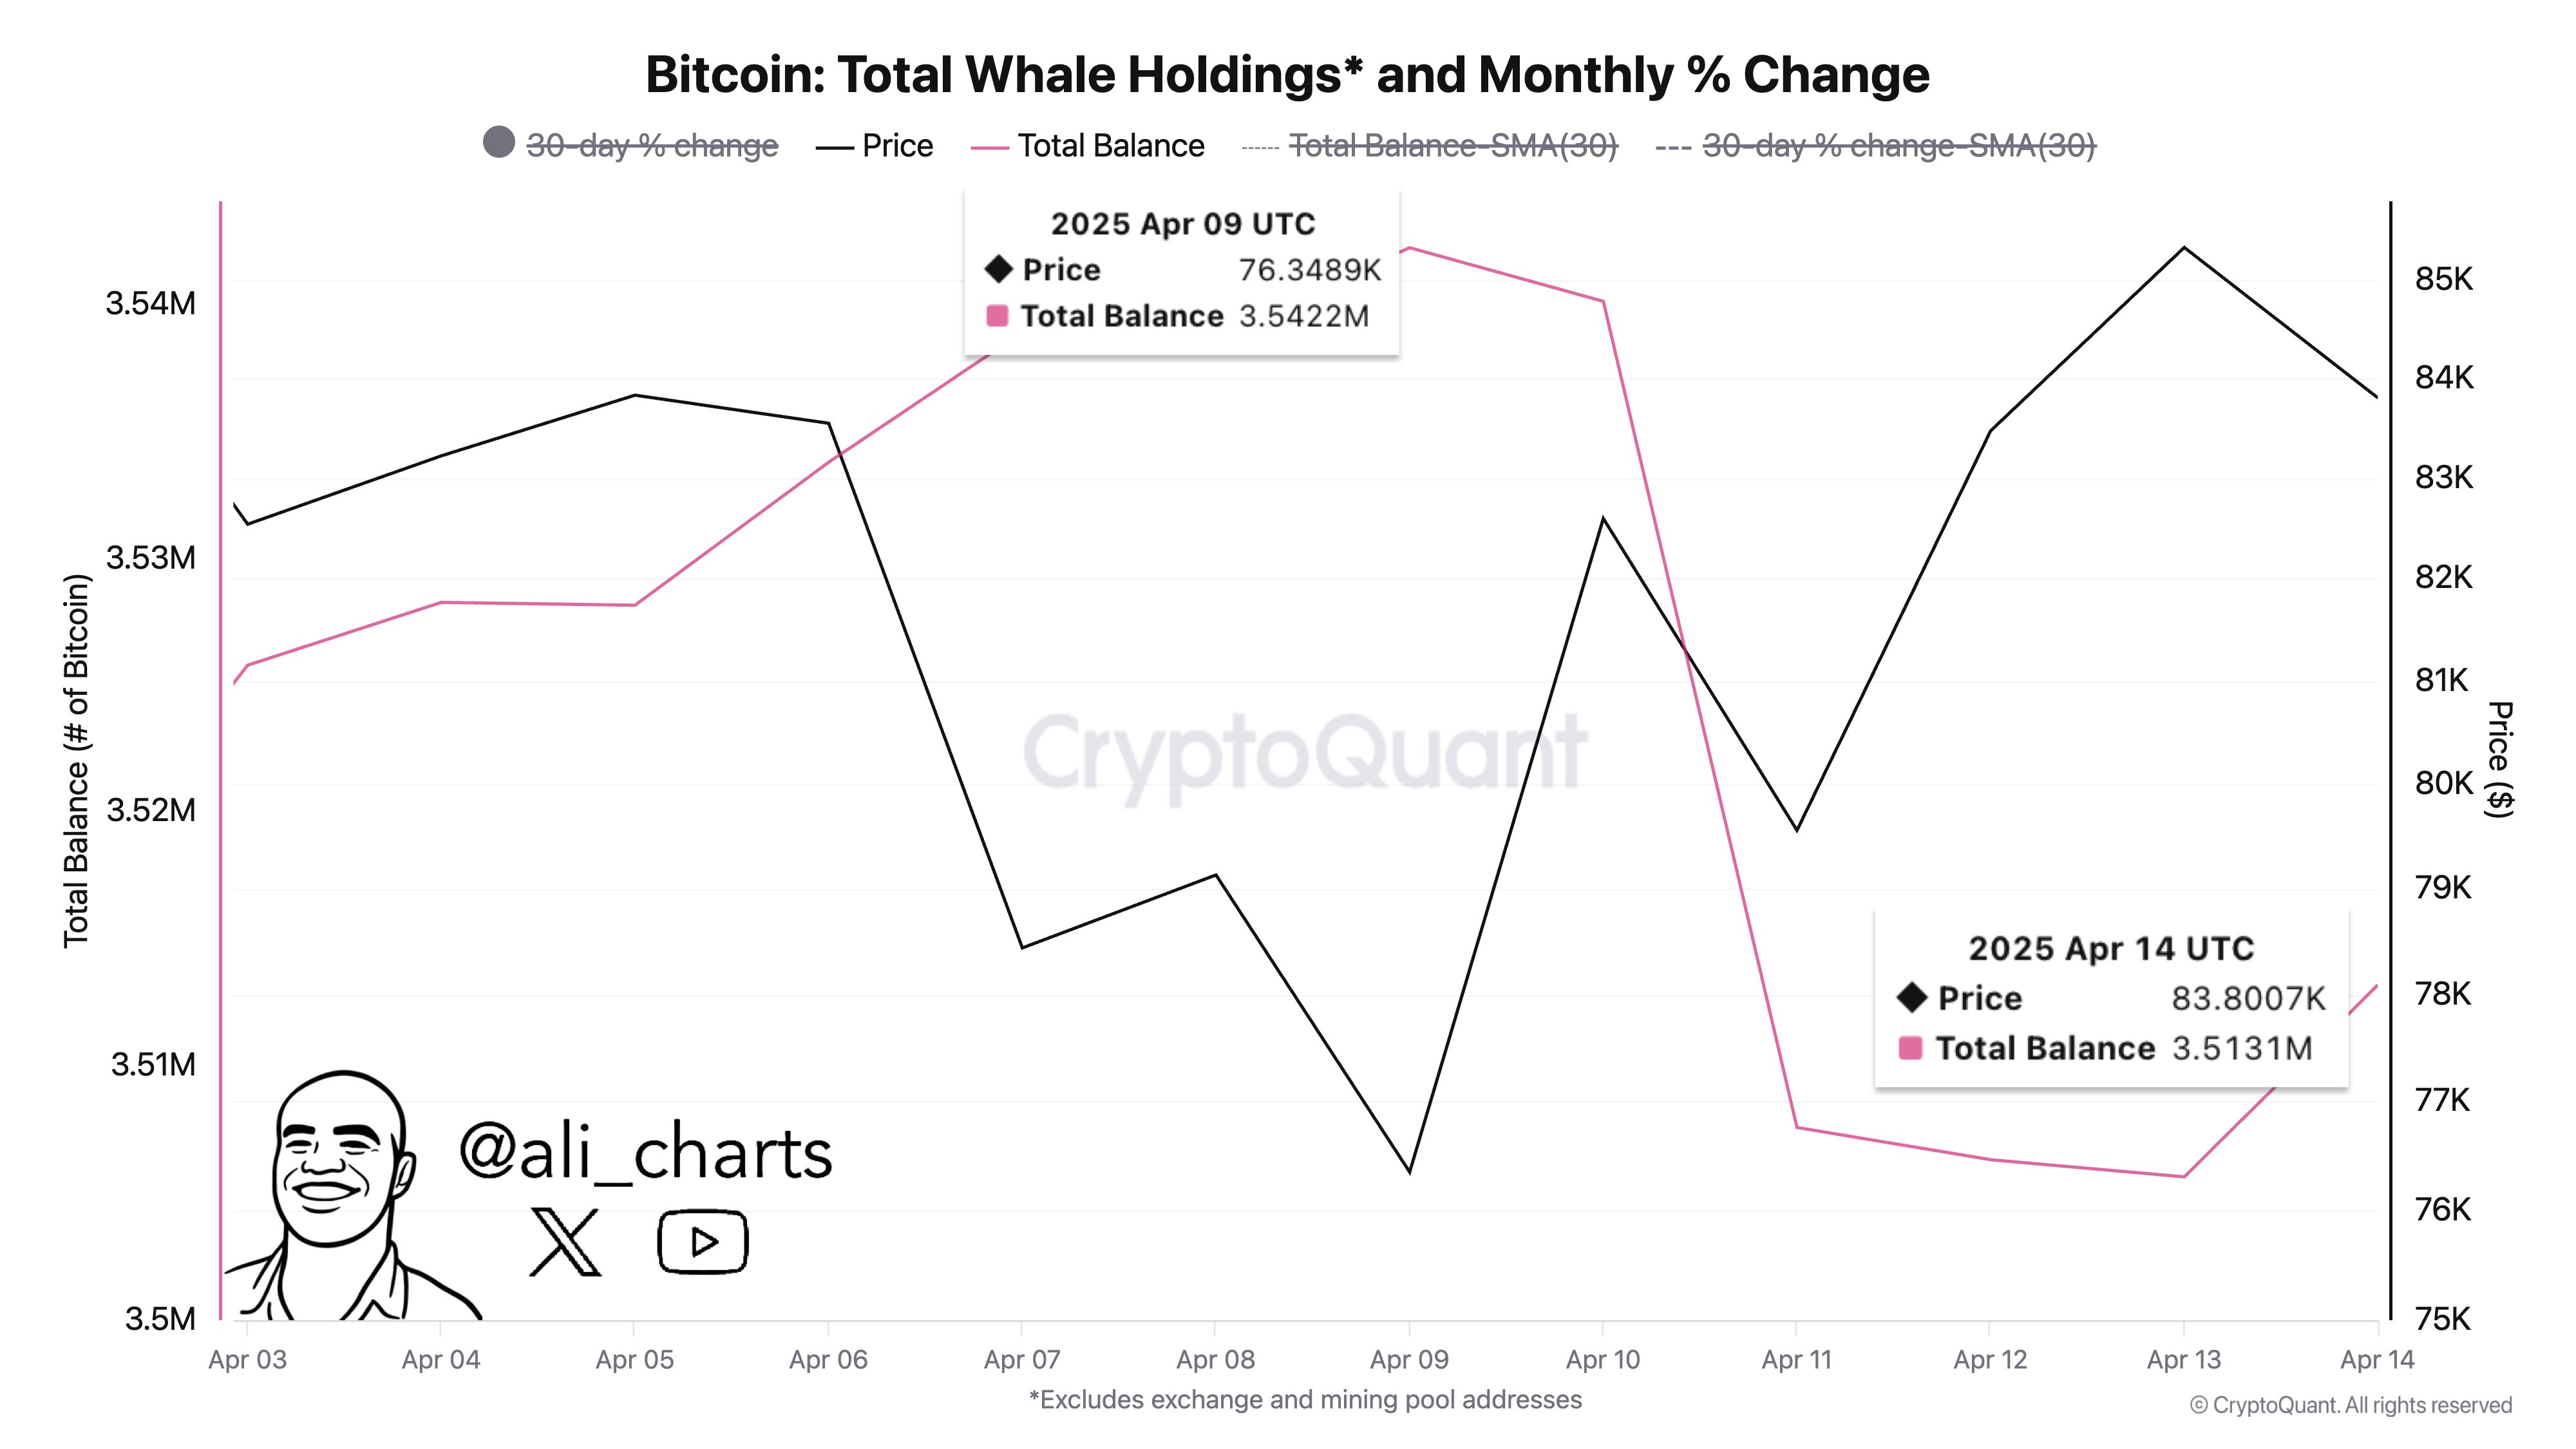
For context, renowned analyst Ali Martinez recently highlighted the selling trend. In a recent X post, Martinez said “Whales have been taking profits during the recent rally.” According to him, the whales have offloaded more than 29,000 BTC from April 9.
Rupam Roy
Rupam is a seasoned professional with three years of experience in the financial market, where he has developed a reputation as a meticulous research analyst and insightful journalist. He thrives on exploring the dynamic nuances of the financial landscape. Currently serving as a sub-editor at Coingape, Rupam’s expertise extends beyond conventional boundaries. His role involves breaking stories, analyzing AI-related developments, providing real-time updates on the crypto market, and presenting insightful economic news.
Rupam’s career is characterized by a deep passion for unraveling the complexities of finance and delivering impactful stories that resonate with a diverse audience.
Disclaimer: The presented content may include the personal opinion of the author and is subject to market condition. Do your market research before investing in cryptocurrencies. The author or the publication does not hold any responsibility for your personal financial loss.

Raydium’s New Token Launchpad Competes with Pump.fun
Analyst Reveals Why The Solana Price Can Still Drop To $65

How It’s Impacting the Network

DWF Invests $25 Million in Trump’s World Liberty Financial
Are TRUMP Meme Coin Investors Selling Before Friday’s Unlock?
Mantra (OM) Price Pumps As Founder Reveals Massive Token Burn Plan

2.52 Million Altcoins Are Ruining Crypto’s Future

Animoca Brands Valuation Tanks 75% In Two Years, Here’s Why

Crypto exchange BingX hacked for $43 million

Are The Big Players Losing Interest?

Hong Kong’s Securities Association Tips Authorities On Crypto Self-Regulation

Coinbase cbBTC Set to go Live on Solana
2.52 Million Altcoins Are Ruining Crypto’s Future
Animoca Brands Valuation Tanks 75% In Two Years, Here’s Why
Crypto exchange BingX hacked for $43 million
Are The Big Players Losing Interest?
Hong Kong’s Securities Association Tips Authorities On Crypto Self-Regulation
Coinbase cbBTC Set to go Live on Solana
-

 Market23 hours ago
Bitcoin Eyes $90,000, But Key Resistance Levels Loom
-

 Ethereum20 hours ago
Ethereum Metrics Reveal Critical Support Level – Can Buyers Step In?
-

 Market19 hours ago
Solana (SOL) Jumps 20% as DEX Volume and Fees Soar
-

 Market18 hours ago
Hedera Under Pressure as Volume Drops, Death Cross Nears
-

 Bitcoin22 hours ago
Bitcoin Adoption Grows As Public Firms Raise Holdings In Q1
-

 Market17 hours ago
Ethena Labs Leaves EU Market Over MiCA Compliance
-

 Market16 hours ago
3 US Crypto Stocks to Watch Today: CORZ, MSTR, and COIN
-

 Market15 hours ago
Bitcoin Price on The Brink? Signs Point to Renewed Decline

✓ Share: