
Market
Shiba Inu (SHIB) Eyes Bitcoin for Potential Recovery

Shiba Inu has been stuck in a persistent downtrend, with recovery attempts consistently failing. The meme coin has struggled to break through key resistance levels, and investor sentiment remains lackluster due to ongoing losses.
With limited support from investors, SHIB now finds itself reliant on the performance of Bitcoin for any potential rebound.
Shiba Inu Investors Need Help
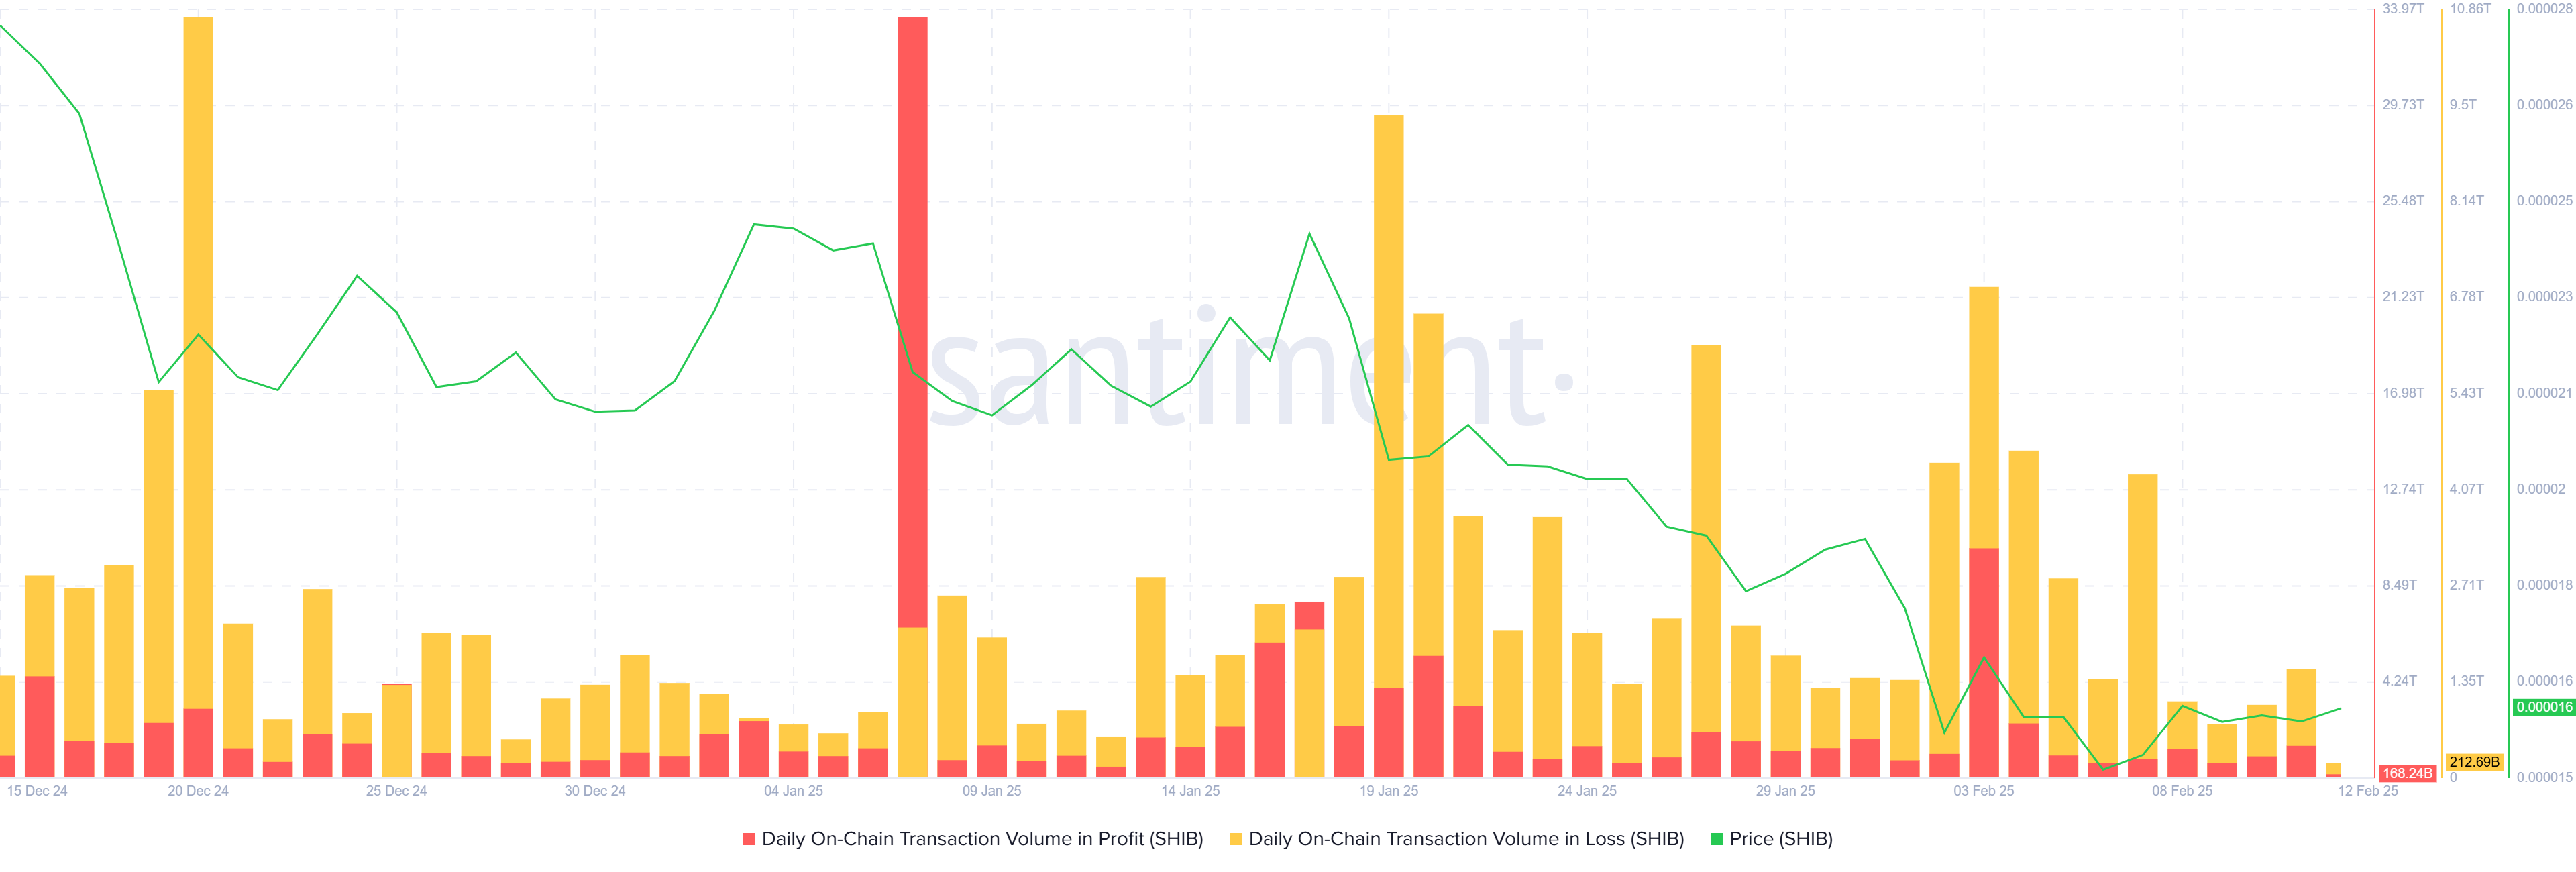
Over the past month and a half, losses in transactions have far outweighed those in profit for Shiba Inu. This reflects the ongoing bearish sentiment, as more investors are in a position of loss than profit. The dominance of losing transactions further dampens market confidence, leaving many hesitant to participate in network activities.
As a result of this bearish outlook, investor behavior has shifted, with many pulling back from conducting transactions on the network. This cautious approach results in lower trading volume, which puts additional pressure on SHIB’s price. Until the sentiment changes or market conditions improve, Shiba Inu is likely to continue facing downward pressure.
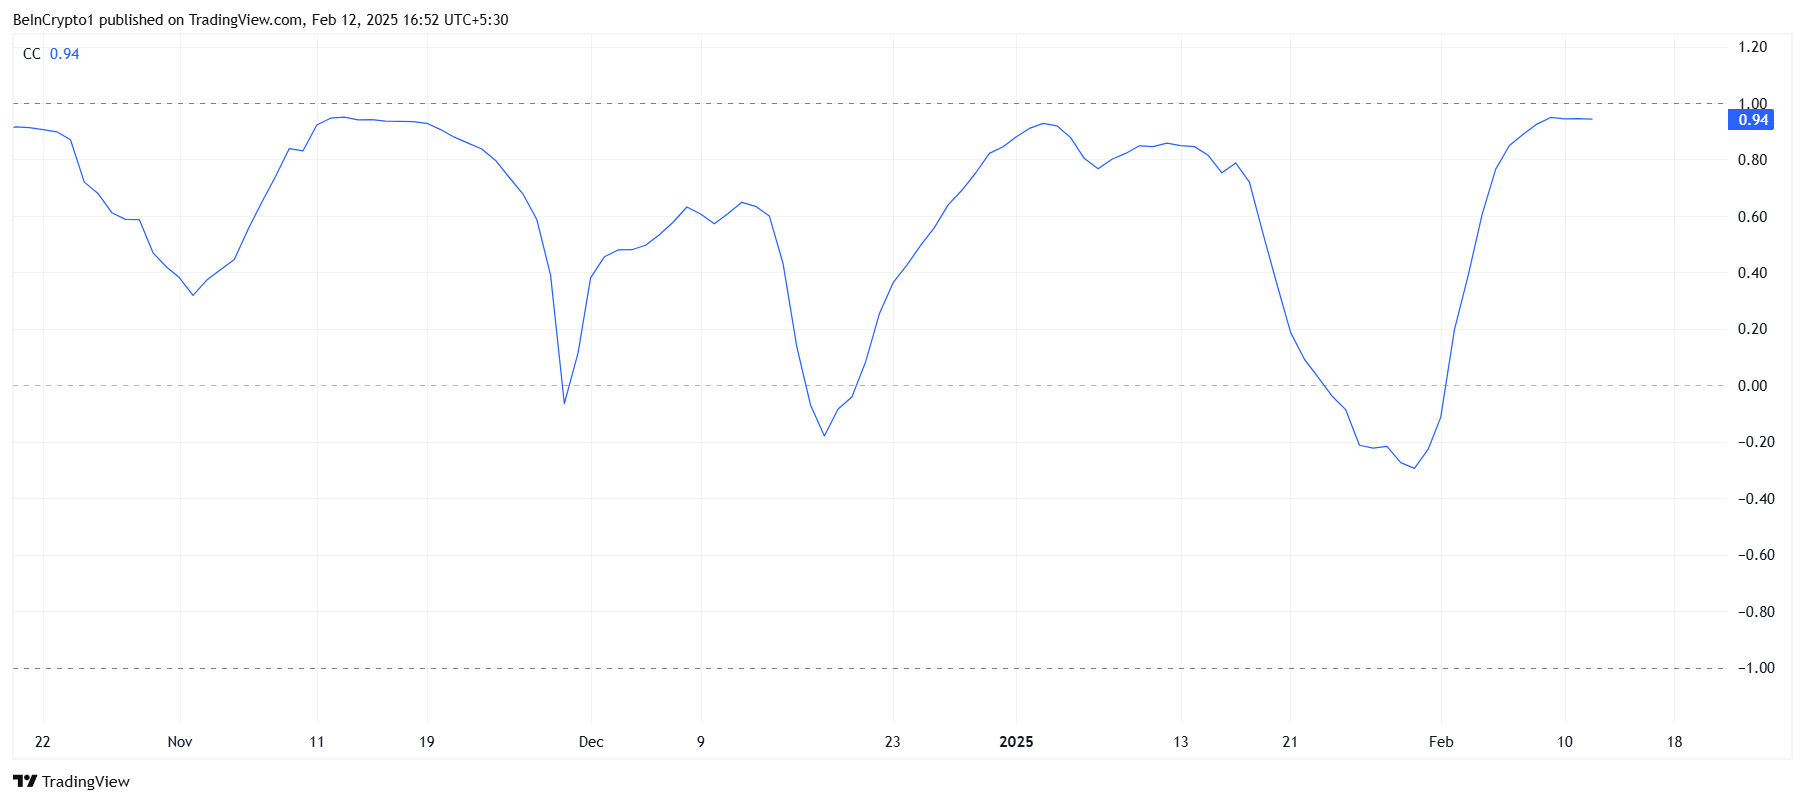
Shiba Inu shares a strong correlation with Bitcoin, with a 0.94 correlation coefficient. This suggests that SHIB could follow Bitcoin’s price movements, especially if Bitcoin continues to show strength. Should Bitcoin break the crucial $100,000 barrier, it could signal a period of growth for the broader crypto market, including Shiba Inu.
This close relationship with Bitcoin offers Shiba Inu a potential path to recovery. If Bitcoin rallies, it could provide the necessary momentum to lift SHIB from its downtrend. However, SHIB’s reliance on Bitcoin also means that its recovery is contingent on Bitcoin’s performance in the coming weeks.
SHIB Price Prediction: Stuck Within A Range
Shiba Inu is currently priced at $0.00001591, having been stuck under the $0.00001676 resistance for the past week. The coin has endured a month-long downtrend, pushing it to its current price level. Without a significant shift in market sentiment, SHIB is unlikely to breach this resistance in the short term.
If the bearish market conditions persist, Shiba Inu may continue to consolidate below the $0.00001676 resistance. However, holding above the $0.00001462 support level could provide SHIB with some stability, preventing further downside and allowing for a potential slow recovery if broader market conditions improve.
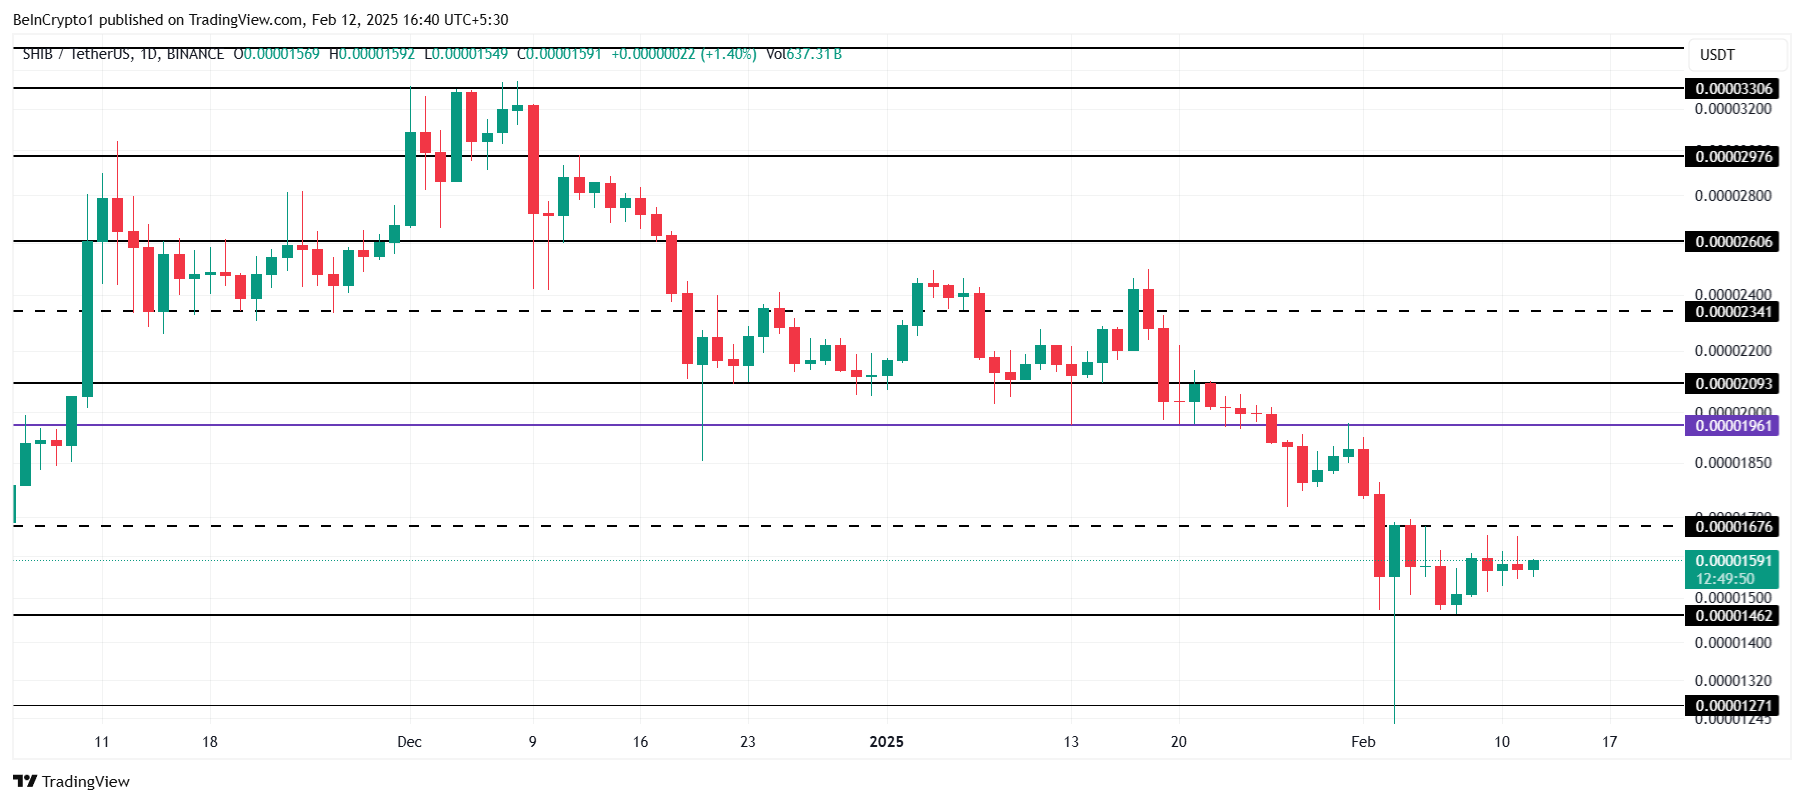
Should Bitcoin recover and pull Shiba Inu along with it, SHIB could breach the $0.00001676 resistance and rise toward $0.00002000. A successful push above this key level would open the door for further growth, potentially marking the start of a new bullish phase for the meme coin.
Disclaimer
In line with the Trust Project guidelines, this price analysis article is for informational purposes only and should not be considered financial or investment advice. BeInCrypto is committed to accurate, unbiased reporting, but market conditions are subject to change without notice. Always conduct your own research and consult with a professional before making any financial decisions. Please note that our Terms and Conditions, Privacy Policy, and Disclaimers have been updated.


Richard Kim, founder of Zero Edge, a defunct “crypto casino,” was arrested and subsequently released on bail in a federal securities fraud case. After an arrest on Tuesday, Kim posted a $250,000 bond using $100,000 in cash as collateral.
Before Zero Edge, Kim had an esteemed career at major institutes like JP Morgan and Goldman Sachs. The Southern District of New York (SDNY) is hearing this case.
How Richard Kim’s Crypto Casino Collapsed
Before everything fell apart, Richard Kim was ostensibly a successful crypto entrepreneur. A former executive at Galaxy Digital, an attorney, and an elite trader, he left in March 2024 to found Zero Edge.
This “crypto casino” would bring classical gambling onto the blockchain, according to a recent court document:
“In particular, Kim represented to prospective investors that Zero Edge would ‘develop a number of onchain games,’ beginning with craps, and operate both a ‘free to play / social casino version of the game’ in which players could win virtual currency, as well as a real money version of the game. KIM wrote that he would serve as the ‘chief architect’ of the company,” it read.
Kim leveraged his former connections, including those at Galaxy, to raise over $7 million in seed funding. However, Kim’s casino never opened.
According to his public statements, Kim initially lost $80,000 to a phishing scam and blew through $3.8 million by chasing losses in “high-risk leveraged crypto trades.” This happened within a week of his initial funding round.
From there, he misled investors for months before finally coming clean last June, describing himself as a gambling addict. Several of the casino’s investors, including Galaxy, filed complaints that progressed to federal charges this week.
The FBI arrested Kim on charges of wire fraud and securities fraud, and he is being tried in the Southern District of New York (SDNY).
In the grand scheme of things, Kim’s aborted attempt to open a digital casino is on the smaller end of crypto crimes. Nonetheless, it’s important that the federal government actually seeks to prosecute him.
For example, the Department of Justice recently shut down its Crypto Enforcement Team and stopped investigating tumblers and exchanges. “Crime is legal now” is a growing refrain in the community, as regulators are halting all enforcement.
Even the SDNY, which is handling Kim’s casino case, claimed it would end crypto prosecutions.
This may be a small win for justice, but fresh crypto cases are being tried. Kim is currently out on bail, but he still faces repercussions for his failed casino. Whatever happens, its results will be an important data point for US crypto enforcement.
Disclaimer
In adherence to the Trust Project guidelines, BeInCrypto is committed to unbiased, transparent reporting. This news article aims to provide accurate, timely information. However, readers are advised to verify facts independently and consult with a professional before making any decisions based on this content. Please note that our Terms and Conditions, Privacy Policy, and Disclaimers have been updated.

Reason to trust
![]()
Strict editorial policy that focuses on accuracy, relevance, and impartiality
Created by industry experts and meticulously reviewed
The highest standards in reporting and publishing
Strict editorial policy that focuses on accuracy, relevance, and impartiality
Morbi pretium leo et nisl aliquam mollis. Quisque arcu lorem, ultricies quis pellentesque nec, ullamcorper eu odio.
XRP is making headlines this month as whale activity surges across the network. In a surprising twist, reports indicate that XRP whales have dumped more than $700 million worth of tokens just this April. This sudden shift in whale behavior raises the question of what these big players are really up to.
XRP Whales Offload 370 Million Tokens In April
On April 15, prominent crypto analyst Ali Martínez reported on X (formerly Twitter) that XRP whales have begun dumping the popular cryptocurrency in large volumes. Following a period of substantial token accumulation, these large-scale investors have sold over 370 million XRP since the beginning of April.
Related Reading
Notably, this massive whale sell-off amounts to over $700 million, triggering a wave of speculation about the intentions behind this move. More interestingly, the XRP dumps appear to align with recent price fluctuations, as whales tend to heavily influence market dynamics, especially during a downturn.
The Santiment chart provided by Martinez reveals a clear trend, from April 3 to 14, 2025, that XRP wallets holding between 100 million to 1 billion tokens have drastically reduced their holdings. As this large-scale whale dumping progressed, the XRP price dropped to new lows around April 8 and then began a steady climb, reaching $2.1 at the time of writing.

While the reason behind such large-scale exits is unclear, a few plausible explanations exist. Whales might be capitalizing on earlier price gains to lock in profits while the market conditions for XRP remain relatively stable. These investors could also be responding to heightened market volatility, pushing them to shift their holdings into alternative assets to hedge risks and safeguard against losses.
Another possibility is that these big players are selling tokens between wallets or transferring them to exchanges in anticipation of a significant event — perhaps the final legal decision between Ripple and the United States Securities and Exchange Commission (SEC). In less optimistic scenarios, such coordinated whale activity, which tends to influence prices, may be indicative of market manipulation, often aimed at achieving strategic gains.
Although it’s uncertain whether the above motives are driving recent whale dumps, one thing is clear: large-scale XRP movements always warrant close attention. With XRP now hovering around $2, the market waits to see just how these sell-offs will influence the future price of the cryptocurrency.
Update On Latest XRP Price Action
According to crypto analyst Andrew Griffiths, the current XRP price analysis indicates a notably bullish trend. This momentum emerged after the cryptocurrency surpassed two key resistance levels and established a solid support level, signaling a potential upward movement.
Related Reading
As a result, the analyst predicts that XRP could record a massive gain of over 20% in the coming weeks. With the token currently trading at $2.10, a 20% increase would bring it to approximately $2.589. Based on the upward trajectory within the Ascending Channel seen on the price chart, the analyst predicts that XRP could climb as high as $3.3.
Featured image from Pixabay, chart from Tradingview.com

XRP’s price has faced a struggle to recover in recent weeks, with broader market conditions remaining bearish. Despite these challenges, XRP has managed to hold steady above the $2 mark.
This stability is largely driven by long-term holders (LTHs), who are working to prevent the price from falling below this key level.
XRP Investors Capitalize On Low Prices
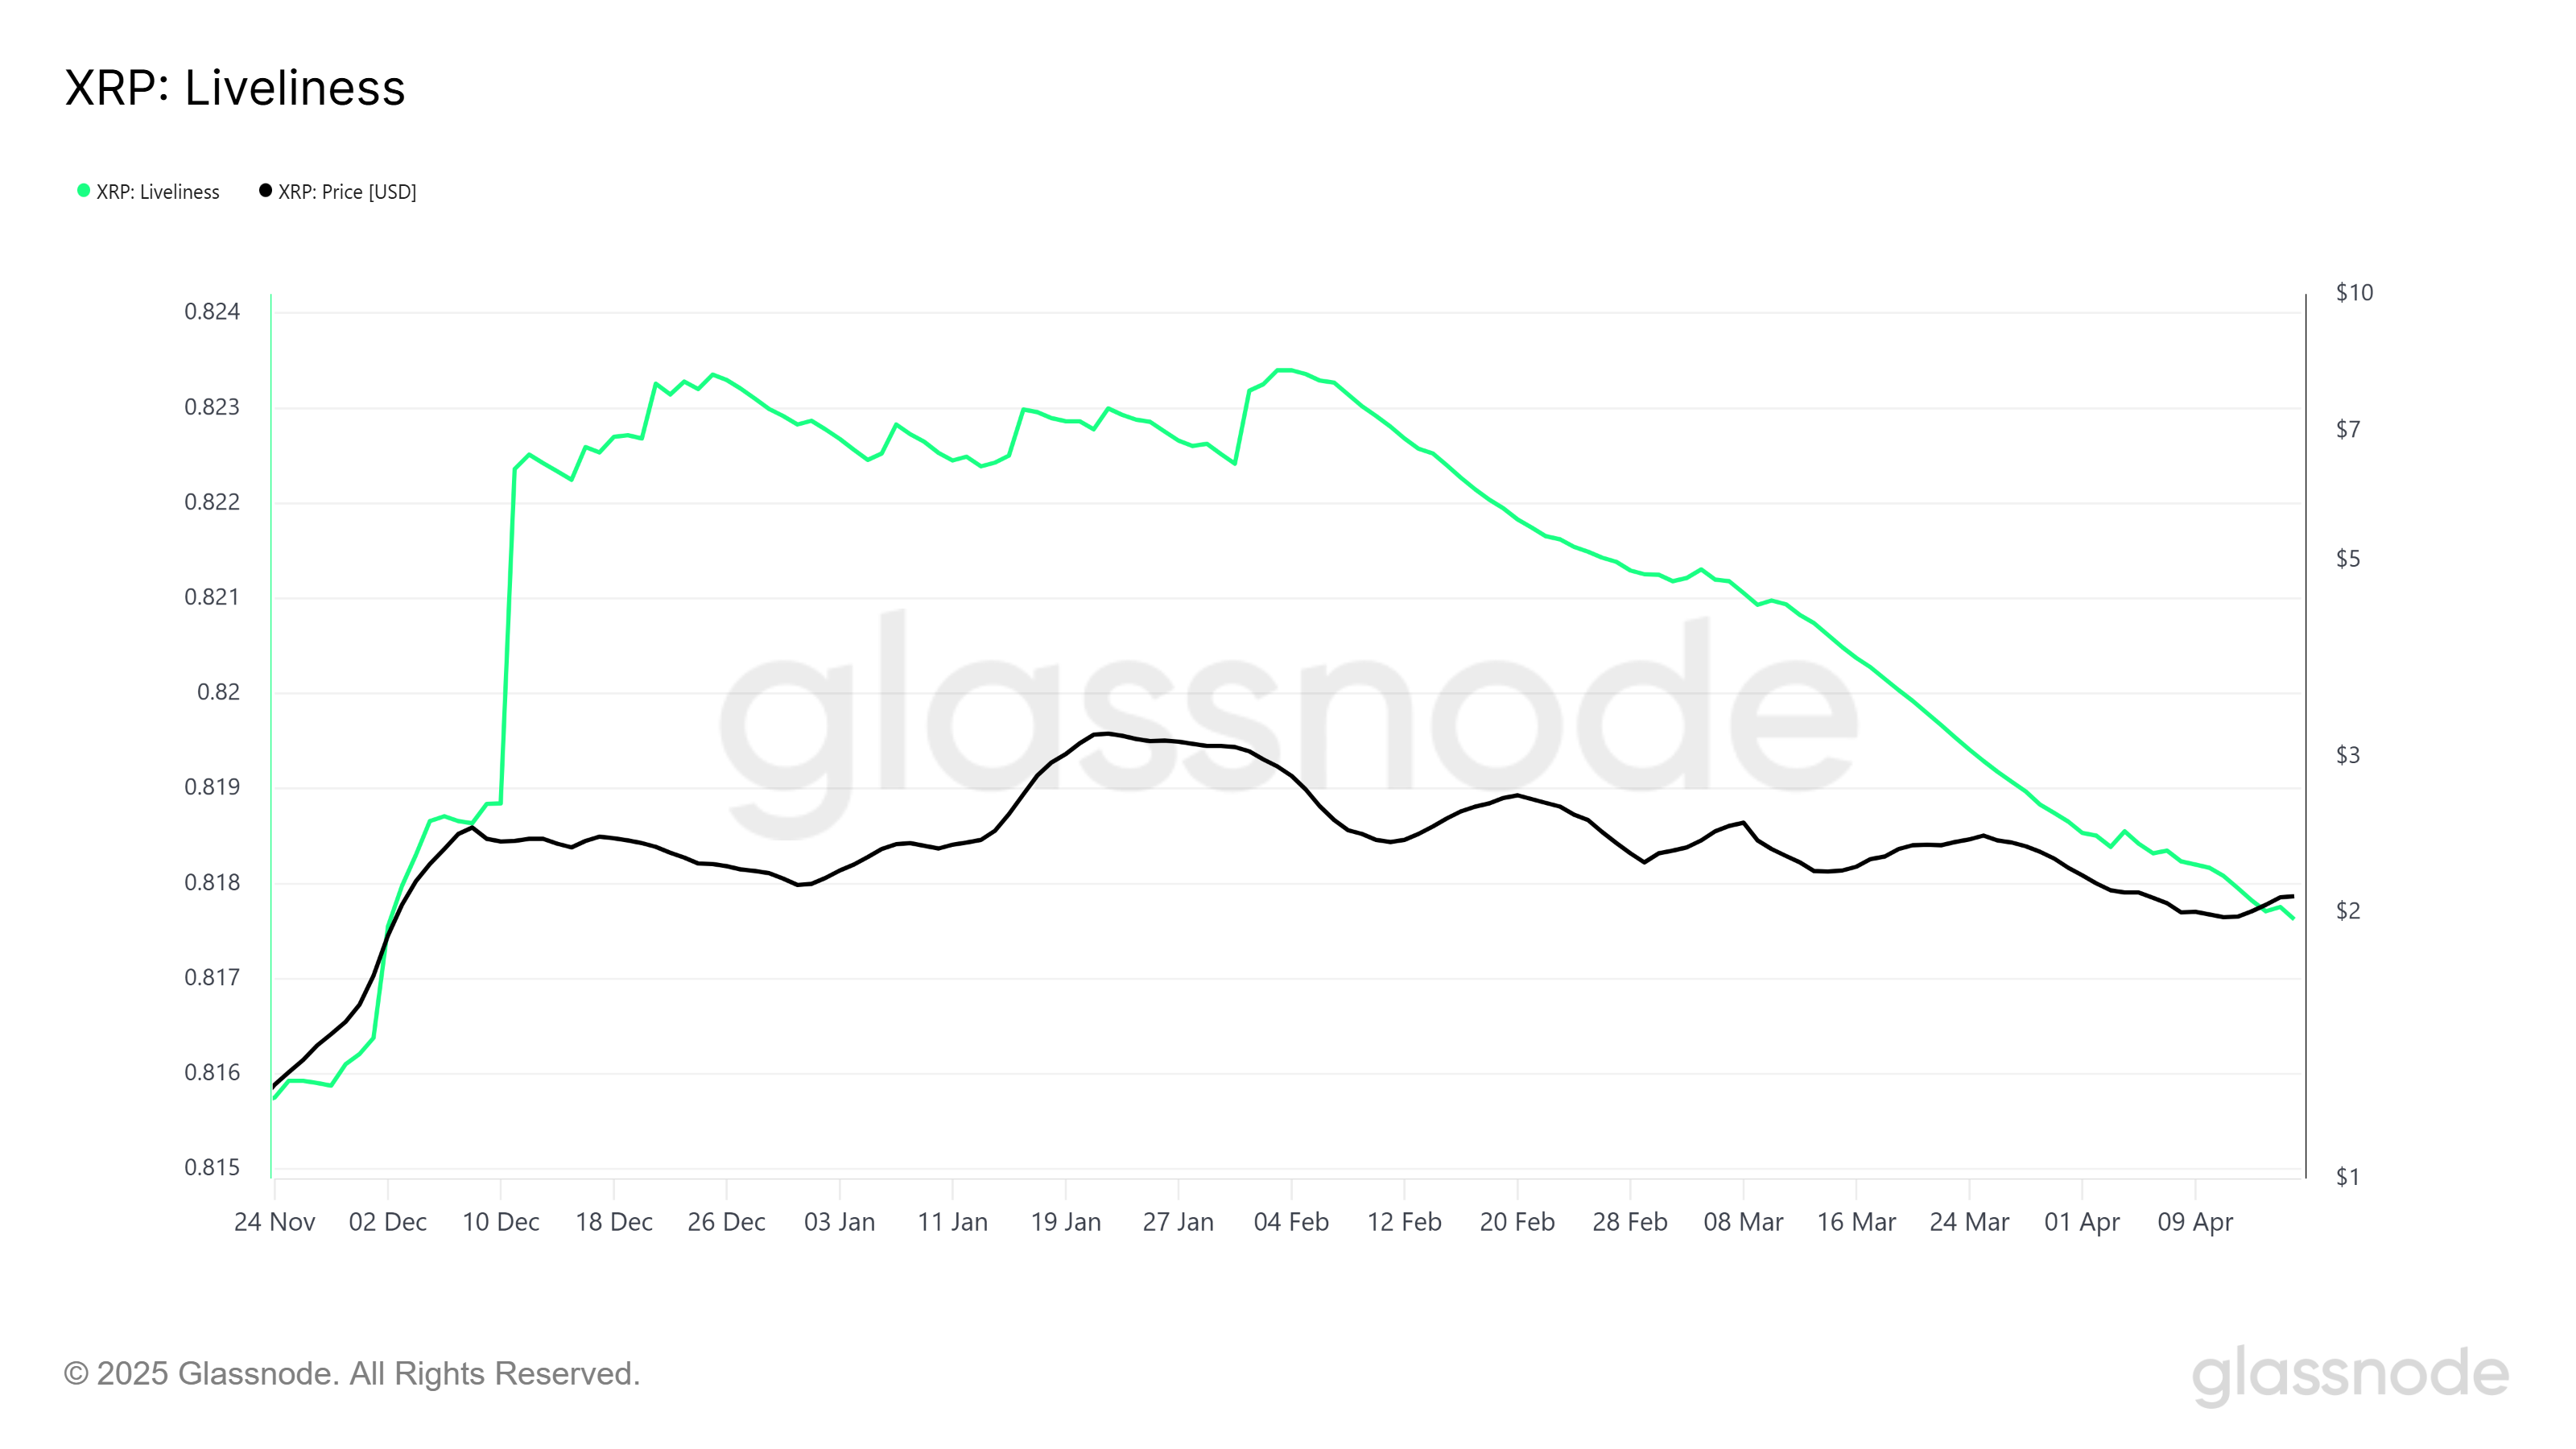
The Liveliness metric, which tracks the frequency of transactions, has been on a steady decline since February. This suggests that fewer tokens are changing hands, a sign that long-term holders are accumulating more XRP at lower prices.
This trend could be a positive indicator, showing that these investors believe in the future potential of XRP and are positioning themselves for long-term gains. Despite the accumulation of LTHs, market sentiment remains mixed due to the broader bearish environment.
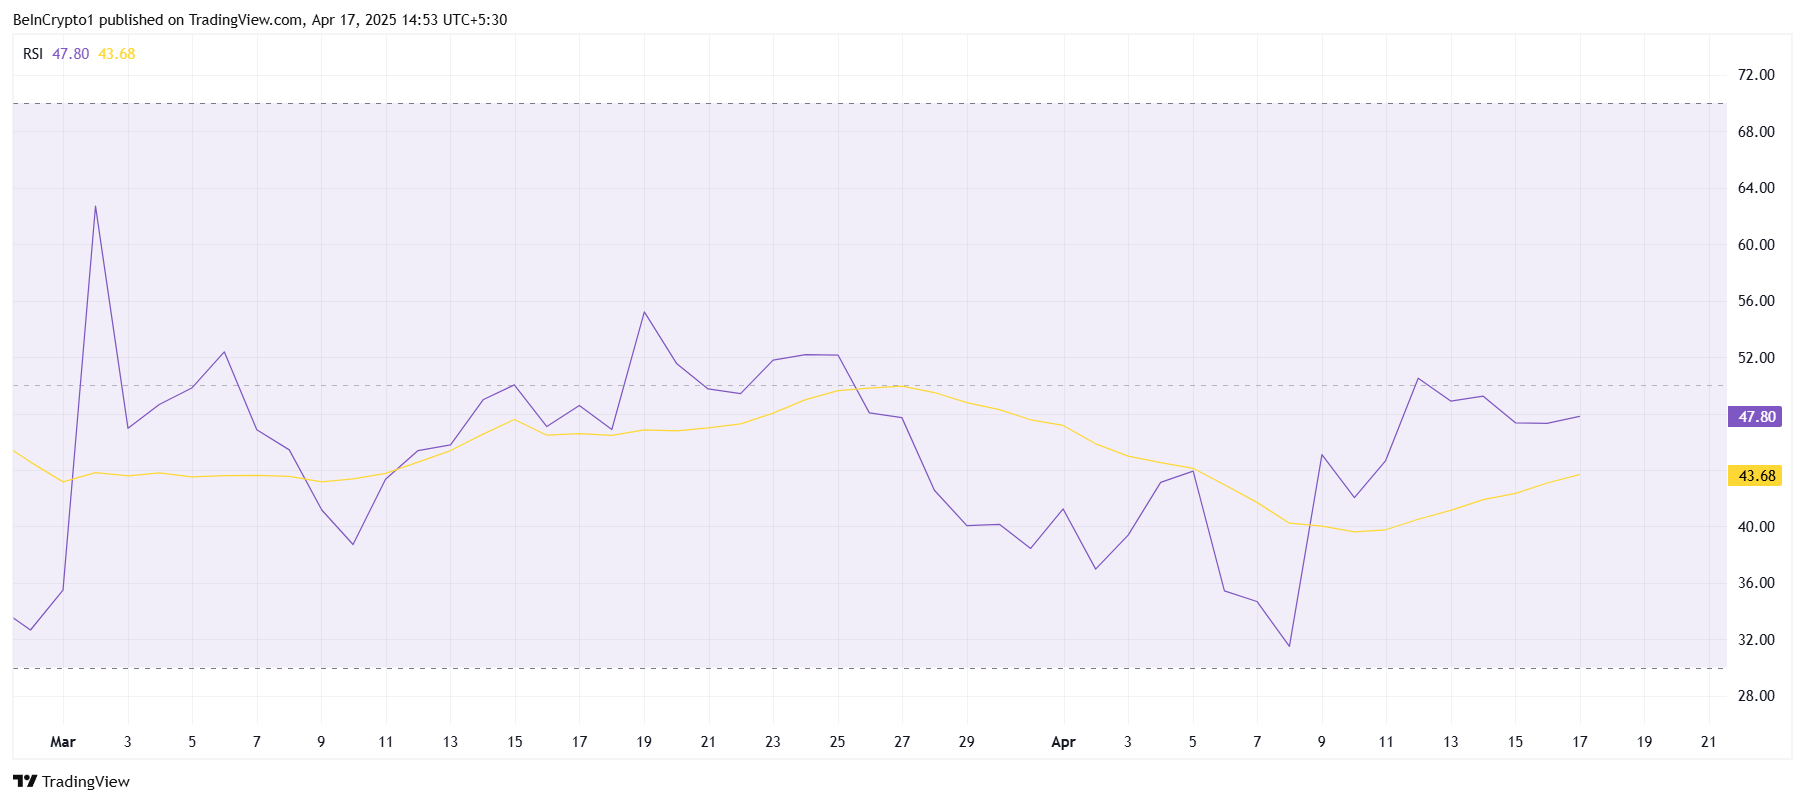
From a technical perspective, the Relative Strength Index (RSI) for XRP has been stuck in the bearish zone for the past two months. While it has occasionally spiked above the neutral line at 50, it has largely remained below, signaling a lack of bullish momentum. This persistent bearish trend has countered the efforts of long-term holders to push the price up.
The RSI’s failure to maintain upward momentum suggests that XRP is still struggling to gain traction. This is exacerbated by the overall bearish market conditions, which have kept investor sentiment subdued.
XRP Price Is Holding
At the time of writing, XRP is trading at $2.08, holding above the support level of $2.02. This indicates that the altcoin is stabilizing despite the recent dip. The support from long-term holders appears to be keeping the price afloat, preventing a further decline.
However, the mixed signals from both technical indicators and market sentiment suggest that XRP is likely to hover under the $2.16 resistance until stronger bullish cues emerge. This range-bound price action could persist, leaving investors uncertain about the next major move.
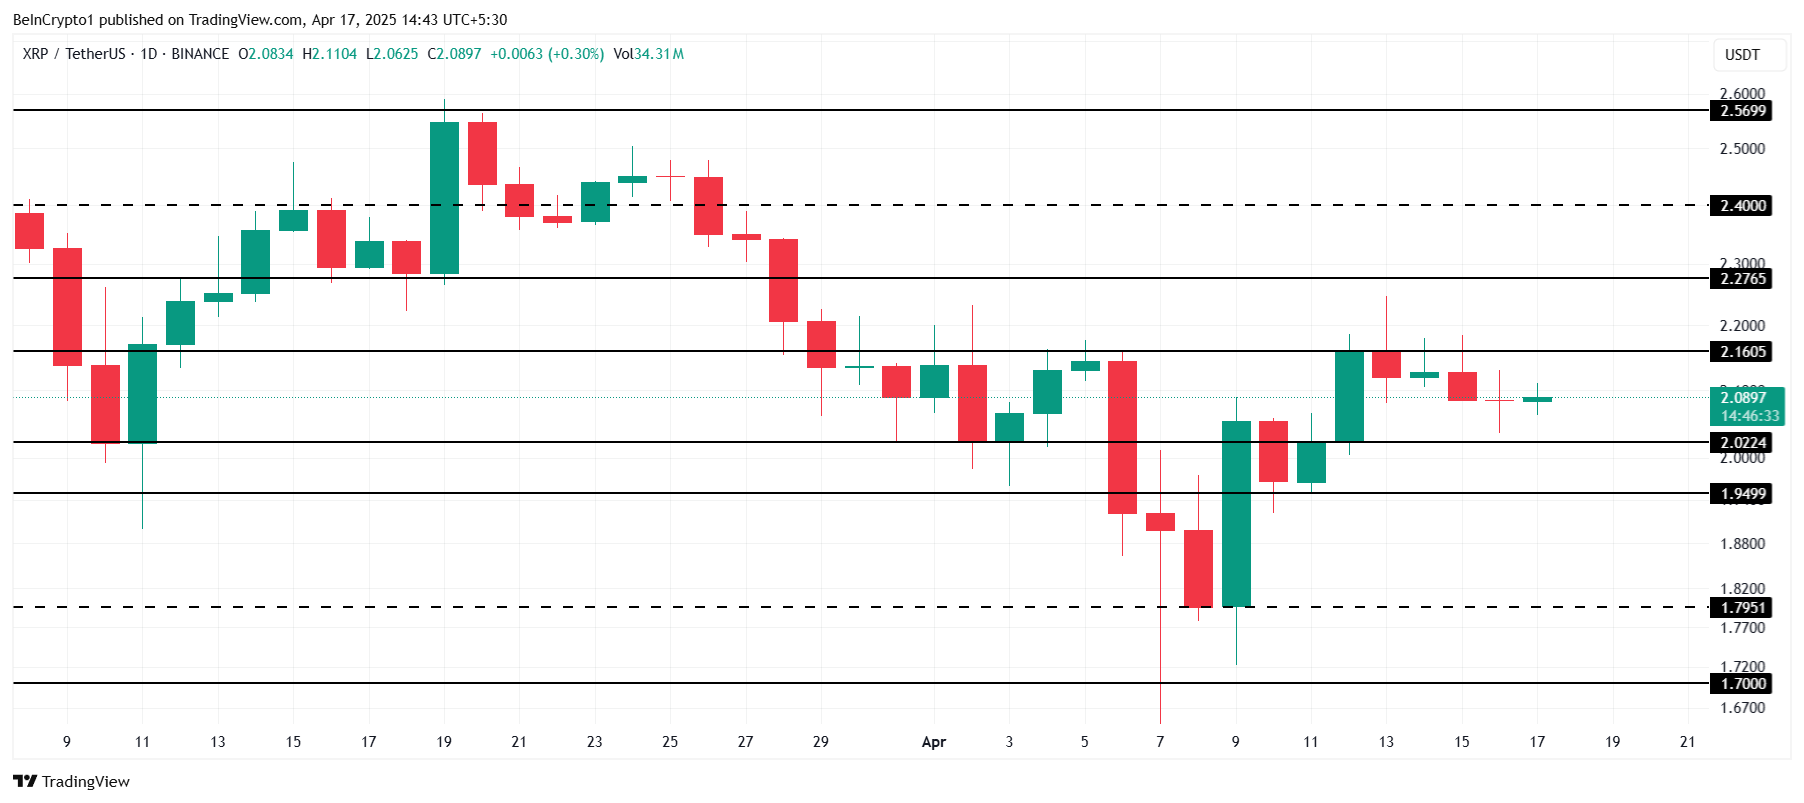
If XRP fails to hold the $2.02 support, the altcoin could fall to $1.94, or potentially even as low as $1.79. A drop below these levels would invalidate the current bullish outlook and could extend the losses for investors, signaling further market weakness.
Disclaimer
In line with the Trust Project guidelines, this price analysis article is for informational purposes only and should not be considered financial or investment advice. BeInCrypto is committed to accurate, unbiased reporting, but market conditions are subject to change without notice. Always conduct your own research and consult with a professional before making any financial decisions. Please note that our Terms and Conditions, Privacy Policy, and Disclaimers have been updated.
Crypto Casino Founder Charged With Fraud in New York

CZ Honors Nearly $1 Billion Token Burn Promise

Over $700 Million In XRP Moved In April, What Are Crypto Whales Up To?

Coinbase Reveals Efforts To Make Its Solana Infrastructure Faster, Here’s All

XRP Price Finds Stability Above $2 As Opposing Forces Collide
Analyst Claims Pi Network’s Momentum Is Building Fast As Pi Coin Looks To Reclaim $1

2.52 Million Altcoins Are Ruining Crypto’s Future

Animoca Brands Valuation Tanks 75% In Two Years, Here’s Why

Crypto exchange BingX hacked for $43 million

Are The Big Players Losing Interest?

Hong Kong’s Securities Association Tips Authorities On Crypto Self-Regulation

Coinbase cbBTC Set to go Live on Solana
2.52 Million Altcoins Are Ruining Crypto’s Future
Animoca Brands Valuation Tanks 75% In Two Years, Here’s Why
Crypto exchange BingX hacked for $43 million
Are The Big Players Losing Interest?
Hong Kong’s Securities Association Tips Authorities On Crypto Self-Regulation
Coinbase cbBTC Set to go Live on Solana
-

 Market24 hours ago
Pi Network Drops10% as Outflows Surge, Death Cross Looms
-
 Altcoin24 hours ago
DOGE Whale Moves 478M Coins As Analyst Predicts Dogecoin Price Breakout “Within Hours”
-

 Market22 hours ago
Bitcoin and Ethereum Now Accepted by Panama City Government
-
 Ethereum21 hours ago
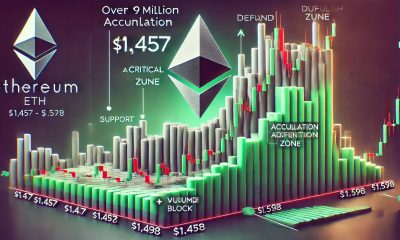
Over 1.9M Ethereum Positioned Between $1,457 And $1,598 – Can Bulls Hold Support?
-

 Market19 hours ago
Crypto Market Lost $633 Billion in Q1 2025, CoinGecko Finds
-
 Market23 hours ago
Ripple and the SEC Receive 60-Day Pause to Reach Settlement
-
 Bitcoin20 hours ago
ETF Issuers Bring Stability to Bitcoin Despite Tariff Chaos
-

 Market20 hours ago
Base Meme Coin Wipes $15 Million After Official Promotion
