
Market
PinLink (PIN) Price Jumps 15%, Nears $90 Million Market Cap

PinLink (PIN) price has been gaining momentum, surging 15% in the last 24 hours as it nears a $90 million market cap. Technical indicators show mixed signals, with the RSI cooling down from near-overbought levels while the ADX suggests the uptrend is still strong but possibly stabilizing.
A recent golden cross in the EMA lines indicates that if bullish momentum continues, PIN could test resistance at $1.17 and potentially push toward $1.41 or even $2 if AI, DePIN, and RWA narratives regain traction. However, if the uptrend loses strength, PIN could retest support at $0.70, with a deeper correction down to $0.51 still on the table.
PinLink RSI Is Still Neutral After Almost Touching Overbought Zone
PinLink defines itself as the first RWA-tokenized DePIN marketplace. It aims to reduce costs for artificial intelligence developers while enabling new revenue streams for DePIN asset owners.
By integrating real-world assets (RWA) with decentralized physical infrastructure networks (DePIN), PinLink aims to provide an efficient marketplace for developers to access AI-related resources at lower costs.
At the same time, asset owners can monetize their infrastructure, creating a more decentralized and cost-effective ecosystem.
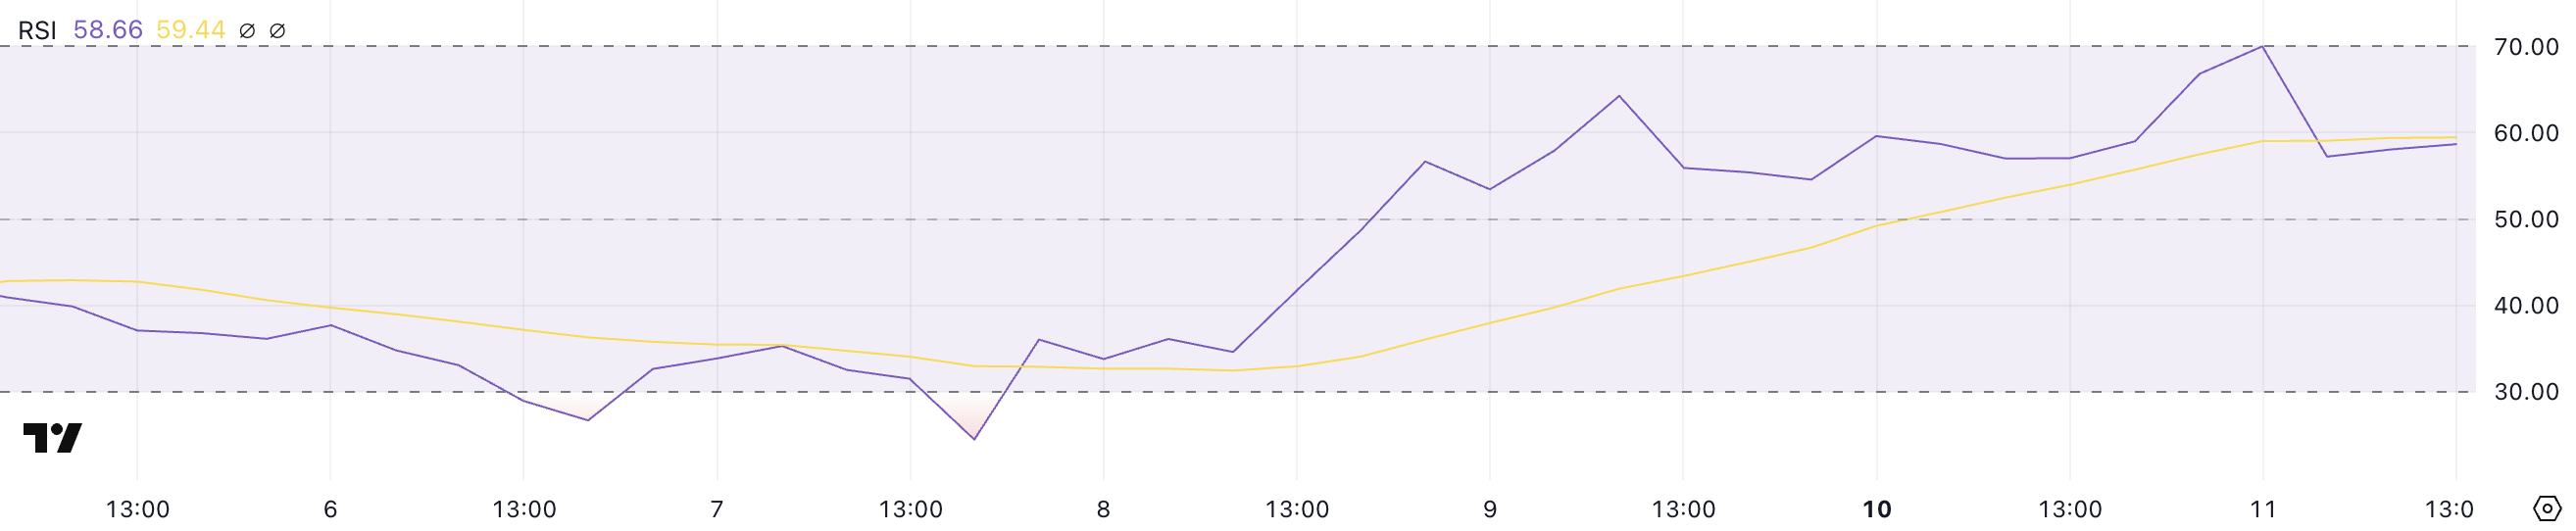
Currently, PIN’s RSI is at 58.6 after briefly touching 69.98 a few hours ago, surging from just 24.4 four days ago. The Relative Strength Index (RSI) is a momentum indicator that measures whether an asset is overbought or oversold, ranging from 0 to 100.
Readings above 70 suggest overbought conditions and a potential pullback, while values below 30 indicate oversold conditions and the possibility of a rebound.
With PIN’s RSI rising sharply in a short period but now cooling down from overbought territory, it suggests that buying pressure has been strong but is now stabilizing.
If RSI continues to hold above 50, PIN could maintain bullish momentum, but if it declines further, it may indicate weakening demand, increasing the risk of a short-term correction.
PIN ADX Shows the Uptrend Is Still Strong, But Could be Easing
PinLink ADX is currently at 29.3, slightly down from 30.2 a few hours ago, after surging from 22.4 just three days ago. The Average Directional Index (ADX) is a key indicator used to measure the strength of a trend rather than its direction.
Readings above 25 typically indicate a strong trend, while values below 20 suggest weak or nonexistent trend momentum. A rising ADX signals that a trend – whether bullish or bearish – is gaining strength, while a declining ADX can indicate fading momentum or potential consolidation.
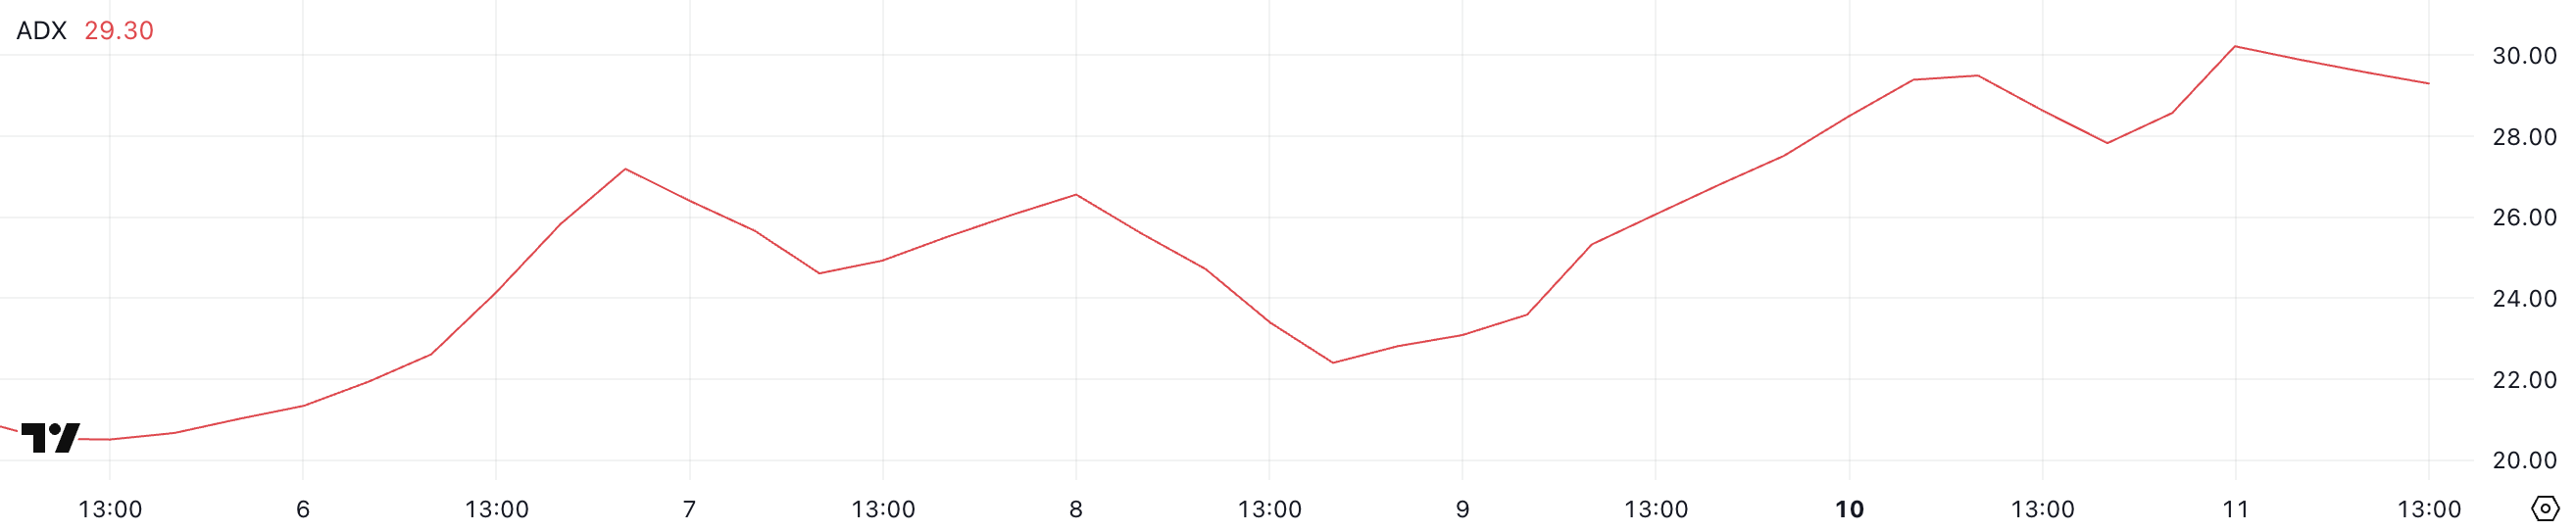
With PIN’s ADX currently at 29.3, the indicator suggests that the uptrend is still holding strength but may be slowing slightly. The recent increase from 22.4 confirms that PIN has been building a stronger trend over the past few days, reinforcing bullish momentum.
However, the small dip from 30.2 could indicate that trend strength is stabilizing rather than accelerating.
If ADX remains above 25 and continues rising, it would confirm that the altcoins’ uptrend is gaining traction, but if it starts dropping toward 20, it could signal that the bullish momentum is weakening, leaving room for potential consolidation or a shift in the market direction.
PIN Price Prediction: Can PinLink Reach $2 In February?
PinLink EMA lines indicate a bullish signal, as a short-term moving average has just crossed above another short-term line, forming a golden cross. If this uptrend remains strong, PIN, which is based on Ethereum, could test its next resistance at $1.17, and a breakout above this level could push the price toward $1.41.
Additionally, if narratives around AI, DePIN, and RWA regain momentum, PinLink could benefit from renewed market interest, potentially driving its price toward the $2 mark.
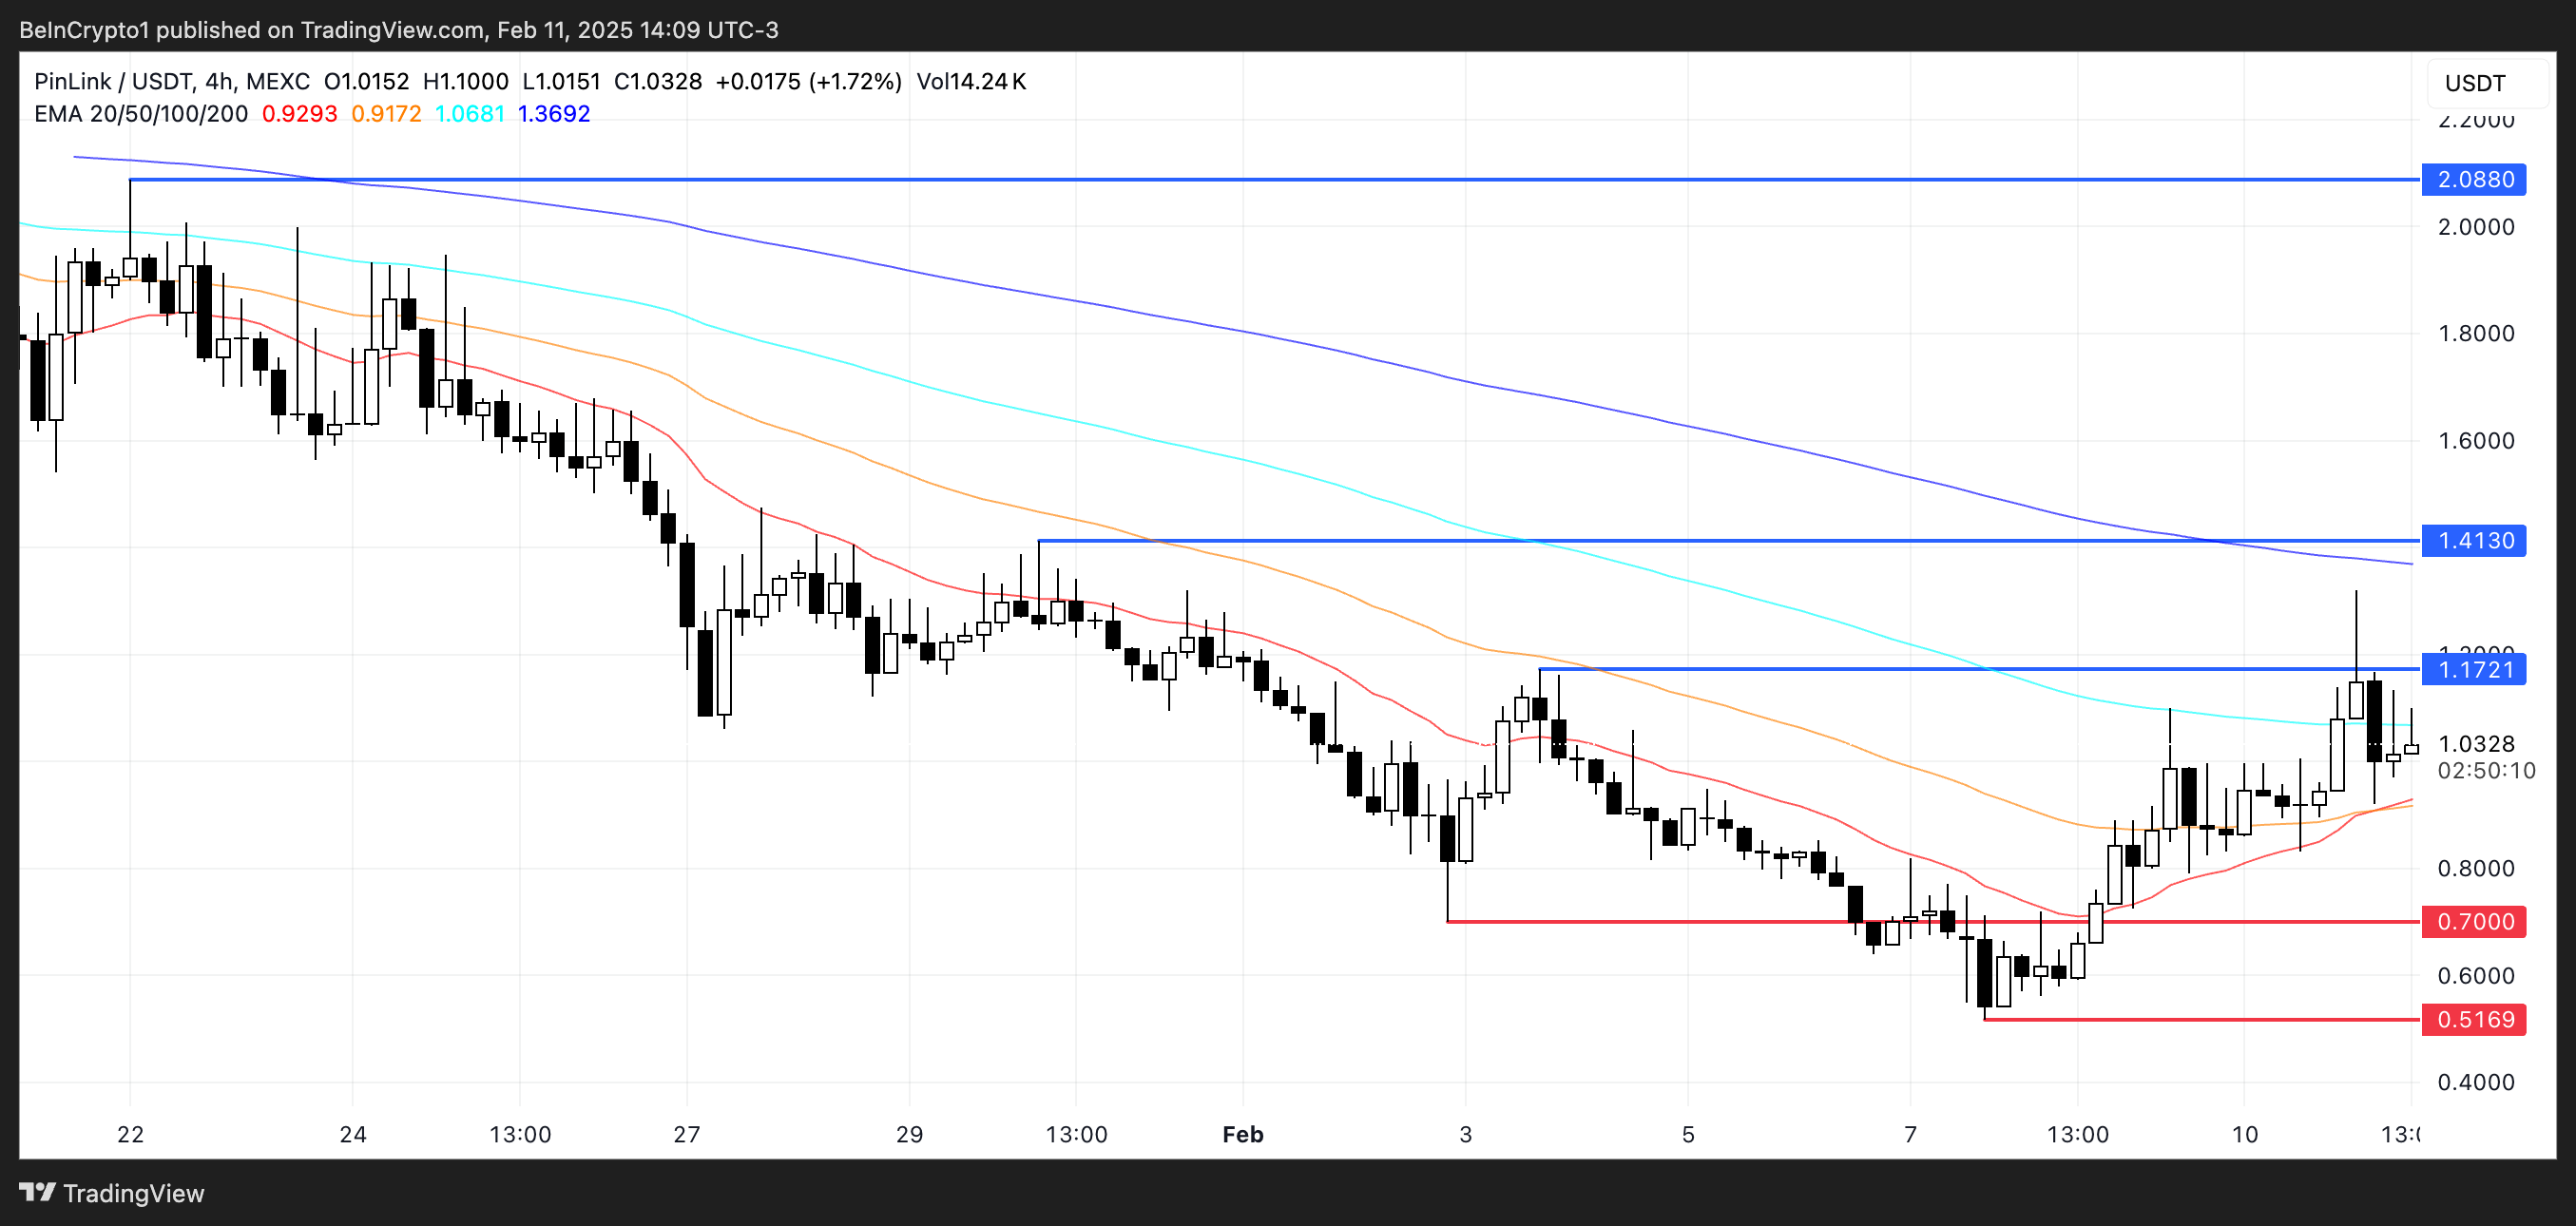
On the downside, if PIN fails to sustain its current bullish momentum and the trend reverses, it could face a retest of the $0.70 support level.
A break below this level could accelerate selling pressure, leading to a deeper decline toward $0.51 – a potential 50% correction from current levels.
Disclaimer
In line with the Trust Project guidelines, this price analysis article is for informational purposes only and should not be considered financial or investment advice. BeInCrypto is committed to accurate, unbiased reporting, but market conditions are subject to change without notice. Always conduct your own research and consult with a professional before making any financial decisions. Please note that our Terms and Conditions, Privacy Policy, and Disclaimers have been updated.


Raydium is releasing LaunchLab, a new token launchpad to compete with Pump.fun. The exchange announced this platform last month, and its full release has sparked community enthusiasm.
Pump.fun and Raydium have been locked in an intense competition in the Solana ecosystem. Last month, Pump.fun launched its own decentralized exchange, and now Raydium has introduced its own launchpad.
Raydium Increases Solana Dominance with new Launchpad
Raydium, Solana’s largest decentralized exchange, has the opportunity to make some serious gains in the near future. Solana meme coins are eyeing a comeback with heightened trade volumes and rising token prices, and the firm is releasing a long-awaited project.
Although it will compete with Pump.fun, Raydium’s launchpad services look more extensive. They will allow all kinds of tokens to be launched, not just meme coins, and these tokens can be directly traded on the exchange.
“Introducing LaunchLab, Raydium’s all-in-one token launchpad. Built for creators, developers, and the community. Get started with JustSendIt mode: launch a token, hit 85 SOL, [and] liquidity migrates to Raydium’s AMM INSTANTLY. Seamless, on-chain token creation. No migration fee. No gatekeepers,” the firm claimed in its launch announcement.
Pump.fun is the most popular meme coin launchpad on Solana, and its business has been intertwined with Raydium in a few ways. Since it launched Pumpswap, its own DEX, both exchanges have fueled a meme coin frenzy.
A month and a half ago, rumors that it was testing an AMM made Raydium’s RAY token drop significantly.
Last month, however, this same asset soared when Raydium first announced Launchpad. Pump.fun entered the DEX sector, and Raydium is enabling users to launch their own meme coins.
Since this launch announcement took place, RAY spiked around 10%, signifying the community’s enthusiasm.
There may be another explanation for this token rally in addition to community hype. Raydium also mentioned that all of Launchpad’s trading fees will go towards ecosystem development.
More specifically, 25% of these fees will directly fund buybacks of RAY tokens, while the other 75% go towards a Community Pool and Program fee.
These other funds can enable a few generous user incentives. Raydium claimed that Launchpad token creators can earn up to 10% of trading fees from the AMM pool post-graduation, and users can also receive SOL tokens from referring new clients. Token creators will also enjoy several other quality-of-life features.
Disclaimer
In adherence to the Trust Project guidelines, BeInCrypto is committed to unbiased, transparent reporting. This news article aims to provide accurate, timely information. However, readers are advised to verify facts independently and consult with a professional before making any decisions based on this content. Please note that our Terms and Conditions, Privacy Policy, and Disclaimers have been updated.
At the beginning of 2025, Layer-1 (L1) blockchain network Solana found itself in the spotlight, thanks to meme coins.
Donald Trump’s Official Trump (TRUMP) meme coin launch on January 17 ignited a flurry of activity across the network, driving demand to levels unseen since the 2021 bull cycle.
While these volatile assets boosted Solana’s network activity and pushed up SOL’s price, they also present a paradox. They have brought in liquidity, users, and attention—but at what cost?
Presidential Memes Pump Solana Into Overdrive
Solana’s cheap, lightning-fast transactions and highly composable DeFi infrastructure make it one of the most preferred blockchains for launching meme coins. So when newly elected Donald Trump launched his TRUMP meme coin on the network in January, it came as no surprise to many.
Following TRUMP’s launch on January 17, demand for Solana skyrocketed, driven on the one hand by developers eager to launch their own meme coins and on the other by the frenzy of trading activity surrounding them.
Melania Trump followed her husband’s lead by launching her MELANIA meme coin on the same chain two days later. This move exacerbated the meme hype and drove significant trade volumes across multiple meme coins, both existing and newly created.
For example, within a day of launch, MELANIA’s trading volume soared 396%, jumping from $1.33 billion to $6.6 billion, according to CoinGecko data.
Solana Memes Took It to the Moon, Then Back Down
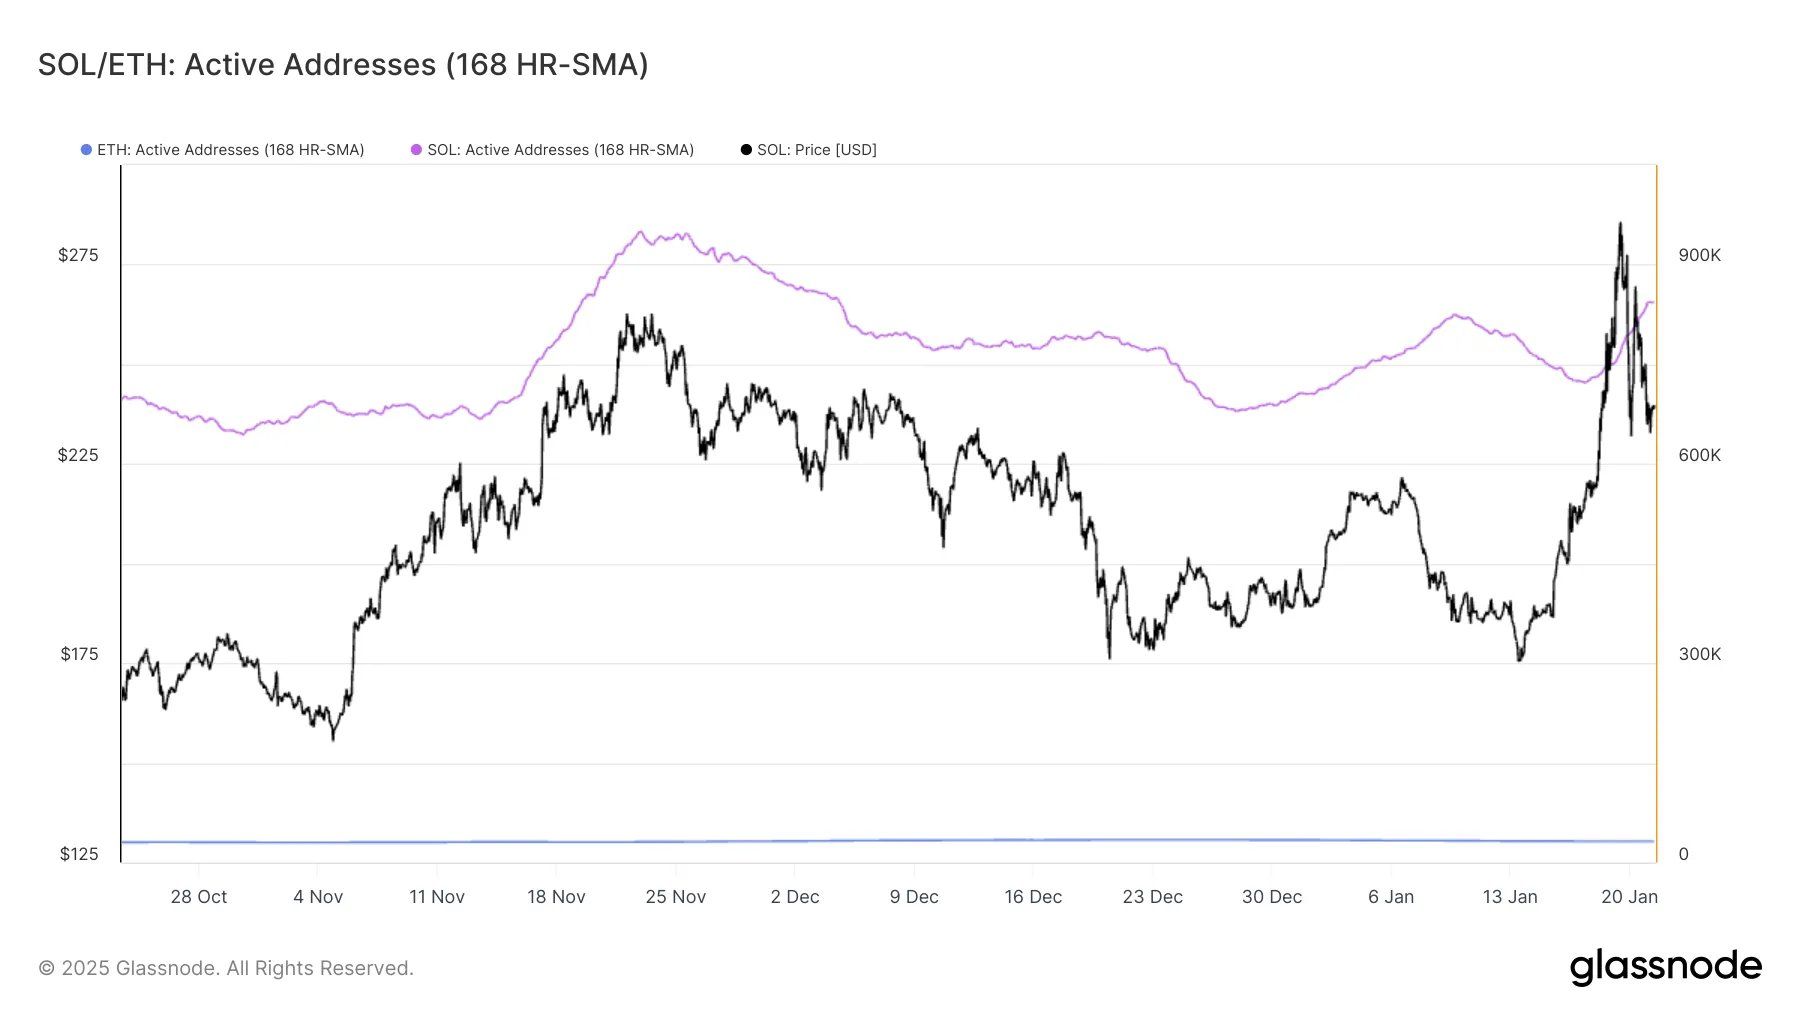
This development drove significant user engagement on Solana. According to Glassnode, by January 24, the network was processing 832,000 active addresses per hour, over 26 times more than Ethereum, which recorded just 31,000 per hour.
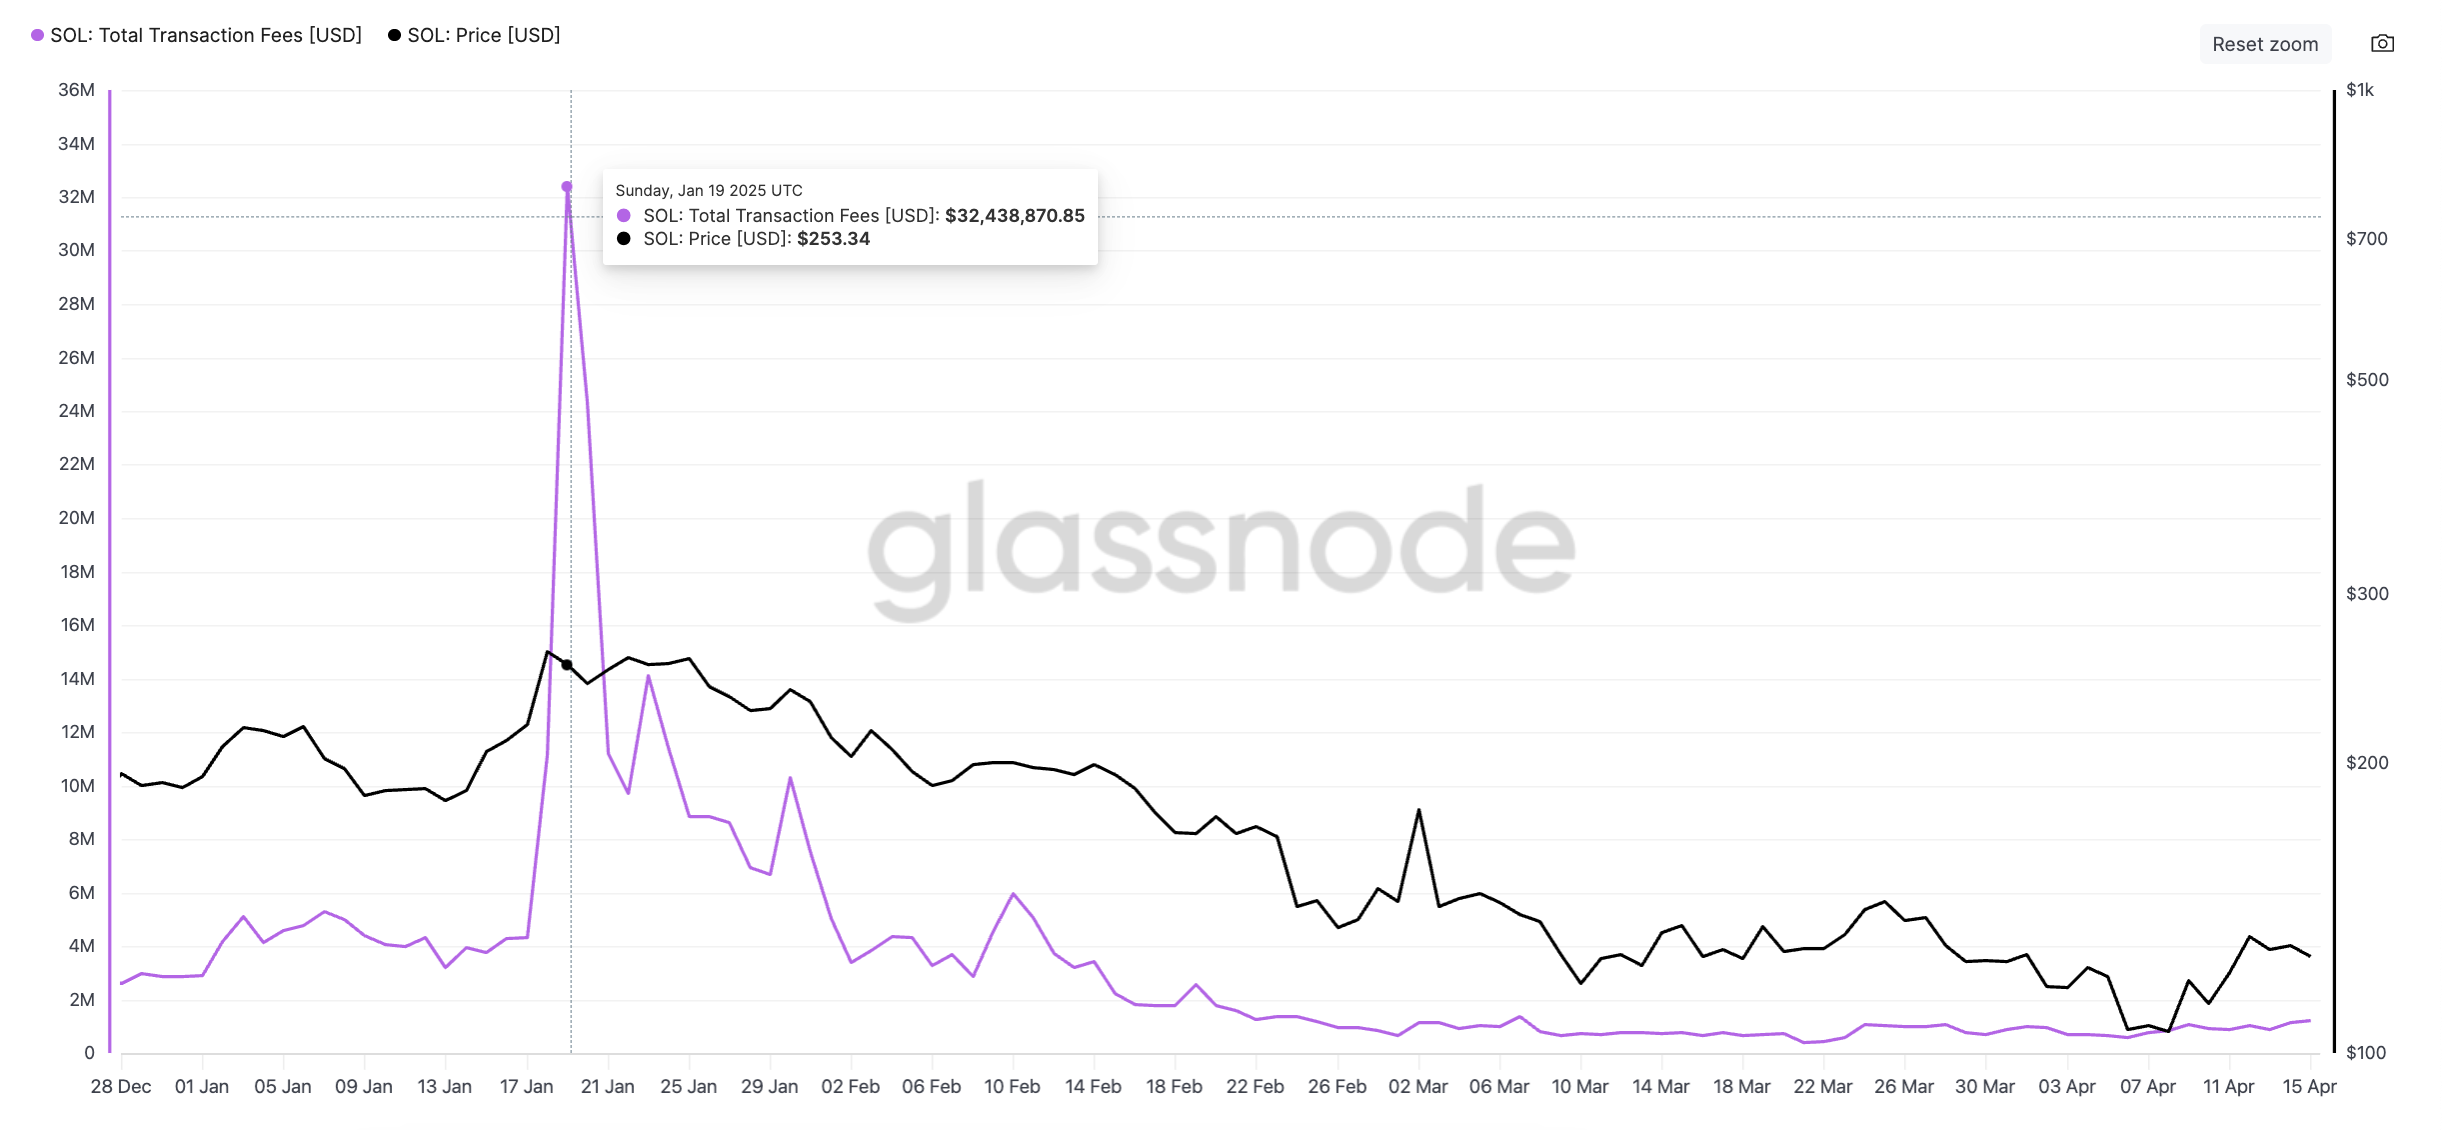
Due to the huge influx of new users on the network, transaction fees rocketed. Per Glassnode, Solana’s total transaction fees climbed to an all-time high of $32.43 million on January 19 after MELANIA launched. On the same day, SOL climbed to an all-time high of $293.
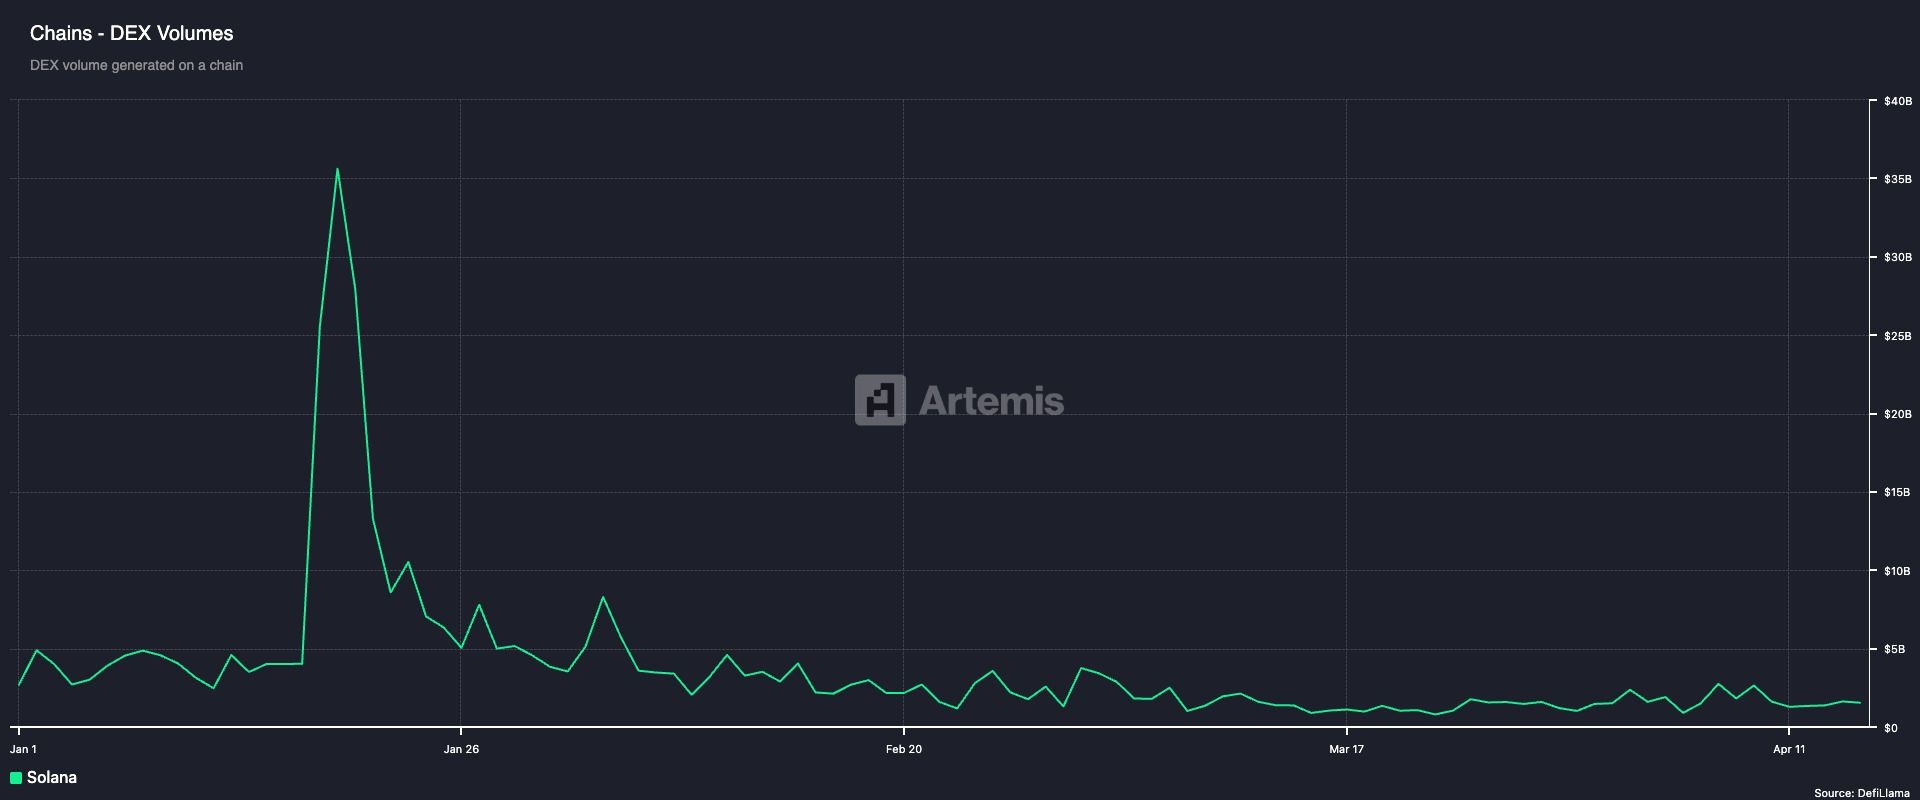
However, market exhaustion set in shortly after this price peak was reached. The meme coin mania began to fade, taking Solana users with it. Daily active addresses and new demand for the L1 plunged, dragging down DEX volume, SOL’s price, and DeFi TVL.
For example, SOL’s DEX volume hit an all-time high of $36 billion on January 19. But as the meme coin hype cooled off, by January 31, it had plummeted to just $3.8 billion, dropping nearly 90%. As of April 15, this totaled $1.5 billion.
Solana’s network revenue was not spared. Daily revenue, which rose to an all-time high of $16 million on January 19, plummeted to under $5 million by the end of January. Yesterday, the network’s total revenue from all transactions completed was under $115,000.

Solana Has Bigger Plans, Analyst Says
While TRUMP, MELANIA, and the slew of other meme coins that launched on Solana in the first few weeks of the year drove unprecedented network activity and boosted SOL’s value, the drop in their values and overall trading volumes has impacted the network’s performance.
It then raises the question of whether Solana’s actual value is now tied to this highly volatile, borderline chaotic asset class.
In an exclusive interview with BeInCrypto, Binance Research spokesperson Marina Zibareva noted that while these meme assets contributed to the network’s growth at the beginning of the year, Solana’s performance remains “increasingly driven by broader ecosystem fundamentals.”
According to Zibareva:
“We’ve seen DeFi TVL grow nearly 4x in SOL terms since January, and stablecoin supply has increased over 6x – pointing to lasting interest in real utility. Developer activity is also accelerating, with smart contract deployments rising almost 6x, suggesting strong long-term potential beyond the speculative wave.”
Although Solana’s inherent features make it a go-to destination for launching meme coins via platforms like Pump.fun, Jupiter, and Meteora, Zibareva sees a future for the network that stretches beyond meme coins.
“Meme coins have brought attention and users, but the long-term trajectory likely points toward use cases like DeFi, DePIN, Gaming, and SocialFi. Solana’s daily active addresses have increased nearly 6x year-to-date, and with its infrastructure battle-tested, we expect to see more developer activity focused on sustainable value creation,” she added.
Disclaimer
In line with the Trust Project guidelines, this price analysis article is for informational purposes only and should not be considered financial or investment advice. BeInCrypto is committed to accurate, unbiased reporting, but market conditions are subject to change without notice. Always conduct your own research and consult with a professional before making any financial decisions. Please note that our Terms and Conditions, Privacy Policy, and Disclaimers have been updated.


DWF Labs announced today that it invested $25 million into Trump Family-backed World Liberty Financial and is planning to open an office in New York City. It hopes to use this office to drive new relationships with regulators, financial institutions, and more.
Although this partnership would potentially create more liquidity opportunities for the US crypto market, previous allegations against DWF have raised some concerns about political misconduct.
Understanding DWF Labs’ Investment in WLFI
World Liberty Financial (WLFI), one of the Trump family’s major crypto ventures, has been making some big moves since the President’s inauguration in January.
The DeFi project allegedly entered talks with Binance to launch a new stablecoin, and it officially announced USD1 shortly after. Today, WLFI has entered a new partnership with Dubai-based Web3 investment firm DWF Labs.
“The US is the world’s largest single market for digital asset innovation. Our physical presence reflects our confidence in America’s role as the next growth region for institutional crypto adoption. Moreover, the USD1 stablecoin and forthcoming global DeFi solutions align with our broader mission to improve financial services,” claimed Managing Partner Andrei Grachev.
DWF’s statement includes a few key details about its new relationship with WLFI. It essentially boils down to two key points: the firm has already purchased $25 million in WLFI tokens, and it plans to open a physical office in New York City.
On a positive note, this partnership could be significant for the overall US crypto market. DWF Labs has a portfolio of over 700 crypto projects.
So, physically setting up a hub in New York will give me regulatory freedom and the opportunity to invest directly in the local crypto market. This would potentially open up more liquidity for upcoming Web3 projects and startups in the US
Concerns of Financial Misconduct
Although DWF Labs is a popular market maker, it has been at the center of major controversies. Last year, it was accused of wash trading and market manipulation, and Binance allegedly shut down its internal investigation due to financial incentives.
Also, one of its partners was dismissed back in October over allegations of drugging a job applicant. So, the firm’s credibility and reputation have been shaky in recent times.
This is to say that the crypto community has reasons to worry about a deal between DWF and World Liberty Financial. A report from late March determined that most WLFI revenues go directly to Trump’s family.
WLFI owners are unable to actually trade their tokens, and the stated governance use of the assets seems unclear. In other words, there isn’t a clear reason why anyone would invest.
The growing concern is that firms like DWF would invest in WLFI as an easy tool for political corruption. Shortly after the election, Tron founder Justin Sun invested $30 million into World Liberty. Trump’s family apparently got most of this money, and the SEC settled a fraud case against Tron in February.
If DWF Labs invested a similar amount in WLFI, could this give it some legal protection? The Department of Justice already gutted its Crypto Enforcement Team, and New York’s US Attorney also signaled its intent to stop crypto prosecutions.
As this deal goes forward, it will be important to look for signs of any possible financial misconduct.
BeInCrypto has contacted DWF Labs about the 2024 market manipulation claims but has yet to receive a reply.
Disclaimer
In adherence to the Trust Project guidelines, BeInCrypto is committed to unbiased, transparent reporting. This news article aims to provide accurate, timely information. However, readers are advised to verify facts independently and consult with a professional before making any decisions based on this content. Please note that our Terms and Conditions, Privacy Policy, and Disclaimers have been updated.

Raydium’s New Token Launchpad Competes with Pump.fun
Analyst Reveals Why The Solana Price Can Still Drop To $65

How It’s Impacting the Network

DWF Invests $25 Million in Trump’s World Liberty Financial
Are TRUMP Meme Coin Investors Selling Before Friday’s Unlock?

Mantra (OM) Price Pumps As Founder Reveals Massive Token Burn Plan

2.52 Million Altcoins Are Ruining Crypto’s Future

Animoca Brands Valuation Tanks 75% In Two Years, Here’s Why

Crypto exchange BingX hacked for $43 million

Are The Big Players Losing Interest?

Hong Kong’s Securities Association Tips Authorities On Crypto Self-Regulation

Coinbase cbBTC Set to go Live on Solana
2.52 Million Altcoins Are Ruining Crypto’s Future
Animoca Brands Valuation Tanks 75% In Two Years, Here’s Why
Crypto exchange BingX hacked for $43 million
Are The Big Players Losing Interest?
Hong Kong’s Securities Association Tips Authorities On Crypto Self-Regulation
Coinbase cbBTC Set to go Live on Solana
-

 Market23 hours ago
Bitcoin Eyes $90,000, But Key Resistance Levels Loom
-

 Ethereum19 hours ago
Ethereum Metrics Reveal Critical Support Level – Can Buyers Step In?
-

 Market19 hours ago
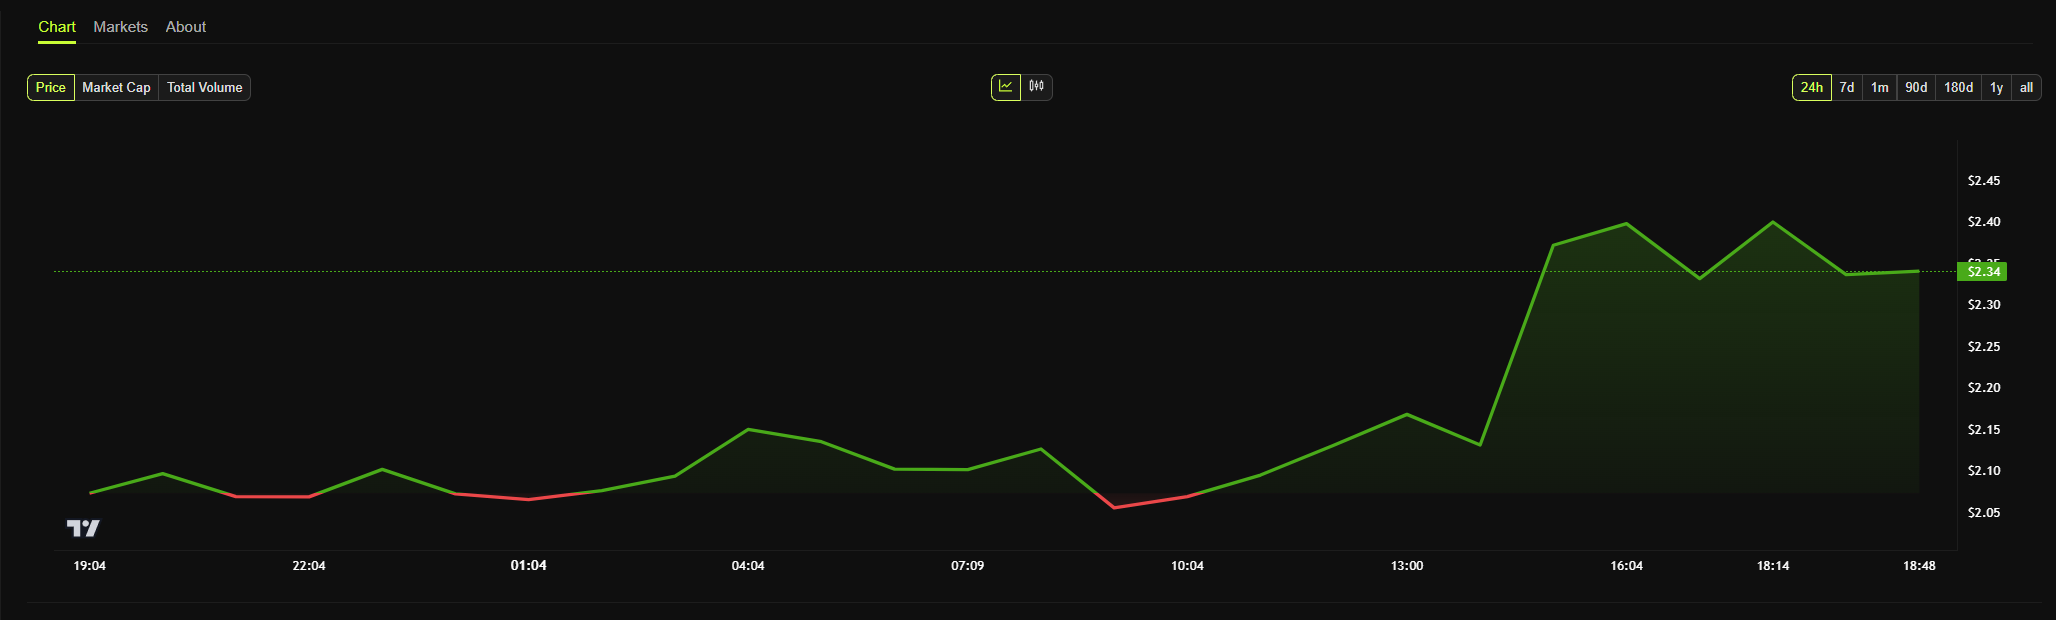
Solana (SOL) Jumps 20% as DEX Volume and Fees Soar
-

 Market18 hours ago
Hedera Under Pressure as Volume Drops, Death Cross Nears
-

 Bitcoin22 hours ago
Bitcoin Adoption Grows As Public Firms Raise Holdings In Q1
-

 Market16 hours ago
3 US Crypto Stocks to Watch Today: CORZ, MSTR, and COIN
-

 Market15 hours ago
Bitcoin Price on The Brink? Signs Point to Renewed Decline
-

 Market17 hours ago
Ethena Labs Leaves EU Market Over MiCA Compliance
