
Market
This is Why Bitcoin Could Face a Supply Shock Soon
Bitcoin may face a major supply shock as exchange reserves hit the lowest point in years. CryptoQuant data shows reserves at the lowest level since it began recording this data in 2022.
Additionally, demand for Bitcoin is spiking from long-term holders despite price turmoils. This supply shock could become a major bullish signal for the coming months.
Is Bitcoin Headed for a Supply Shock?
Since Bitcoin has reached a new era of market integration and institutional acceptance, corporate and individual whales are acquiring as much as they can.
Last month, ETF issuers were buying it 20x faster than miners could produce it, and they collectively hold more than Satoshi Nakamoto. However, due to these trends, Bitcoin’s supply is in jeopardy.
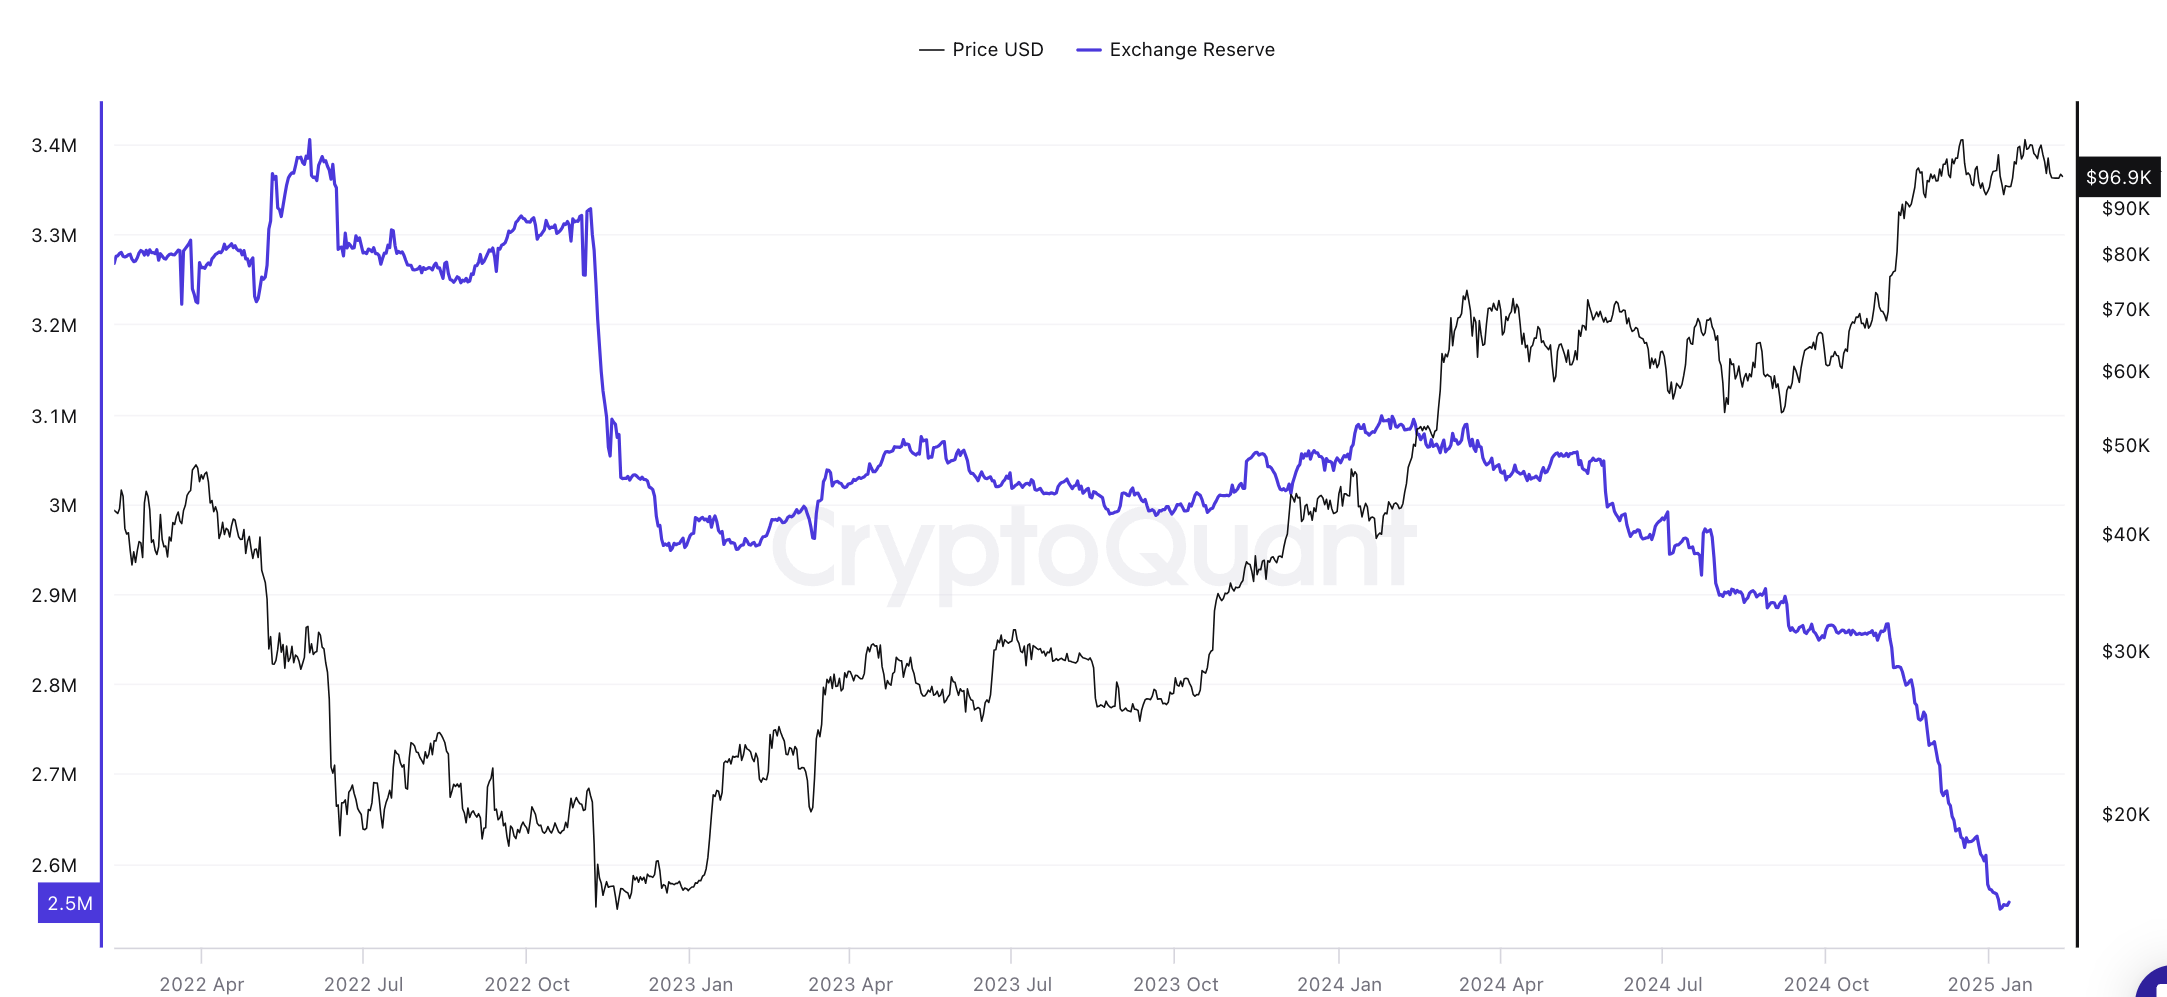
As CryptoQuant data shows, around 2.5 million BTC is currently held in exchange reserves. This is the lowest reserve balance in nearly 3 years.
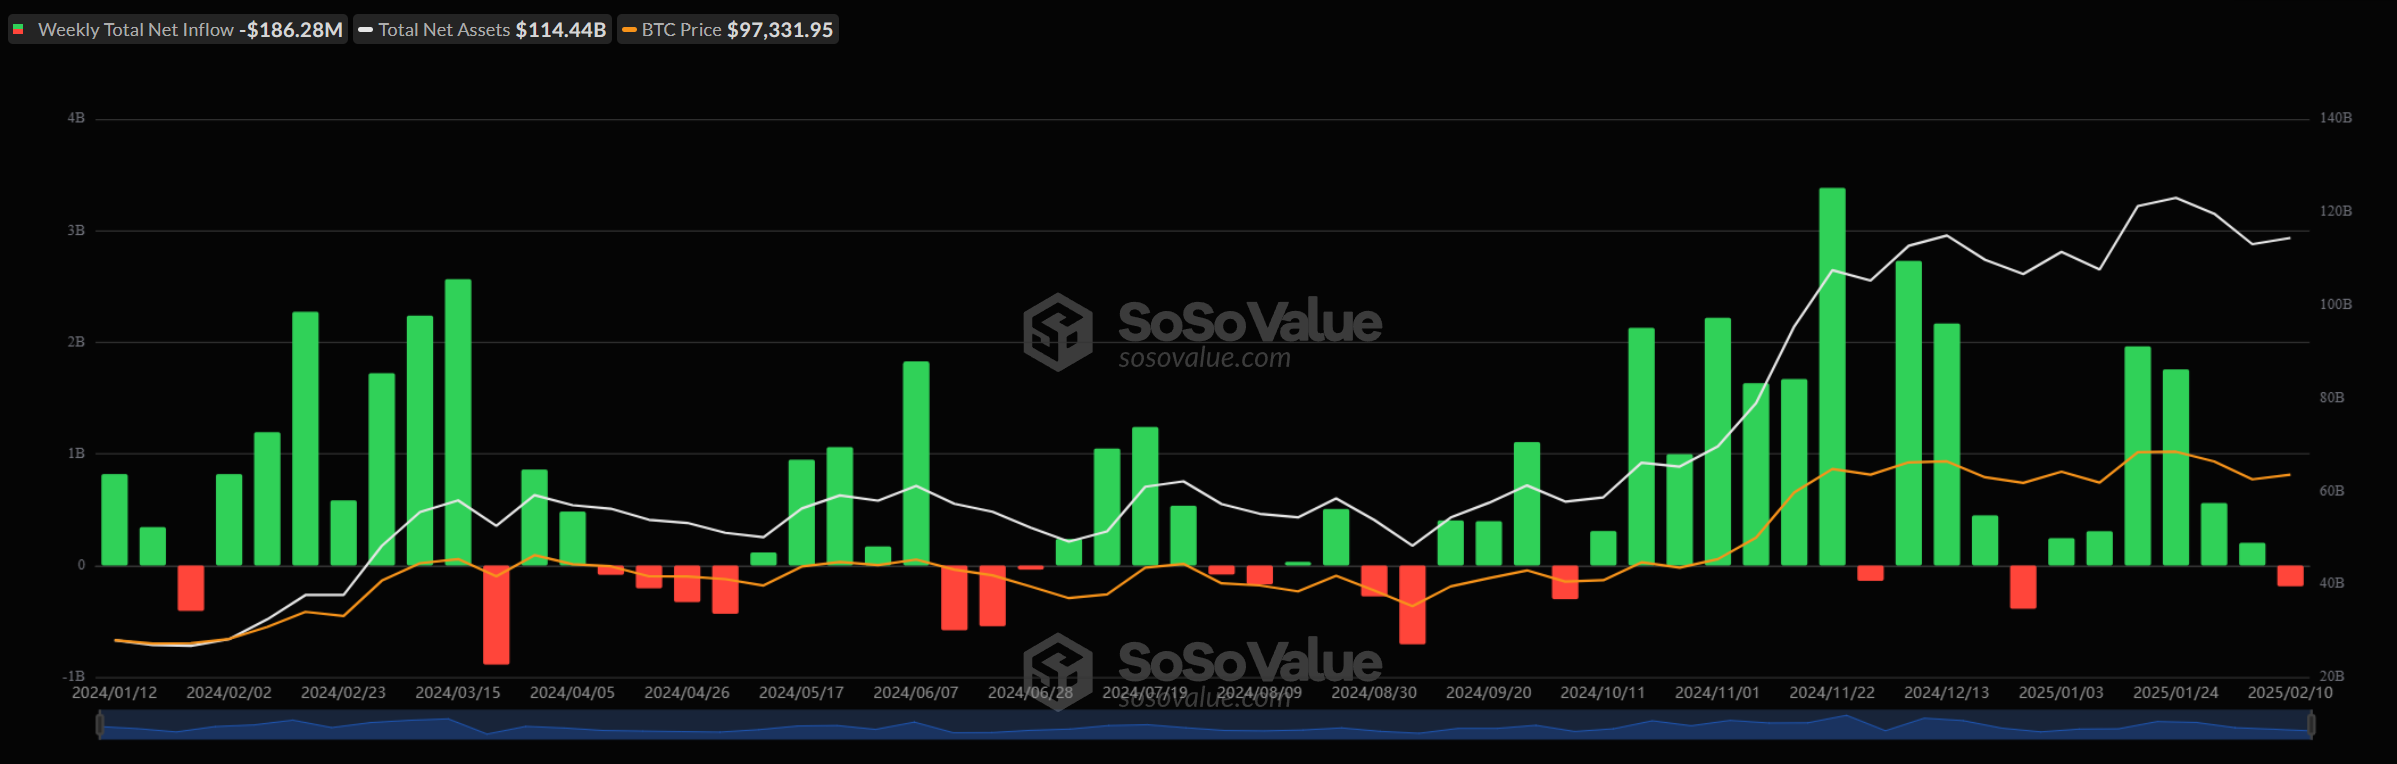
Additionally, the US Bitcoin ETF issuers and other corporate whales are very flashy buyers, but 69% of the supply is held by individuals. In fact, ETFs recently had their first weekly outflow of 2025, showing that the problem goes beyond them.
In other words, the supply crisis in Bitcoin is very real right now. Additionally, the vast majority of it has been mined already, with only 5.7% remaining. On top of that, unknown quantities are lost. A slight increase in demand could kick off a fresh, bullish cycle.
This demand may be materializing despite Bitcoin’s recent price declines. This week, the market has witnessed a sharp spike in Permanent Holder Demand, signaling strong confidence from individual users. These holders are also selling BTC less frequently. These factors could combine to create a Bitcoin supply shock.
“Soon every billionaire will buy a billion dollars of Bitcoin and the supply shock will be so great that we’ll stop measuring BTC in terms of fiat,” said Michael Saylor in a recent interview.
There’s also the consideration of a Bitcoin reserve in the US and many other countries. In the US, 20 states have currently proposed bills to establish a strategic Bitcoin reserve. If such strategies are approved, state and national governments will purchase BTC, and the supply will further decline.
So, at the current level, a Bitcoin supply chain is very much imminent. However, macroeconomic factors, such as interest rates and global tariffs, will also play a critical role.
Disclaimer
In adherence to the Trust Project guidelines, BeInCrypto is committed to unbiased, transparent reporting. This news article aims to provide accurate, timely information. However, readers are advised to verify facts independently and consult with a professional before making any decisions based on this content. Please note that our Terms and Conditions, Privacy Policy, and Disclaimers have been updated.


HBAR has recorded its first spot inflow in the past seven days, attracting $1.5 million in fresh capital.
This marks a positive shift in market sentiment as investors regain confidence in the altcoin. It also aligns with the broader market’s attempt to recover from recent downturns.
Bullish Momentum Builds as HBAR Gains $2 Million in Inflows
HBAR’s spot inflows surged to nearly $2 million on Monday, signaling a resurgence in bullish sentiment toward the altcoin. Data from Coinglass reveals that this is the first time HBAR has attracted fresh capital in seven days, marking a shift in investor confidence.
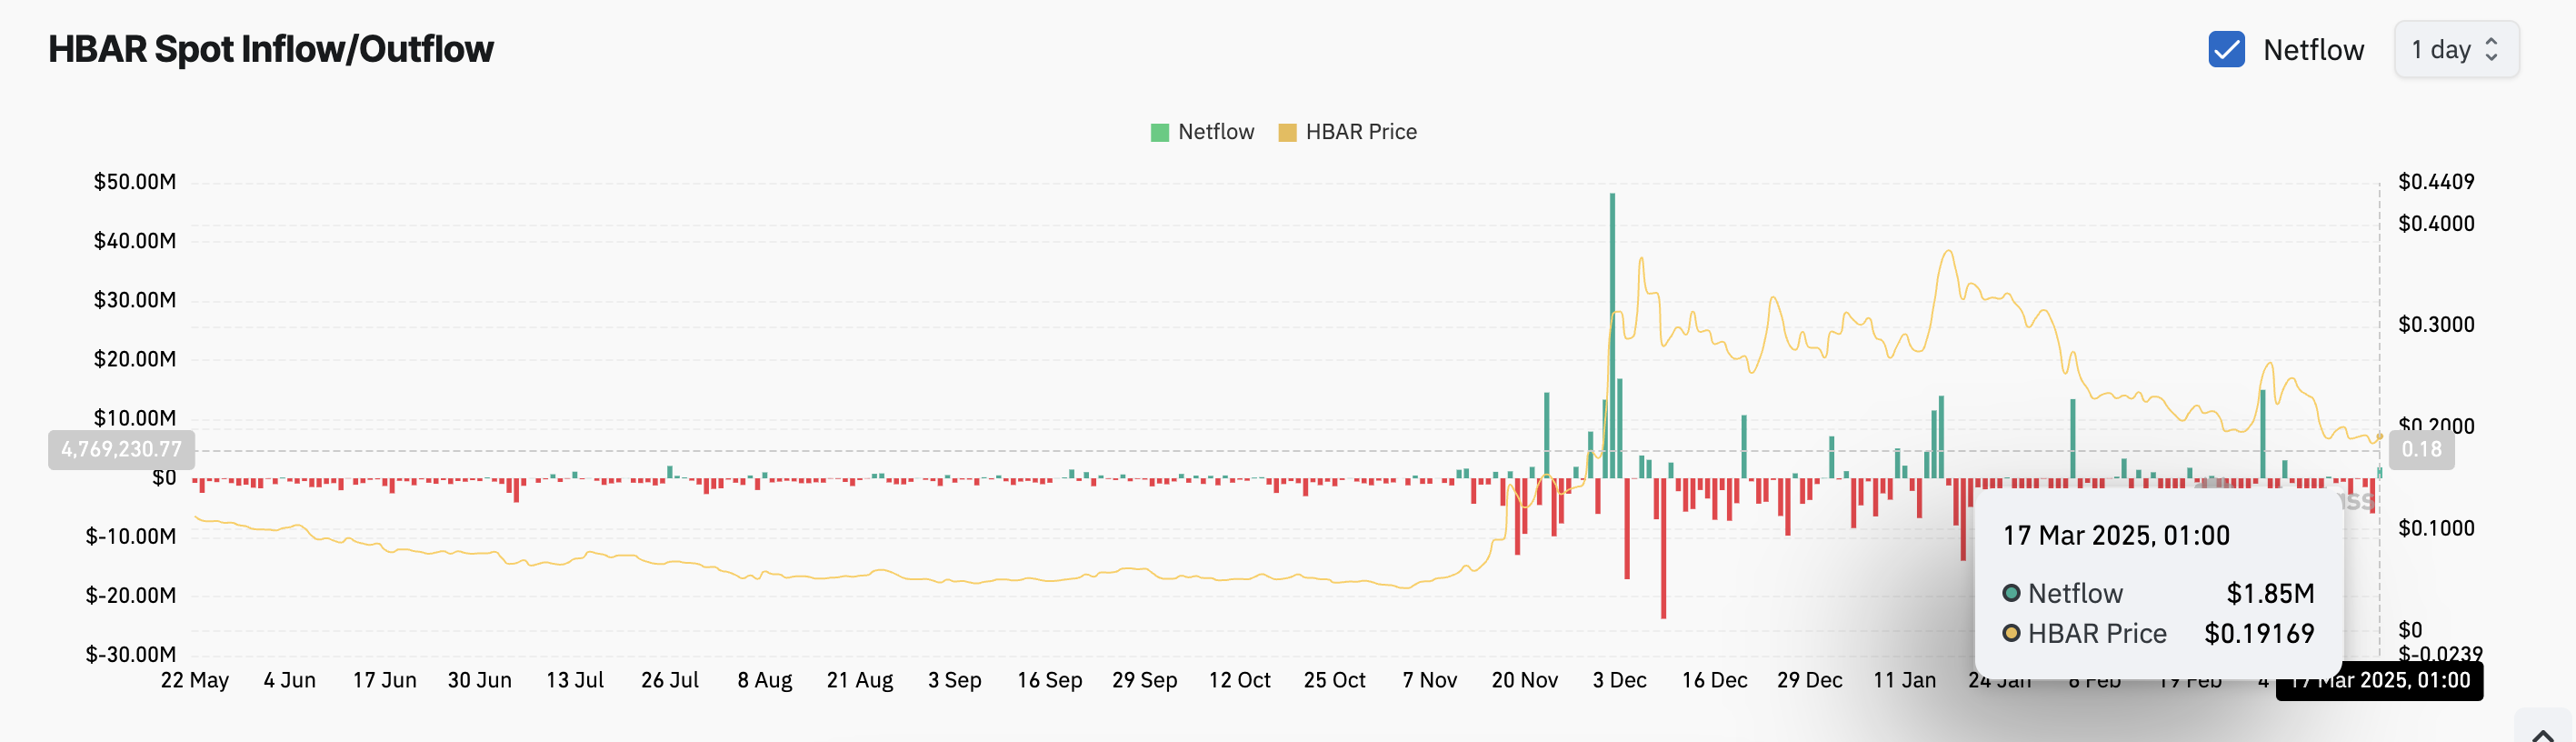
According to the on-chain data provider, between March 11 and 16, the altcoin faced consistent sell pressure, with spot outflows exceeding $10 million. This latest inflow suggests a bullish reversal in market sentiment, hinting at a possible recovery as investors regain interest in HBAR.
Furthermore, the altcoin’s positive Balance of Power (BoP) highlights this renewed interest. At press time, this momentum indicator is in an upward trend at 0.62.
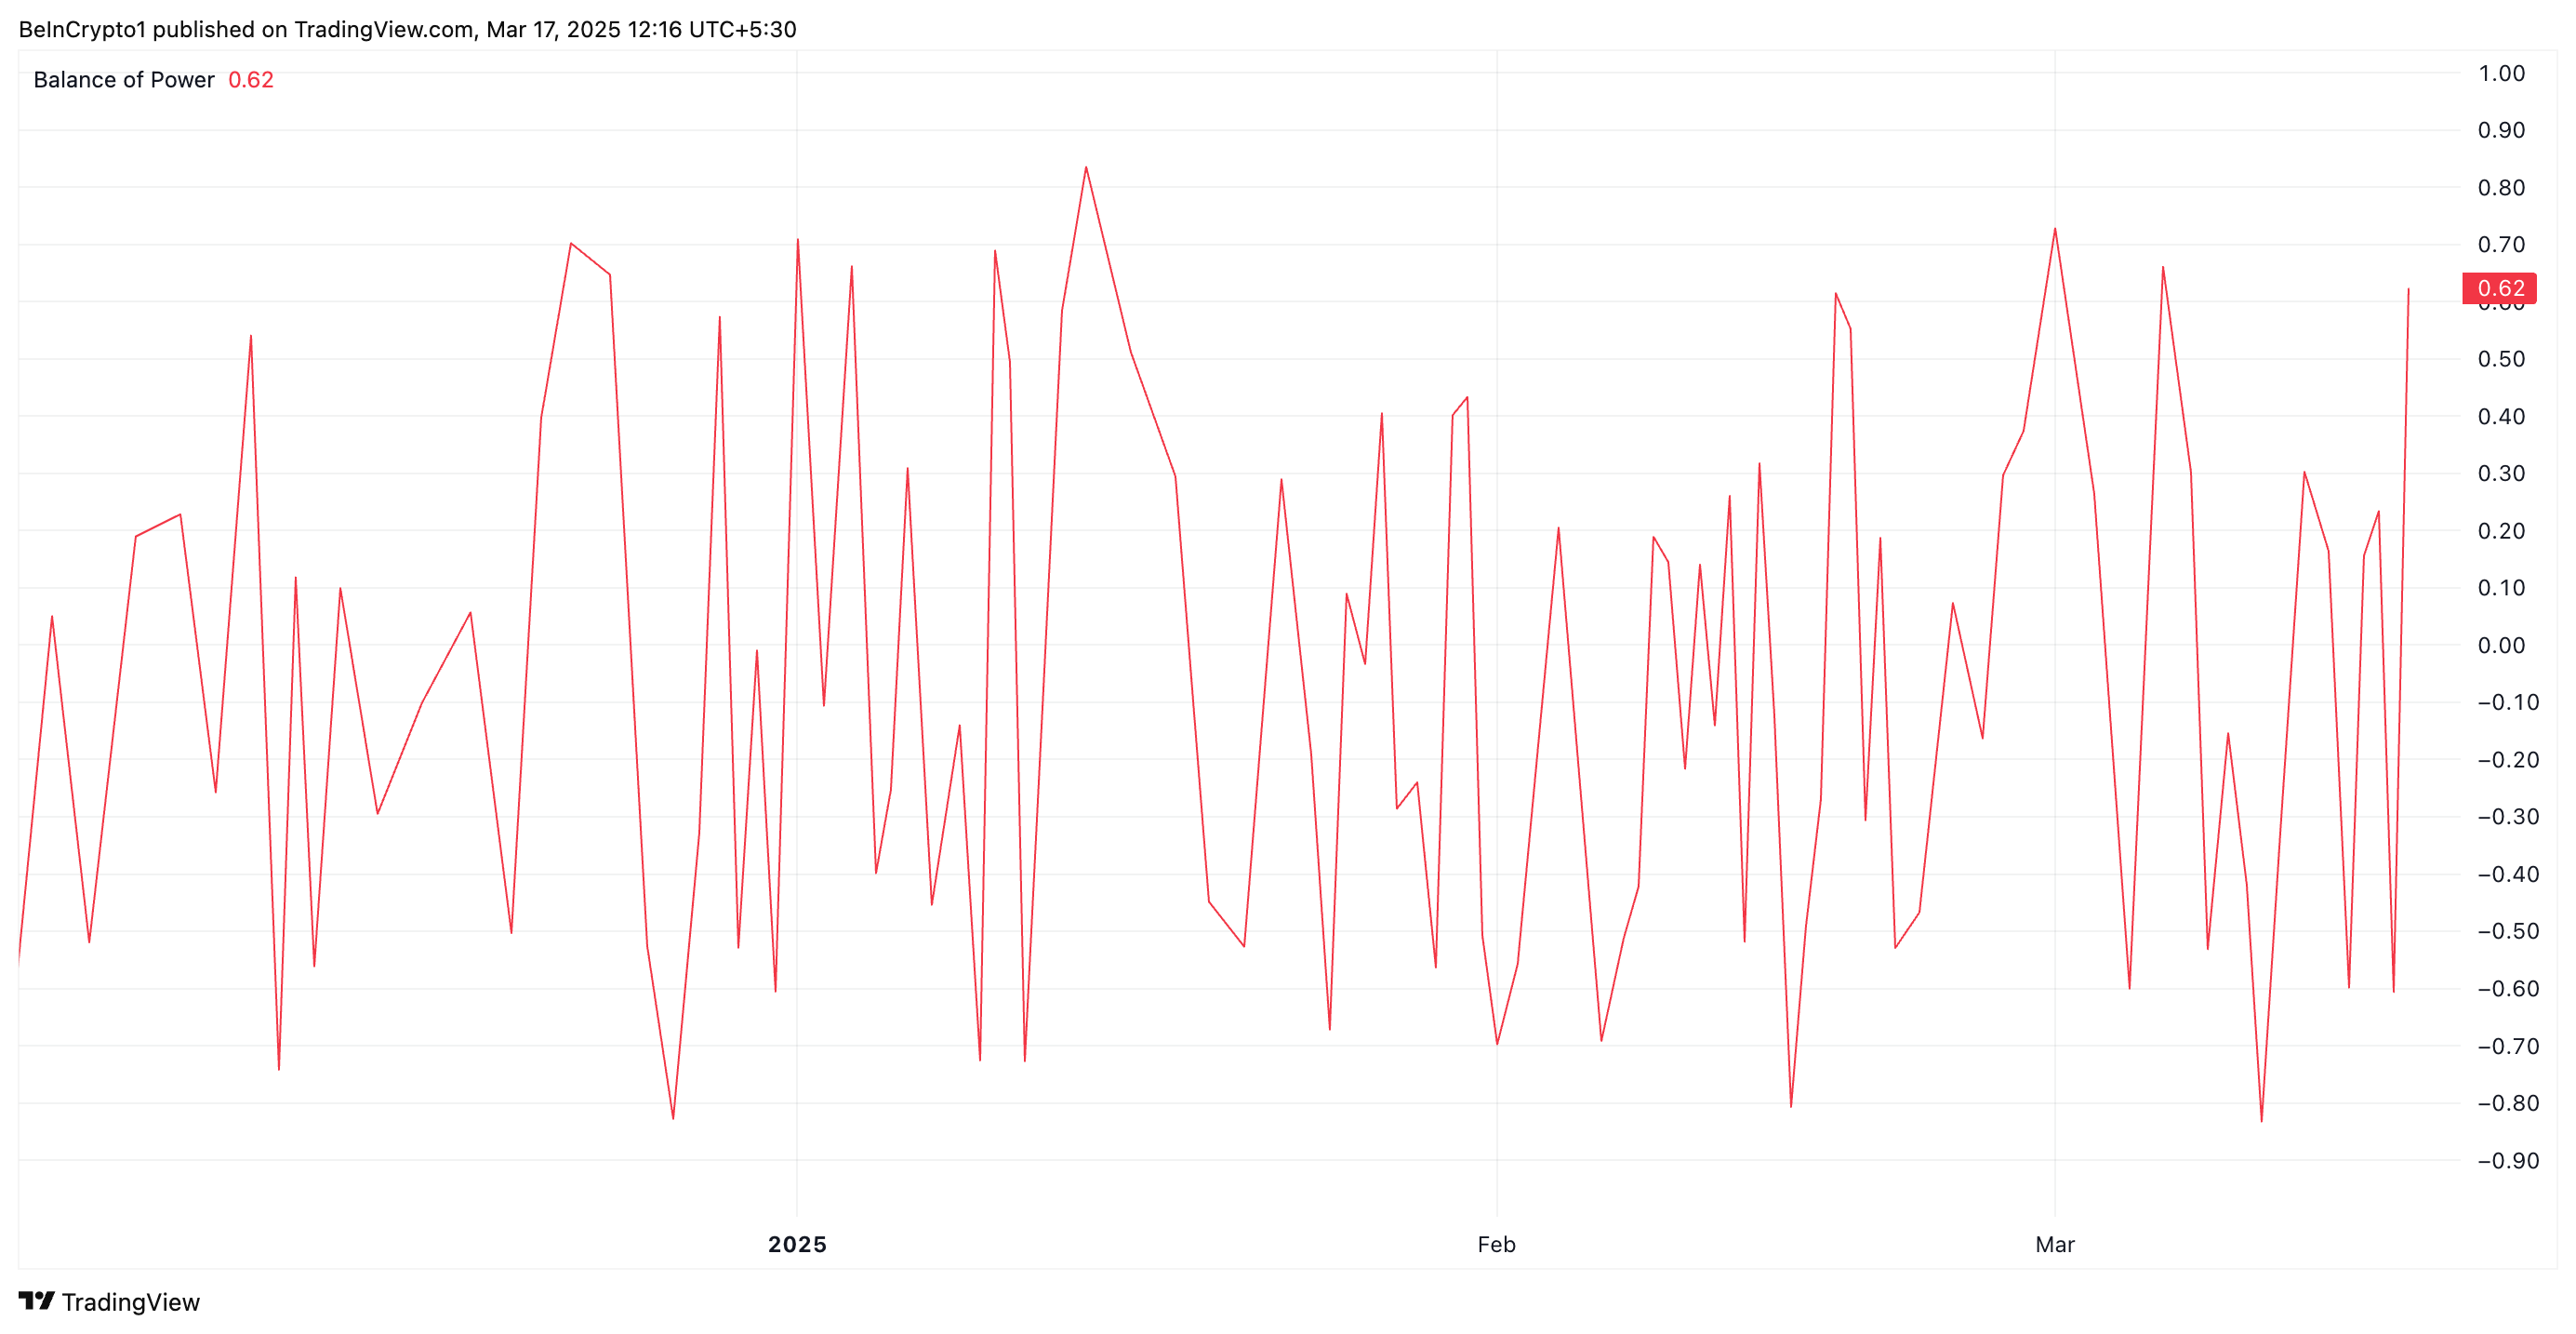
The BoP indicator measures the strength of buyers against sellers in the market to identify momentum shifts. A positive BoP like this suggests that buying pressure outweighs selling pressure, indicating growing demand and potential price appreciation.
If HBAR’s BoP remains positive, it confirms the bullish dominance, reinforcing the current buying pressure and supporting a sustained uptrend in the asset’s value.
HBAR Eyes $0.22 as Demand Grows—Will Bulls Maintain Momentum?
HBAR exchanges hands at $0.19 at press time, trading above the support floor at $0.17. As demand grows, the altcoin could climb toward the resistance at $0.22.
A successful break above this level could propel HBAR’s price to $0.26, a high it last traded at on March 4.
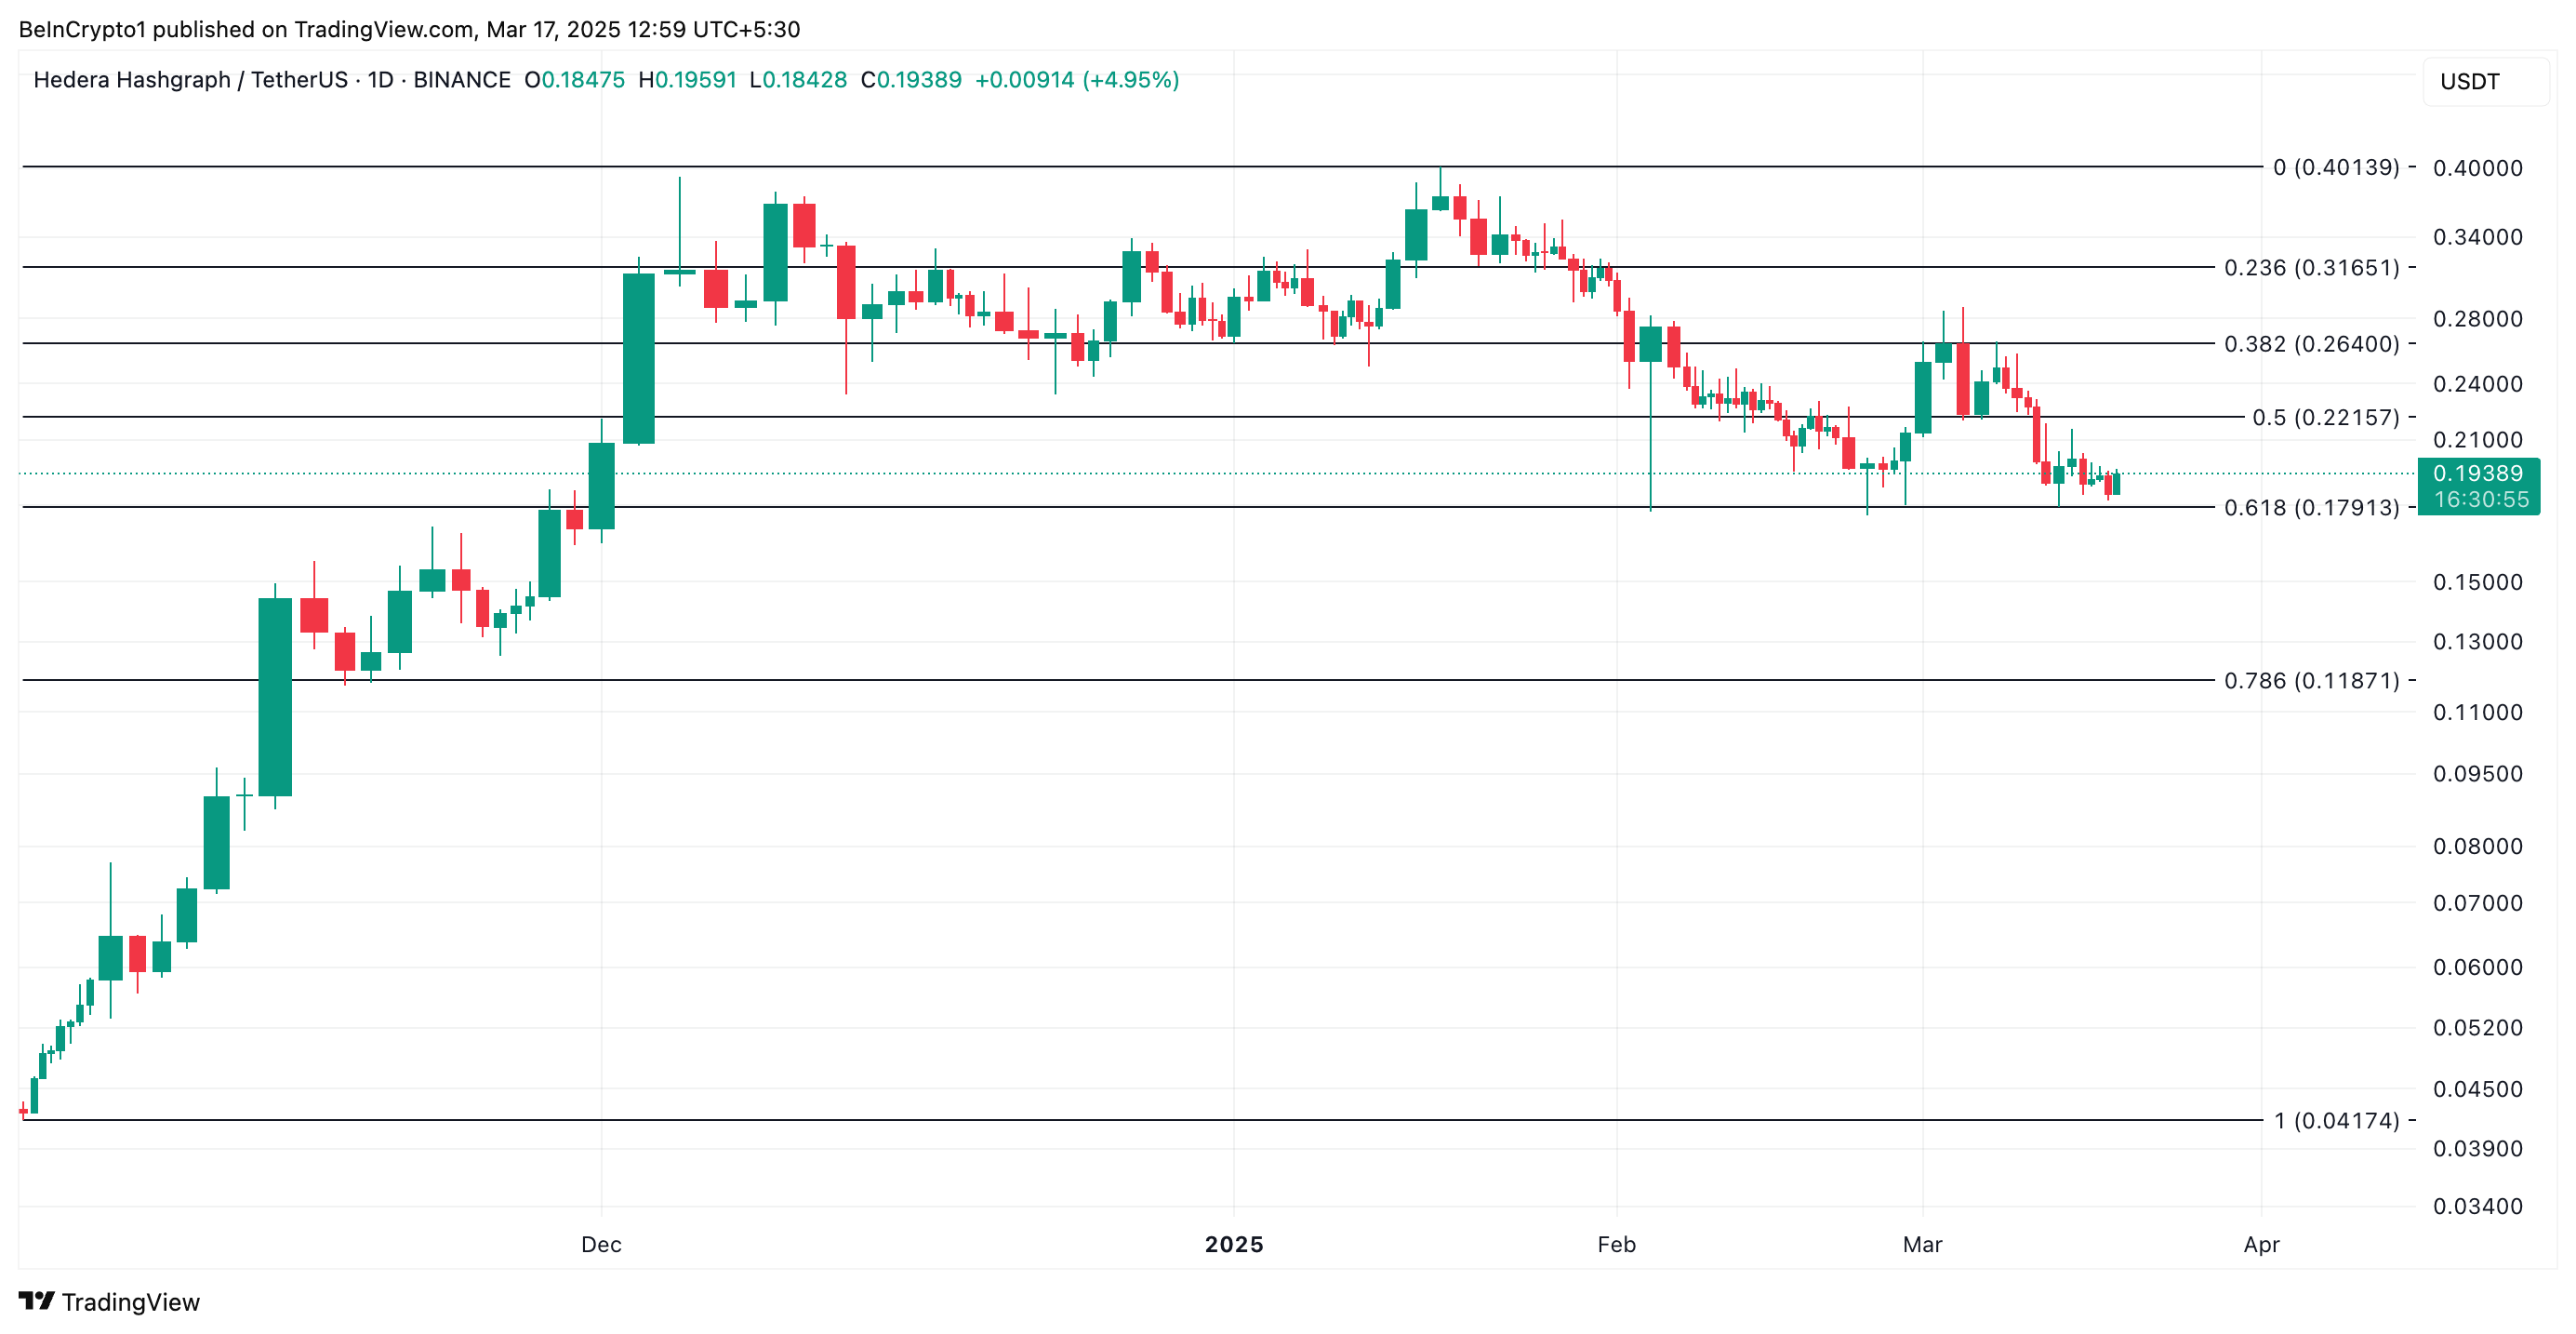
Conversely, the bullish outlook would be invalidated if sellers regain dominance and profit-taking strengthens. In this case, HBAR’s price could fall to $0.17.
Disclaimer
In line with the Trust Project guidelines, this price analysis article is for informational purposes only and should not be considered financial or investment advice. BeInCrypto is committed to accurate, unbiased reporting, but market conditions are subject to change without notice. Always conduct your own research and consult with a professional before making any financial decisions. Please note that our Terms and Conditions, Privacy Policy, and Disclaimers have been updated.
The CME opened futures trading on Solana today, with FalconX making the first block trade. This development could provide liquidity and institutional legitimacy, even potentially helping the case for a Solana ETF.
When the SEC under Gary Gensler was considering Bitcoin and Ethereum ETFs, CME futures helped determine approval. Now that Solana has this stamp of approval, too, it could improve its chances with the Commission.
CME Offers Solana Futures Contracts
After some rumors and back-and-forth, Solana, a leading cryptoasset, finally has a substantial market for futures contracts. In January, the CME hinted it might launch SOL and XRP futures but quickly clarified that no official decision had happened. Now, however, the CME debuted Solana futures and FalconX made the first trade:
“FalconX is proud to execute the first block trade in CME SOL futures with StoneX. This highly anticipated launch marks a historic moment for the Solana ecosystem, allowing institutional investors to manage risk and price exposure on a regulated venue,” Josh Barkhordar, Head of US Sales at FalconX, said in a press release.
The CME is not the first market to offer Solana futures, as Coinbase began offering them in February after seeking CFTC approval.
However, the CME is much bigger. It is very much a pillar of the TradFi ecosystem, with well over $100 billion in total assets. As Matthew Sigel, VanEck’s Head of Digital Assets Research, noted, this could be very important for a Solana ETF.
The Solana ETF recently suffered a few setbacks; the SEC delayed several applications, prompting sizable outflows from Solana spot trading. Experts have previously noted that a sizable futures trading market helped persuade the SEC to approve ETFs for Bitcoin and Ethereum. The CME’s new Solana futures market could serve a similar function.
Besides that, the CME’s Solana futures market offers a few significant advantages. First of all, it provides a sense of institutional legitimacy, which may encourage institutional investment.
Additionally, it will greatly increase liquidity in the market. This could have a huge impact on Solana’s future market behavior, but it hasn’t changed SOL’s price in the short term.
Even if the new futures trading didn’t immediately bump Solana’s price, that’s very understandable. A development like this will hopefully set up future successes, but that doesn’t always translate to a short-term price bump.
If it encourages liquidity, institutional investment, or even a Solana ETF, then the CME could end up creating some very bullish outcomes.
Disclaimer
In adherence to the Trust Project guidelines, BeInCrypto is committed to unbiased, transparent reporting. This news article aims to provide accurate, timely information. However, readers are advised to verify facts independently and consult with a professional before making any decisions based on this content. Please note that our Terms and Conditions, Privacy Policy, and Disclaimers have been updated.


Robinhood is launching a prediction markets hub thanks to a partnership with Kalshi. The hub will first offer bets on NCAA basketball tournaments but could expand after initial successes.
Both companies have been enjoying regulatory wiggle room under Trump’s administration. This new offering may put Robinhood in direct competition with Polymarket.
Robinhood’s New Prediction Market Hub
Robinhood, one of the largest trading platforms in the US, has been enjoying the recent pro-regulatory shift. Under Gary Gensler, the SEC ordered the company to pay a major fine, but it subsequently dropped its probe and penalties the following month.
Since then, Robinhood Crypto has been exploring a few new service offerings, such as a prediction markets hub.
According to a recent press release, Robinhood’s prediction markets hub will let its users trade on the outcomes of a wide variety of events. Shortly before the US election, the firm offered prediction betting on the topic of its outcome.
Now, thanks to a partnership with Kalshi, Robinhood will expand these services, beginning with US college basketball tournaments:
“[The team was] up till 4:20am working to get every single march madness game listed after Selection Sunday. The Robinhood engineering team was working in lockstep with up to ensure a smooth launch. We did it with elections and now we will do it for sports, together we will change the world of finance and trading,” claimed Tarek Mansour, CEO of Kalshi.
Kalshi also chafed under a harsh regulatory environment; last year, the CFTC tried to shut down its election-related prediction markets.
Today, however, Robinhood’s announcement claims that its prediction market hub is powered by “KalshiEX LLC, a CFTC regulated exchange.” This phrasing seems to suggest a less combative relationship with the regulator.
In any event, teaming up like this may put Robinhood in direct competition with Polymarket, the largest prediction market. Polymarket is still facing legal challenges in several worldwide jurisdictions, but its difficulties in the US have calmed down.
Robinhood, on the other hand, has been experimenting a little since Trump’s inauguration. A week after Trump took office, the firm began offering futures trading for Bitcoin and Ethereum, and its recent token listings moved the meme coin market.
In other words, Robinhood may have an opportunity to innovate and excel in a potential competition.
This prediction market hub is a major upgrade for Robinhood, but it picked a good focus area to start. Recent estimates claim that gamblers will place more than $3 billion in bets on NCAA tournaments this spring. Capturing a small share of this potential market would create significant revenue opportunities for the firm.
Disclaimer
In adherence to the Trust Project guidelines, BeInCrypto is committed to unbiased, transparent reporting. This news article aims to provide accurate, timely information. However, readers are advised to verify facts independently and consult with a professional before making any decisions based on this content. Please note that our Terms and Conditions, Privacy Policy, and Disclaimers have been updated.

Ethena Labs and Securitize to launch Converge, a new blockchain for DeFi

Can Bulls Push Price to $0.26?

French Banker Warns of Crypto-Induced Crisis

CME Opens Solana Futures Trading, Helping ETF Odds
Macroeconomic Events Shaping Crypto Markets This Week

Robinhood Offers Crypto Prediction Markets for Basketball Bets

2.52 Million Altcoins Are Ruining Crypto’s Future

Animoca Brands Valuation Tanks 75% In Two Years, Here’s Why

Crypto exchange BingX hacked for $43 million

Are The Big Players Losing Interest?

Hong Kong’s Securities Association Tips Authorities On Crypto Self-Regulation

Coinbase cbBTC Set to go Live on Solana
2.52 Million Altcoins Are Ruining Crypto’s Future
Animoca Brands Valuation Tanks 75% In Two Years, Here’s Why
Crypto exchange BingX hacked for $43 million
Are The Big Players Losing Interest?
Hong Kong’s Securities Association Tips Authorities On Crypto Self-Regulation
Coinbase cbBTC Set to go Live on Solana
-
 Altcoin12 hours ago
BNB Price Can Hit Fresh ATH As Mubarak Leads Meme Coin Frenzy
-

 Market11 hours ago
Solana Price’s Biggest Test: Breaching $180 Resistance
-

 Bitcoin10 hours ago
Bitcoin Bulls Eye Comeback After $10 Billion Liquidation Shakeout—Analyst
-
 Altcoin11 hours ago
Lawyers React As Expert Hints At Ripple Vs SEC Case End
-

 Bitcoin9 hours ago
Why Bitcoin And Crypto Will Not Recover Before US Equities Market: Expert
-

 Altcoin6 hours ago
The New Frontier of Altcoin Futures Trading: Gate.io’s Ecosystem Innovation.
-
 Altcoin8 hours ago
Binance Unveils Major Backing For MKR, EPIC, & These 3 Crypto, What’s Happening?
-

 Market7 hours ago
YZi Labs Backs Plume Network’s RWAfi Ecosystem